This comprehensive SOLV price prediction analysis examines Solv Protocol's market position within the Bitcoin staking ecosystem, currently trading at $0.01285 with a $19.05 million market cap as of January 2026. The article provides detailed price forecasts ranging from 2026 to 2031, with conservative predictions at $0.0086-$0.01283 for 2026 and optimistic long-term scenarios potentially reaching $0.02623 by 2031. Through technical analysis, holdings distribution assessment, and market sentiment evaluation, the guide addresses key investment factors including volatility risks, liquidity constraints, and regulatory uncertainties. Designed for investors at all levels, this guide offers actionable strategies including dollar-cost averaging, grid trading on Gate, and risk management frameworks to navigate SOLV's evolving Bitcoin DeFi landscape while emphasizing the importance of prudent portfolio allocation and security practices.
Introduction: SOLV's Market Position and Investment Value
Solv Protocol (SOLV), as a leading Bitcoin staking protocol building a thriving Bitcoin-centric financial ecosystem, has been making significant strides in unlocking liquidity and maximizing the utility of idle Bitcoin assets since its launch in 2025. As of 2026, SOLV has reached a market capitalization of approximately $19.05 million, with a circulating supply of about 1.48 billion tokens, and its price currently maintains around $0.01285. This asset, known for its innovative approach to Bitcoin liquidity solutions, is playing an increasingly important role in the DeFi and Bitcoin staking sectors.
This article will comprehensively analyze SOLV's price trends from 2026 to 2031, combining historical patterns, market supply and demand dynamics, ecosystem development, and macroeconomic conditions to provide investors with professional price forecasts and practical investment strategies.
I. SOLV Price History Review and Market Status
SOLV Historical Price Evolution Trajectory
- 2025: Token launched on January 17 at initial price of $0.03, reaching all-time high of $0.1737 on the same day, demonstrating strong initial market reception
- 2025: Following launch peak, price experienced significant correction, declining from ATH of $0.1737 towards lower levels throughout the year
- 2025-2026: Market cycle adjustment period, with price reaching all-time low of $0.00278 on October 10, 2025, reflecting broader market sentiment shifts
SOLV Current Market Status
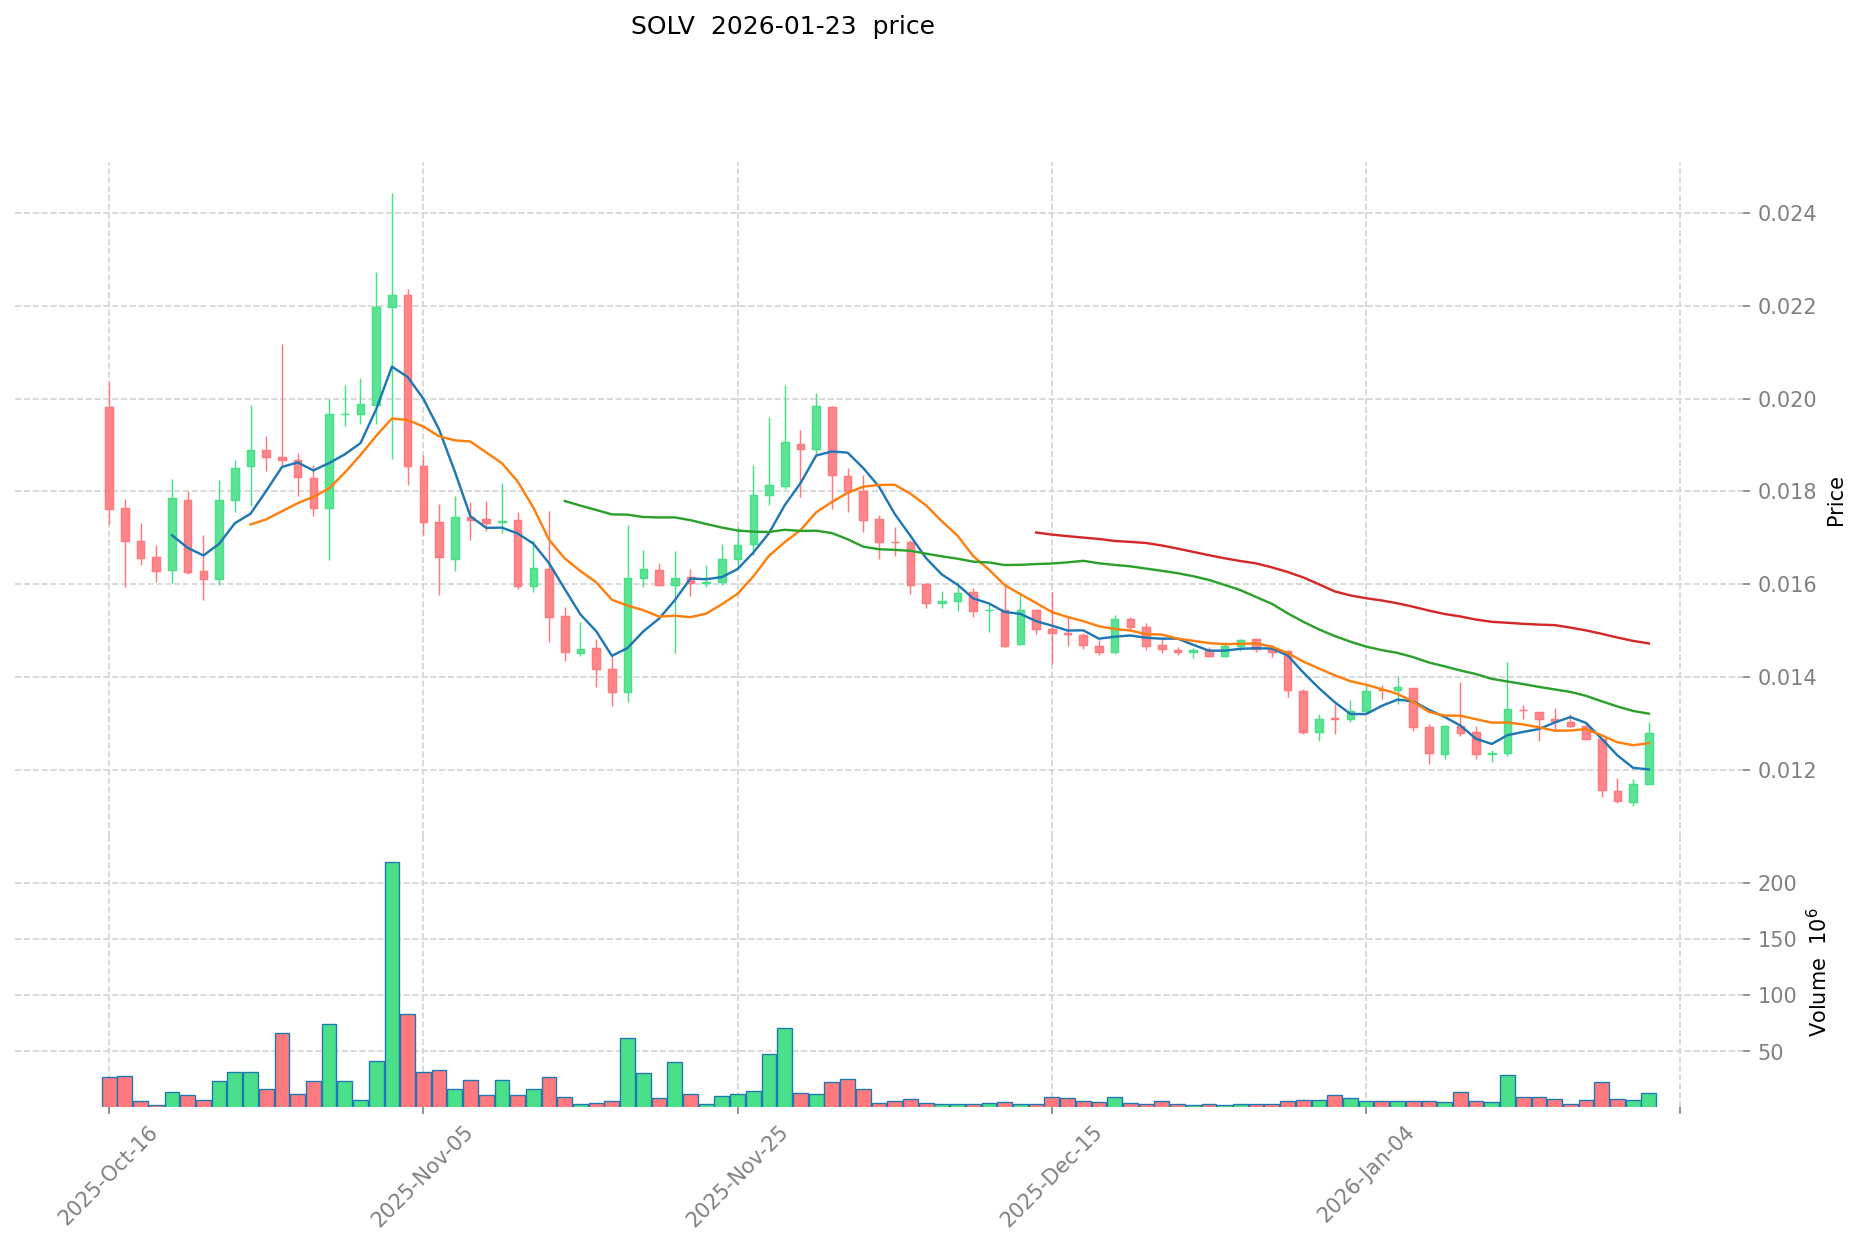
As of January 23, 2026, SOLV is trading at $0.01285, representing an 82.96% decrease from its all-time high. The token has shown recent volatility with a 24-hour price range between $0.0118 and $0.01348, indicating a trading amplitude of approximately 14.2%. Over the past 24 hours, SOLV has posted an 8.52% gain, though the token remains under pressure on longer timeframes with a 3.23% decline over 7 days and a 10.82% decrease over 30 days.
The current market capitalization stands at $19.05 million, with a circulating supply of 1.48 billion SOLV tokens, representing 15.35% of the maximum supply of 9.66 billion tokens. The fully diluted market cap is calculated at $124.13 million. Trading volume over the past 24 hours reached $333,332, reflecting moderate market activity. The token maintains listings across 33 exchanges and has attracted 127,466 holders since launch.
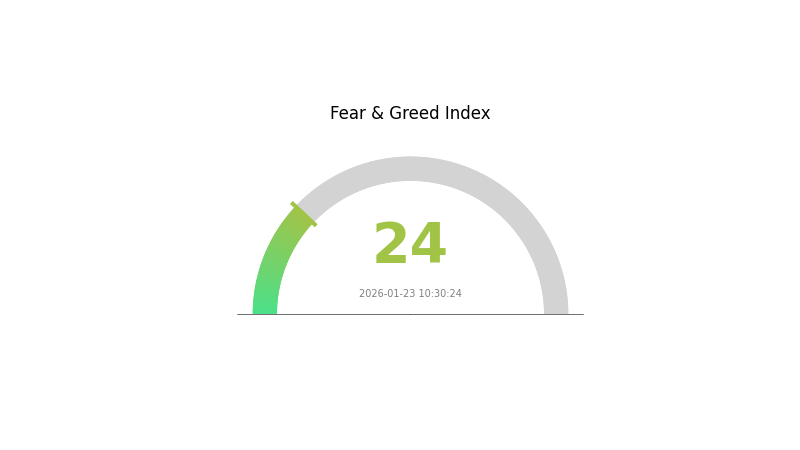
The cryptocurrency market sentiment index currently registers at 24, indicating an "Extreme Fear" environment, which may be influencing SOLV's price performance alongside broader market dynamics affecting Bitcoin-related protocols.
Click to view current SOLV market price
SOLV Market Sentiment Indicator
2026-01-23 Fear and Greed Index: 24 (Extreme Fear)
Click to view current Fear & Greed Index
The crypto market is currently experiencing extreme fear, with the Fear and Greed Index standing at 24. This reading indicates widespread pessimism and risk aversion among investors. Market participants are displaying heightened caution, with selling pressure potentially intensifying. Such extreme fear conditions historically present contrarian opportunities for long-term investors, as panic-driven price declines may create entry points. However, near-term volatility remains elevated. Traders should exercise prudent risk management and avoid FOMO-driven decisions during periods of market distress.
SOLV Holdings Distribution
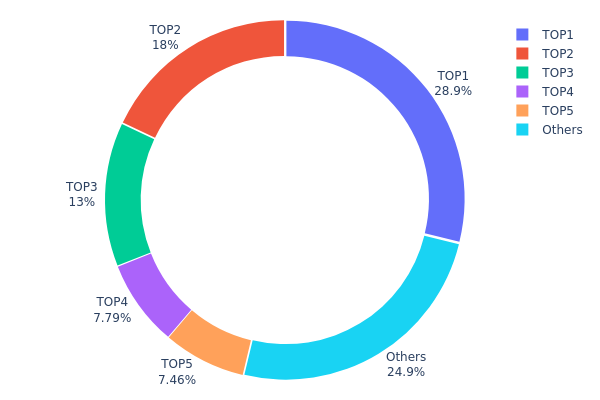
The holdings distribution chart represents the concentration of token ownership across different wallet addresses, serving as a crucial metric for evaluating the decentralization level and potential market manipulation risks. By analyzing the percentage of total supply held by top addresses versus smaller holders, investors can assess the structural health of the token's on-chain ecosystem and anticipate potential price volatility triggered by large holder movements.
Based on the current data, SOLV exhibits a moderate to high concentration pattern. The top five addresses collectively control approximately 75.11% of the total token supply, with the largest single address (0xbf1f...b44ca0) holding 28.86%. The second and third largest holders account for 18.00% and 13.00% respectively. This distribution structure indicates that a significant portion of SOLV tokens remains concentrated among a limited number of entities, which could be institutional investors, project treasury wallets, or early-stage participants. The "Others" category, representing all remaining addresses, comprises only 24.89% of the supply, suggesting relatively limited token dispersion among retail investors.
This concentration level presents both structural implications and market risks. On one hand, the dominance of top addresses could facilitate coordinated selling pressure or market manipulation, potentially leading to increased price volatility during significant market movements. Large holders possess substantial influence over liquidity dynamics and can trigger cascading liquidations through strategic position adjustments. On the other hand, if these concentrated holdings represent locked team allocations, strategic reserves, or long-term institutional positions, they may actually contribute to supply stability by reducing circulating tokens available for speculative trading. The current distribution pattern reflects a relatively centralized on-chain structure, which investors should monitor closely for any significant transfer activities that might signal impending market shifts.
Click to view current SOLV Holdings Distribution
| Top |
Address |
Holding Qty |
Holding (%) |
| 1 |
0xbf1f...b44ca0 |
2424240.00K |
28.86% |
| 2 |
0x82b3...a61c5f |
1512000.00K |
18.00% |
| 3 |
0x07ea...0b8205 |
1092000.00K |
13.00% |
| 4 |
0xa354...e254ef |
654360.00K |
7.79% |
| 5 |
0x5a52...70efcb |
626990.43K |
7.46% |
| - |
Others |
2090409.57K |
24.89% |
II. Core Factors Influencing SOLV's Future Price
Based on the current available information, there is insufficient data regarding SOLV's supply mechanisms, institutional dynamics, macroeconomic positioning, and technical developments to provide a comprehensive analysis at this time. As more information becomes available about the project's tokenomics, adoption patterns, and ecosystem development, a more detailed assessment can be conducted.
For the latest updates on SOLV and other cryptocurrency projects, users can visit Gate.com to access real-time market data and trading opportunities.
III. 2026-2031 SOLV Price Prediction
2026 Outlook
- Conservative prediction: $0.0086 - $0.01283
- Neutral prediction: $0.01283
- Optimistic prediction: $0.01642 (requires favorable market conditions and increased adoption)
2027-2029 Outlook
- Market stage expectation: The token is anticipated to enter a gradual growth phase, with prices showing steady upward momentum as the project matures and ecosystem development progresses.
- Price range predictions:
- 2027: $0.01389 - $0.01784 (approximately 13% increase from 2026)
- 2028: $0.01542 - $0.01867 (approximately 26% increase from 2026)
- 2029: $0.01012 - $0.0185 (approximately 35% increase from 2026)
- Key catalysts: Enhanced platform utility, expanded partnerships within the DeFi ecosystem, and broader market recovery could serve as primary drivers for price appreciation during this period.
2030-2031 Long-term Outlook
- Baseline scenario: $0.0169 - $0.01798 (assuming steady ecosystem growth and stable market conditions)
- Optimistic scenario: $0.01861 - $0.02623 (contingent upon significant protocol upgrades, mainstream adoption, and favorable regulatory developments)
- Transformational scenario: Potential to reach $0.02623 by 2031 (requires breakthrough innovations, large-scale institutional adoption, and exceptional market conditions)
- 2026-01-23: SOLV trading within the $0.0086 - $0.01642 range (entering initial prediction period)
| Year |
Predicted High Price |
Predicted Average Price |
Predicted Low Price |
Price Change |
| 2026 |
0.01642 |
0.01283 |
0.0086 |
0 |
| 2027 |
0.01784 |
0.01463 |
0.01389 |
13 |
| 2028 |
0.01867 |
0.01624 |
0.01542 |
26 |
| 2029 |
0.0185 |
0.01745 |
0.01012 |
35 |
| 2030 |
0.01923 |
0.01798 |
0.0169 |
39 |
| 2031 |
0.02623 |
0.01861 |
0.01321 |
44 |
IV. SOLV Professional Investment Strategy and Risk Management
SOLV Investment Methodology
(1) Long-term Holding Strategy
- Target Investors: Investors with high risk tolerance who believe in Bitcoin-centric DeFi ecosystem development
- Operational Recommendations:
- Consider dollar-cost averaging (DCA) to build positions during market downturns, avoiding lump-sum investments
- Monitor protocol development milestones and ecosystem expansion progress as key holding indicators
- Utilize Gate Web3 Wallet for secure storage, enabling multi-signature features for enhanced security
(2) Active Trading Strategy
- Technical Analysis Tools:
- Moving Averages: Use 20-day and 50-day moving averages to identify trend reversals and entry/exit points
- RSI Indicator: Monitor overbought (above 70) and oversold (below 30) conditions for potential reversal opportunities
- Swing Trading Key Points:
- Set stop-loss orders at 8-10% below entry price to limit downside risk
- Take partial profits at predetermined resistance levels while maintaining core position
SOLV Risk Management Framework
(1) Asset Allocation Principles
- Conservative Investors: 1-3% of crypto portfolio allocation
- Aggressive Investors: 5-8% of crypto portfolio allocation
- Professional Investors: Up to 10-15% with active management and hedging strategies
(2) Risk Hedging Solutions
- Diversification: Combine SOLV holdings with stablecoins and major cryptocurrencies to reduce volatility exposure
- Position Sizing: Scale positions based on market conditions and volatility levels, reducing exposure during uncertain periods
(3) Secure Storage Solutions
- Hot Wallet Recommendation: Gate Web3 Wallet for active trading with convenient access and integrated security features
- Cold Storage Solution: Transfer long-term holdings to hardware wallets after accumulation phase
- Security Precautions: Enable two-factor authentication, maintain separate wallets for trading and holding, and never share private keys or seed phrases
V. SOLV Potential Risks and Challenges
SOLV Market Risks
- High Volatility: SOLV has experienced significant price fluctuations, with a historical high of $0.1737 and low of $0.00278, indicating substantial downside potential
- Low Liquidity: With a 24-hour trading volume of approximately $333,000 and market cap of $19 million, SOLV may face liquidity constraints during volatile periods
- Limited Market Maturity: Trading on 33 exchanges with 15.35% of tokens in circulation suggests concentrated holder distribution and potential supply pressure
SOLV Regulatory Risks
- Bitcoin Staking Uncertainty: Evolving regulatory frameworks around Bitcoin staking products may impact protocol operations and token utility
- Securities Classification: Potential regulatory scrutiny regarding token classification could affect trading availability and accessibility
- Cross-border Compliance: As a global protocol, SOLV must navigate varying jurisdictional requirements, which may impact service offerings
SOLV Technical Risks
- Smart Contract Vulnerabilities: As a DeFi protocol, SOLV faces inherent risks associated with smart contract exploits and security breaches
- Bitcoin Integration Complexity: Technical challenges in bridging Bitcoin liquidity to DeFi ecosystems may affect protocol functionality
- Competition: Emerging Bitcoin staking and liquidity protocols may challenge SOLV's market position and growth trajectory
VI. Conclusion and Action Recommendations
SOLV Investment Value Assessment
SOLV Protocol operates in the emerging Bitcoin staking and liquidity sector, positioning itself within the growing Bitcoin DeFi ecosystem. The protocol's focus on unlocking liquidity from idle Bitcoin assets addresses a significant market opportunity. However, investors should consider the token's substantial decline of 82.96% over the past year and relatively low market capitalization of $19 million when evaluating investment potential. The limited circulating supply (15.35% of total) presents both scarcity value and potential future selling pressure risks. While the Bitcoin staking narrative holds long-term promise, SOLV faces considerable market volatility and competitive challenges in the near term.
SOLV Investment Recommendations
✅ Beginners: Approach with extreme caution - limit exposure to less than 1% of portfolio, thoroughly research Bitcoin staking mechanisms, and only invest disposable capital after understanding the technology and risks
✅ Experienced Investors: Consider small speculative positions (2-5% allocation) with strict stop-loss disciplines, monitor protocol development and adoption metrics, and remain prepared for high volatility
✅ Institutional Investors: Conduct comprehensive due diligence on protocol security audits, evaluate market depth and liquidity conditions, implement hedging strategies, and consider waiting for increased market maturity and regulatory clarity
SOLV Trading Participation Methods
- Spot Trading: Purchase SOLV tokens directly on Gate.com with support for multiple trading pairs and competitive liquidity
- Grid Trading: Utilize automated grid trading strategies to capture price fluctuations within established ranges during consolidation phases
- Gradual Accumulation: Implement systematic investment plans (DCA) to build positions over time, reducing timing risk and averaging entry costs
Cryptocurrency investment carries extremely high risks, and this article does not constitute investment advice. Investors should make prudent decisions based on their own risk tolerance and are advised to consult professional financial advisors. Never invest more than you can afford to lose.
FAQ
What is SOLV token and what are its uses?
SOLV is a utility token powering the Solv Protocol, a decentralized platform for creating and managing structured financial products. It enables governance, staking rewards, and access to premium features within the ecosystem.
What is the current price of SOLV? What are its all-time high and all-time low prices?
SOLV is currently trading around $0.45-$0.50. Its all-time high reached approximately $2.80, while the all-time low stands near $0.08. Prices fluctuate based on market conditions.
What are expert predictions for SOLV price in 2024 and 2025?
Experts predicted SOLV could reach $0.50-$1.20 in 2024, with potential growth to $1.50-$2.50 in 2025 driven by increased adoption and ecosystem expansion. However, actual market performance depends on broader crypto trends.
What are the main factors affecting SOLV price?
SOLV price is primarily influenced by market demand and supply dynamics, ecosystem development progress, overall crypto market sentiment, trading volume, DeFi adoption rates, and investor confidence in the project's technology and partnerships.
What are the advantages and disadvantages of SOLV compared to other similar tokens?
SOLV's advantages include its innovative yield-bearing token design and strong institutional backing. It offers efficient liquidity and lower slippage. Disadvantages include smaller trading volume compared to major competitors and limited ecosystem integration relative to established protocols.
What risks exist in investing in SOLV? How should they be mitigated?
SOLV investment risks include market volatility, liquidity constraints, and regulatory changes. Mitigate by diversifying your portfolio, investing only disposable funds, conducting thorough research, and maintaining long-term perspective through market cycles.
* The information is not intended to be and does not constitute financial advice or any other recommendation of any sort offered or endorsed by Gate.