Aroon is not a direct measure of trend intensity; it highlights which side of the market is gaining control by tracking the timing of recent highs and lows. ADX is a strength filter that shows whether directional movement is becoming powerful enough to support a swing-trading setup. In an Aroon vs. ADX comparison across crypto and other markets, the preferred indicator depends on whether the priority is earlier directional detection or stronger confirmation of trend quality.
TL;DR
-
Aroon evaluates trend direction and development by measuring how recently price recorded a high or low within a selected period.
-
ADX measures trend strength but does not independently identify whether the market is moving upward or downward.
-
Aroon may react earlier when market control changes, although frequent crossovers can create noise in sideways conditions.
-
ADX filters weak or range-bound setups more effectively, but its smoothed calculation may confirm a trend after part of the move has occurred.
-
Swing traders can combine Aroon for directional timing with ADX and its directional lines for strength confirmation.
| Comparison factor |
Aroon |
ADX |
| Primary purpose |
Detect trend direction and emerging changes |
Measure the strength of a trend |
| Main components |
Aroon Up and Aroon Down |
ADX, +DI, and -DI |
| Directional information |
Directly compares bullish and bearish control |
ADX alone is non-directional |
| Signal speed |
Often reacts relatively early |
Usually confirms after strength develops |
| Sideways-market behaviour |
May produce repeated crossovers |
Often remains low and filters weak trends |
| Best swing-trading role |
Early trend detection and directional shifts |
Trend-strength confirmation and trade filtering |
| Main limitation |
Sensitive to repeated highs and lows |
Can lag rapid reversals |
Aroon and ADX examine different parts of a trend. Aroon concentrates on the timing of recent highs and lows, whereas ADX evaluates the strength of directional movement. Neither indicator supplies a complete entry or exit system on its own.
What Is the Aroon Indicator?
The Aroon indicator is a two-line oscillator designed to identify trend direction and changes in market control. The classic Aroon indicator was developed by Tushar Chande in 1995, and it calculates how recently price formed its highest high and lowest low within a selected lookback period. The standard structure includes Aroon Up and Aroon Down, with both lines moving between 0 and 100. In practice, the default aroon indicator settings use a 14-period lookback, though traders may change that input based on the market they are analyzing.
Aroon Up rises when price records a recent high, while Aroon Down rises when price records a recent low. When Aroon Up remains above Aroon Down, bullish control is generally stronger. When Aroon Down dominates, bearish conditions are more likely.
The aroon indicator formula uses the number of periods as the core input:
Aroon Up = [(Period − periods since highest high) ÷ Period] × 100
Aroon Down = [(Period − periods since lowest low) ÷ Period] × 100
The indicator therefore focuses on elapsed time rather than the size of the price change. A complete introduction to the Aroon indicator covers its calculation, line relationships, crossover signals, and interpretation during trending and consolidating markets, and traders often refine aroon indicator settings or best aroon indicator settings by timeframe to balance responsiveness and noise.
For swing trading, Aroon can reveal when price begins producing recent highs more consistently than recent lows. A bullish crossover may suggest that upward control is developing, while a bearish crossover can warn that downside pressure is becoming more active.
What Is the ADX Indicator?
The average directional index (ADX) measures trend strength on a scale from 0 to 100. ADX does not determine whether the market is bullish or bearish. Direction is normally interpreted through the accompanying Positive Directional Indicator, or +DI, and the Minus Directional Indicator, or -DI.
A rising ADX indicates that directional movement is strengthening. A falling ADX suggests that the prevailing trend is losing strength, although it does not automatically signal an immediate reversal. Traders often interpret ADX values below approximately 20 as weak or range-bound conditions, while readings above approximately 25 may indicate a more established trend. ADX commonly uses a 14-period setting and tends to react more slowly because it smooths price data. These levels are reference zones rather than universal rules.
When +DI is above -DI, bullish directional movement is stronger. When -DI is above +DI, bearish directional movement has greater influence. The ADX indicator therefore becomes more informative when all three lines are assessed together.
ADX can help swing traders avoid taking trend-following signals when directional strength is limited. For example, a moving-average breakout may appear convincing, but a low and flat ADX can indicate that the market has not developed sustained momentum.
Aroon vs. ADX: Which Detects a New Trend Earlier?
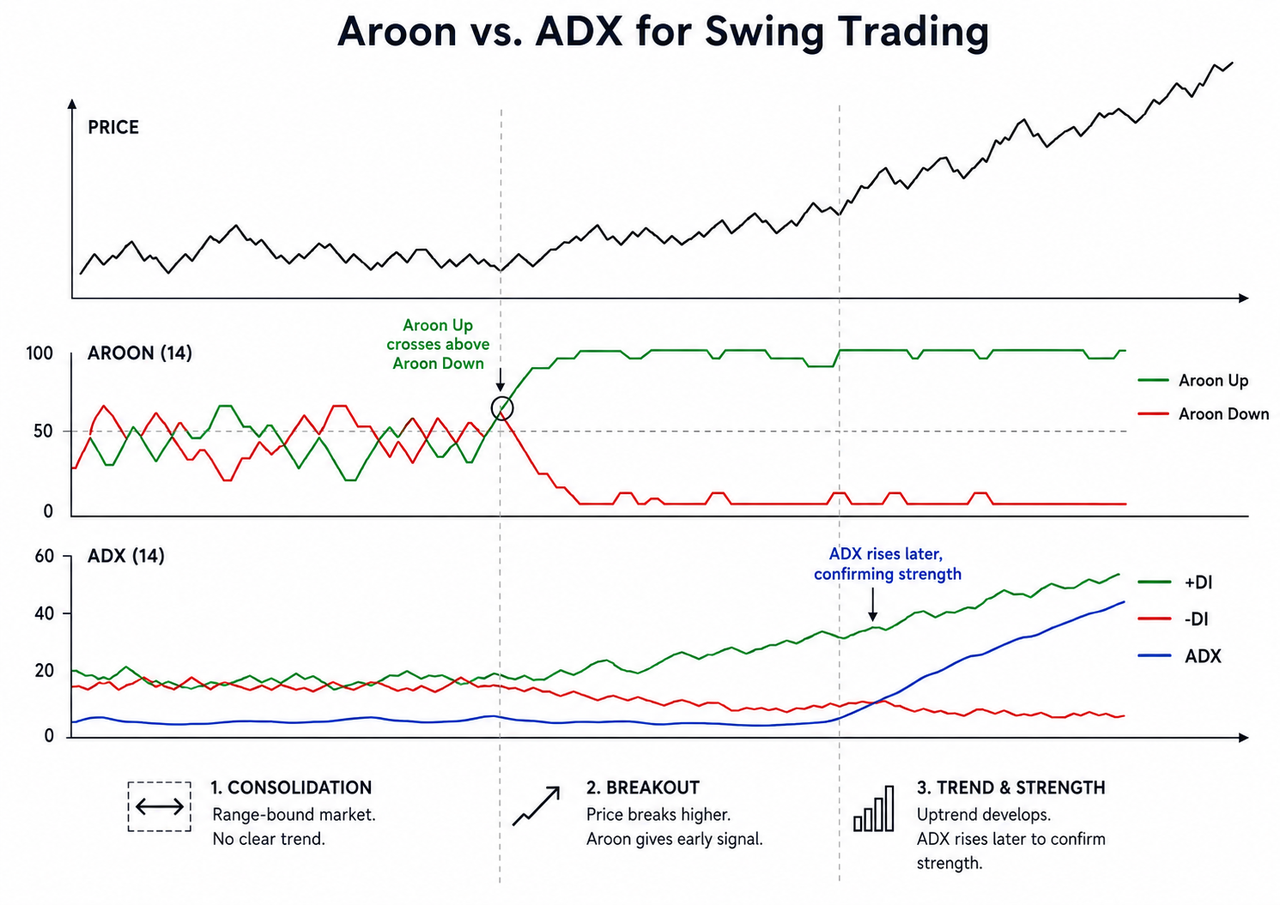
In the aroon indicator vs adx comparison, Aroon usually detects a possible new trend earlier because it responds directly when price records a recent high or low. Aroon Up can quickly move toward 100 after a new high, while Aroon Down declines as the most recent low becomes older.
This structure makes Aroon useful when price is moving out of consolidation. A bullish Aroon crossover, followed by widening separation between the two lines, may indicate that recent highs are appearing more frequently than recent lows, and the aroon indicator shows emerging market sentiment shifts when recent highs begin to outpace recent lows. These line crosses are the main aroon indicator signals traders watch for possible trend reversals and early trade signals.
ADX requires directional movement to be calculated and smoothed before trend strength becomes visible. As a result, ADX may remain low during the first stage of a breakout and begin rising only after price establishes a more persistent move.
Earlier detection does not guarantee a better signal. Aroon may change direction repeatedly when price alternates between short-term highs and lows. ADX reacts later, but the delay may filter some moves that never develop into sustainable trends.
Aroon vs. ADX: Which Measures Trend Strength Better?
ADX provides the clearer measurement of trend strength because strength evaluation is its primary function. A rising ADX shows that directional movement is becoming more pronounced, regardless of whether the trend is bullish or bearish.
Aroon can imply trend strength through line position and separation. High aroon up values, especially when Aroon Up above 70 indicates a strong uptrend, can support a strong trend reading in aroon indicator readings. The aroon up line near 100 signals a robust upward trend, and the aroon up indicator line holding near the top of the scale can confirm a strong bullish trend; the opposite structure supports a downward trend and can still reflect a robust trend. However, Aroon strength depends on how recently highs and lows occurred rather than the magnitude or persistence of directional movement.
ADX is therefore more suitable when a trader needs to determine whether a signal deserves attention. A bullish crossover from the MACD indicator, for example, may carry more weight when +DI is above -DI and ADX is rising. A low ADX can warn that the momentum signal is forming inside an unstable range.
How Do Aroon and ADX Behave in Sideways Markets?
ADX generally identifies sideways conditions more clearly because its value tends to remain low when neither bullish nor bearish movement develops sustained strength. This characteristic allows ADX to function as a market-regime filter.
Aroon can become less stable during consolidation. Small movements may create a new high or low within the lookback window, causing the aroon lines to cross repeatedly. These crossovers can resemble early trend signals even when price remains confined to a trading range, a pattern common in ranging markets or a sideways trend.
When both the aroon readings stay low or converge, the market may be in a weak trend or a weak or sideways trend rather than a breakout phase. Price structure should therefore confirm either indicator. Repeated Aroon crossovers around established support and resistance levels may reflect indecision rather than a tradable reversal, and those areas help confirm whether the signal points to consolidation or a real breakout. A low ADX strengthens the interpretation that the market lacks a durable trend.
The same problem affects other trend-following tools. A SuperTrend indicator can switch sides during choppy price action, while moving averages may flatten and produce repeated crossings. ADX can help identify when these directional signals are developing without sufficient trend strength.
Aroon vs. ADX: Which Indicator Provides Better Swing-Trading Entries?
Aroon offers more direct entry timing because its crossovers can generate swing-trading signals through the two aroon lines, and each indicator line helps show changing directional control. The aroon up indicator and aroon down indicators act as the directional components, so traders often use the Aroon indicator to analyse price movements and identify market trends before confirming with ADX. A possible bullish setup may develop when an aroon indicator line crosses in favor of buyers, moves toward the upper part of its range, and aligns with a price breakout or higher low.
ADX is better treated as confirmation rather than a standalone entry trigger. A trader might first identify direction through price structure, Aroon, moving averages, or another trend tool. ADX can then show whether the move is becoming strong enough to justify a trend-following approach.
An EMA 20 may provide a practical pullback area once Aroon establishes bullish control and ADX begins rising. Price holding above a rising EMA can support continuation, while a declining ADX may warn that momentum behind the trend is fading. This is one example of a broader trading strategy, and traders may adapt similar aroon indicator strategies for day trading on shorter charts.
The sequence matters:
-
Price breaks a meaningful structural level.
-
Aroon identifies which direction is gaining control.
-
+DI and -DI confirm directional dominance.
-
Rising ADX confirms that the trend is strengthening.
-
Price behaviour provides the final entry and invalidation levels.
This approach reduces dependence on any single indicator without assuming that multiple signals eliminate market risk.
Aroon vs. ADX: Which Indicator Is Better for Managing Exits?
Neither Aroon nor ADX provides a precise trailing exit, but both can warn when trend conditions are deteriorating. Aroon may react earlier when the dominant line falls and the opposing line rises. ADX may confirm weakening momentum when it turns downward after reaching an elevated level.
A falling ADX does not necessarily mean that price will reverse. It means that trend strength is decreasing. Price may consolidate, continue at a slower rate, or eventually change direction. Exit decisions still require price structure, stop placement, and the trader’s risk plan.
Indicators designed around trailing price movement may provide clearer exit references. The Parabolic SAR indicator places dots above or below price and can signal when directional momentum changes. A Moving Average Ribbon can also show whether several trend horizons remain aligned or begin compressing.
Can Aroon and ADX Be Used Together?
Aroon and ADX can form a complementary swing-trading framework because Aroon supplies directional timing while ADX evaluates trend quality. Their different calculations reduce direct duplication, although both remain derived from historical price data and work best within broader technical analysis and trend analysis rather than as isolated signals. In practice, traders often confirm them with other indicators and other technical analysis tools as part of a wider set of technical analysis tools.
A bullish combination may include:
-
Aroon Up crossing above the aroon down lines
-
Aroon Up remaining in the upper part of its range
-
+DI moving above -DI
-
ADX rising from a low level
-
Price breaking resistance or forming a higher low
Support from price structure can improve confirmation, especially when highs, lows, and resistance levels align with the indicator shift.
A bearish combination reverses these conditions. Aroon Down takes control, -DI moves above +DI, ADX rises, and price confirms weakness through a breakdown or lower high. This combination can also support a breakout trading strategy and help filter overbought or oversold conditions when paired with RSI or similar tools.
Conflicting signals call for patience. Aroon may indicate an emerging direction while ADX remains low, meaning the move has not yet developed measurable strength. ADX may also stay elevated after Aroon begins warning that market control is shifting because smoothing delays the response.
Aroon vs. ADX: Which Should Swing Traders Choose?
Choose Aroon when the main objective is to identify emerging trends, monitor changes between bullish and bearish control, or detect movement out of consolidation; one of the key differences is that Aroon focuses more directly on directional shifts and early trend development. Aroon is more responsive, but that sensitivity requires stronger confirmation from price structure.
Choose ADX when the main objective is to filter weak setups, confirm whether a breakout has sustained directional strength, or decide whether trend-following strategies suit current market conditions. ADX supplies stronger confirmation but may enter the analysis after the earliest part of the move.
Use both when direction and trend strength need to be evaluated separately. Aroon can answer which side appears to be taking control, while ADX can indicate whether that control is developing into a meaningful trend. For swing traders, this reflects the main Aroon indicator vs ADX choice depending on whether direction or strength matters more.
Risks and Limitations of Aroon and ADX
Aroon and ADX are lagging mathematical interpretations of historical market data, not predictive guarantees. Sudden news, liquidity changes, price gaps, and sharp volatility can invalidate technical setups before either indicator adjusts.
Important limitations include:
-
Aroon crossovers can become frequent and unreliable in narrow ranges.
-
ADX can confirm a trend after a substantial price move has already occurred.
-
Standard threshold values may behave differently across assets and timeframes.
-
Indicator settings that work on a daily chart may create excessive noise on shorter charts, and the default lookback may need adjustment in forex trading or other intraday contexts to reduce noise.
-
Multiple indicators can produce false confidence when they depend on similar price information.
Swing traders should define position size, invalidation levels, and maximum acceptable loss before entering a trade. Technical indicators and other technical analysis tools support structured analysis, but they cannot remove market, liquidity, or execution risk.
Conclusion
Aroon is better suited to early trend detection and directional changes, whereas ADX provides stronger confirmation of whether a trend has developed meaningful strength. For swing trading, Aroon can identify which side is gaining control, while ADX can filter weak signals and confirm trend quality. Combining both with price structure and disciplined risk management usually provides a more complete framework than relying on either indicator alone.
Technical indicators do not guarantee profitable trades or accurately predict every reversal. Cryptocurrency and financial markets can be highly volatile, and this material is provided for educational purposes rather than financial advice.
FAQ
Is Aroon better than ADX for swing trading?
Aroon is more suitable when a swing trader prioritizes early trend detection, while ADX is more suitable when trend-strength confirmation matters most. This is one of several aroon indicator vs comparisons traders make when choosing tools that fit a specific trading style. The choice depends on whether signal speed or filtering reliability is the primary objective.
What is the main difference between Aroon and ADX?
Aroon measures how recently price formed its highest high and lowest low, while ADX measures the strength of directional price movement. Aroon uses the time since recent highs and lows, whereas ADX uses directional movement and smoothing; ADX sits within the average directional index system with +DI and -DI, while the aroon indicator system uses two lines.
Can Aroon and ADX confirm the same trend?
Yes. A bullish trend may receive confirmation when Aroon Up dominates Aroon Down, +DI remains above -DI, and ADX rises, so both indicators can confirm the same trend when their directional and strength signals align. This works best in trending markets and is less reliable in ranging markets. Bearish confirmation occurs when Aroon Down and -DI dominate while ADX strengthens.
What ADX level is suitable for swing trading?
Many traders use the 20 to 25 region as a reference for distinguishing weak conditions from a developing trend. These values are not fixed entry rules, and the appropriate interpretation depends on the asset, timeframe, volatility, and price structure.
Do Aroon and ADX work in cryptocurrency markets?
Both indicators can be applied to cryptocurrency charts because their calculations use price data rather than asset-specific fundamentals. For quicker single-line checks, some traders also compare the standard version with the aroon oscillator, though the two-line setup gives clearer directional detail in fast markets. Cryptocurrency volatility can still create rapid false signals, so neither indicator should be used without risk controls and price confirmation.







