Moving averages are widely used technical indicators in crypto markets because raw price movements can be noisy. A coin may rise sharply, fall back within minutes, and then continue in either direction. Without smoothing tools, it can be difficult to separate meaningful direction from short-term fluctuation.
EMA and SMA both help organize price data, but they do not behave the same way. EMA responds more quickly because it emphasizes recent prices. SMA moves more slowly because every price in the chosen period has equal influence. For traders, the key is not to ask which one is better. The more useful question is when each moving average provides clearer information.
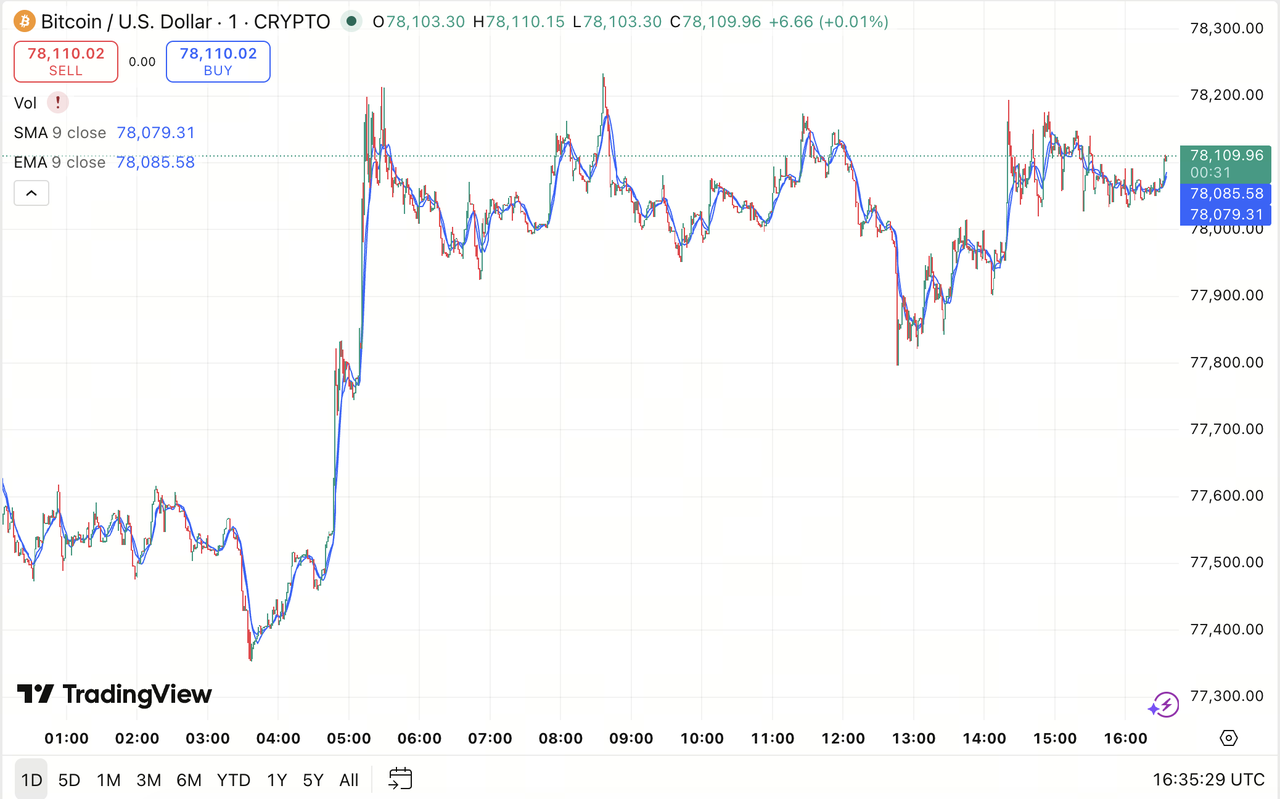
Source: TradingView
What Is EMA?
EMA, or Exponential Moving Average, is a moving average that gives greater importance to recent price data.
This means the EMA line reacts more quickly when the market changes direction. If cryptocurrency suddenly breaks upward or drops sharply, the EMA usually turns faster than the SMA during the same period.
Traders often use EMA when they want to track short-term momentum. It can help identify early shifts in direction, especially in fast-moving markets such as Bitcoin, Ethereum, or smaller altcoins with higher volatility.
For example, a 20-period EMA on a crypto chart reflects recent price movement more strongly than older prices within the same period. This makes it useful for traders who need a responsive signal rather than a slow trend filter.
However, faster response also means higher sensitivity. EMA may react to temporary price spikes or sudden pullbacks that do not develop into a real trend. This is why traders usually combine EMA with other tools, such as support and resistance, volume, or broader market structure.
What Is SMA?
SMA, or Simple Moving Average, is a moving average that calculates the average price over a selected number of periods, giving equal weight to every price in that range.
A 20-period SMA, for example, adds the closing prices of the last 20 periods and divides the total by 20. Each price contributes equally to the final value.
Because SMA treats all prices the same, it reacts more slowly than EMA. This slower movement can be helpful when traders want to see the broader trend without being distracted by every short-term price swing.
In crypto trading, SMA is often used to identify major trend direction, long-term support or resistance areas, and overall market bias. A 50-day SMA or 200-day SMA, for instance, is commonly watched by traders who want to understand whether the market is generally rising, falling, or moving sideways.
The main strength of SMA is smoothness. The main limitation is delay. By the time SMA changes direction, price may have already moved significantly.
What Is the Core Difference Between EMA and SMA?
The core difference between EMA and SMA is weighting.
EMA gives more weight to recent prices, so it reacts faster. SMA gives equal weight to all prices in the selected period, so it reacts more slowly but appears smoother.
This difference changes how traders interpret signals. EMA is more useful when speed matters. SMA is more useful when stability matters.
| Comparison Point |
EMA |
SMA |
| Full Name |
Exponential Moving Average |
Simple Moving Average |
| Price Weighting |
Gives more weight to recent prices |
Gives equal weight to all prices |
| Responsiveness |
Faster |
Slower |
| Smoothness |
More sensitive, less smooth |
Smoother, less sensitive |
| Common Use |
Short-term momentum and faster signals |
Broader trend direction and long-term analysis |
| Main Risk |
More false signals in choppy markets |
Delayed signals during fast moves |
In simple terms, EMA is like a trader who pays close attention to what just happened. SMA is like a trader who wants to see the full average picture before changing their view.
Neither approach is always correct. Their usefulness depends on market conditions, time frame, and trading style.
How Do Their Calculation Methods Differ?
EMA and SMA both use past price data, but they process that data differently.
SMA uses a simple average. If the selected period is 10 candles, the SMA adds the closing prices of those 10 candles and divides by 10. Every candle has the same importance.
EMA uses a weighted method. Recent candles receive more influence, while older candles still matter but have less impact. The formula is more complex than SMA, but beginner traders do not need to memorize the calculation to use the indicator effectively.
The practical result is easy to understand:
-
When price moves sharply upward, EMA usually rises faster.
-
When price drops quickly, EMA usually turns downward faster.
-
When price moves sideways, EMA may shift back and forth more often.
-
SMA changes direction more slowly and filters out more short-term noise.
This is why two moving averages with the same period can look different on a chart. A 20 EMA and a 20 SMA both use 20 periods, but the EMA places greater importance on the most recent candles.
For traders, the calculation difference matters because it affects signal timing. EMA may give earlier entries and exits. SMA may reduce unnecessary reactions but confirm trends later.
When Should Traders Use EMA vs SMA?
Traders may use EMA when they need faster signals and want to follow short-term momentum.
EMA is often useful in active trading environments, such as intraday crypto trading or trend-following setups. When price is moving strongly, EMA can help traders stay closer to the current market direction.
Common EMA use cases include:
-
Identifying short-term trend direction
-
Tracking momentum during breakouts
-
Watching dynamic support or resistance
-
Spotting early changes in price behavior
For example, if price stays above a rising 20 EMA, some traders may read that as a sign of short-term strength. If price repeatedly fails to hold above the EMA, momentum may be weakening.
SMA may be more useful when traders want a calmer view of the market.
It is commonly used for longer-term analysis, especially on daily or weekly charts. A 50-day SMA or 200-day SMA can help traders understand whether the broader market is in an uptrend, downtrend, or neutral phase.
Common SMA use cases include:
-
Identifying long-term trend direction
-
Filtering out short-term noise
-
Comparing current price with historical average levels
-
Observing major support or resistance zones
A trader does not need to choose only one. Many traders use both together. EMA may guide short-term timing, while SMA provides broader context.
For example, a trader might use the 20 EMA to monitor current momentum and the 200 SMA to understand the larger trend. If short-term momentum aligns with the long-term trend, the signal may appear stronger. If they conflict, the trader may need more caution.
How Do Their Responses to Crypto Volatility Compare?
Crypto volatility makes the EMA vs SMA difference especially important.
Crypto markets often move faster than traditional markets. Prices can react sharply to news, liquidations, exchange flows, macro events, or sudden changes in trader sentiment. In this environment, a slow indicator may confirm the move late, while a fast indicator may react too often.
EMA responds quickly to volatility. This can help traders notice early momentum shifts, but it can also create false signals when price whipsaws. During a choppy market, price may cross above and below an EMA many times, making the trend look unclear.
SMA responds more slowly to volatility. It may ignore some short-term moves and provide a steadier trend line. This can help traders avoid reacting to every sudden candle. However, SMA may lag during strong breakouts or fast sell-offs.
In a trending crypto market, EMA can be useful because it follows price more closely. In a sideways market, SMA may offer better noise reduction because it does not change direction as quickly.
The key is to match the moving average to the market condition.
When volatility supports a clear trend, EMA may help traders stay responsive. When volatility creates messy back-and-forth movement, SMA may provide a cleaner view.
Conclusion
EMA vs SMA is a comparison between speed and smoothness.
EMA gives more weight to recent prices, so it reacts faster to changes in the market. This makes it useful for traders who focus on short-term momentum, breakout behavior, and fast-moving crypto conditions.
SMA treats every price in the selected period equally. It reacts more slowly, but it provides a smoother view of the trend. This makes it useful for traders who want broader context and fewer reactions to short-term noise.
The most practical way to understand EMA and SMA is to see them as different lenses. EMA shows what the market is doing now with greater sensitivity. SMA shows the broader average direction with more stability.
For beginner traders, the goal is not to find a perfect indicator. Moving averages are tools for interpretation, not prediction. Their value improves when they are used with price structure, volume, risk management, and awareness of market conditions.
FAQs
What is the main difference between EMA and SMA?
The main difference is how they treat price data. EMA gives more weight to recent prices, while SMA gives equal weight to all prices in the selected period. Because of this, EMA reacts faster and SMA moves more smoothly.
Is EMA better than SMA for crypto trading?
EMA is not always better than SMA. EMA may be more useful in fast-moving crypto markets because it reacts quickly, but SMA can be better for filtering noise and identifying broader trends. The better choice depends on the trader’s time frame and strategy.
Why does EMA move faster than SMA?
EMA moves faster because recent price data has more influence on the calculation. When the latest candles rise or fall sharply, the EMA adjusts more quickly than the SMA.
Can traders use EMA and SMA together?
Yes. Some traders use EMA for short-term timing and SMA for long-term context. For example, a trader may watch a 20 EMA for momentum and a 200 SMA for the broader trend.
Do EMA and SMA predict price movement?
EMA and SMA do not predict price with certainty. They are lagging indicators based on past prices. They help traders interpret trend direction and momentum, but they should be combined with other forms of analysis.