Abstract
- After the joint U.S.–Israel airstrikes on Iran, gold and crude oil gapped higher on Monday, global equities opened lower, and Bitcoin volatility intensified, triggering approximately $80 billion in market cap fluctuations within hours.
- Gold is supported by real interest rates and central bank purchases, while crude oil is influenced by OPEC+ production capacity and geopolitical risks. During conflicts, both assets exhibit traditional safe-haven and inflation-hedging characteristics.
- Prediction markets suggest a low probability of full-scale war, but the risk of disruptions in the Strait of Hormuz is not insignificant. In the short term, asset volatility is driven by risk premiums; in the medium to long term, it will depend on the duration of the conflict and the path of monetary policy.
- If the situation ultimately moves toward compromise or phased de-escalation, commodity prices may see a significant pullback; otherwise, gold and oil prices face the risk of further surges.
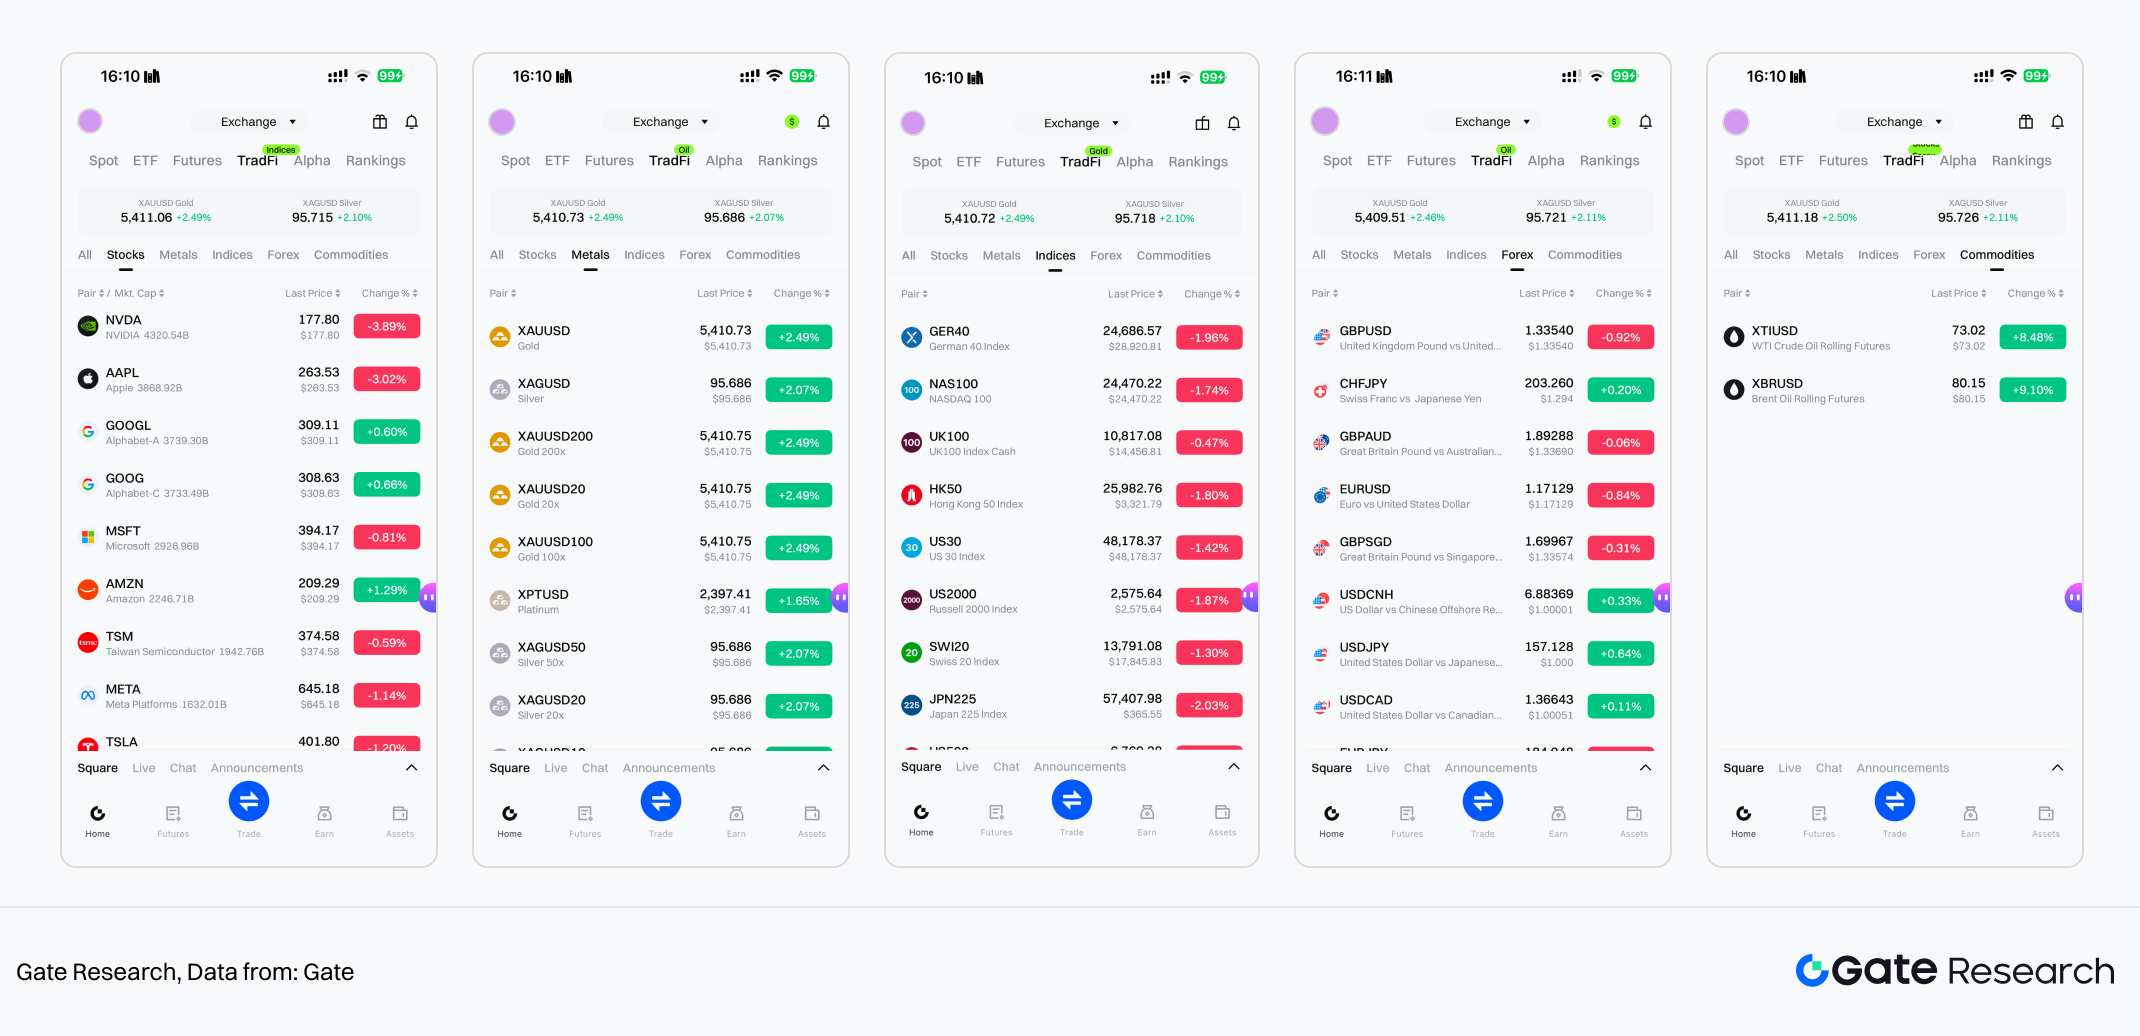
- Gate has now launched trading sections for precious metals such as XAUT/USDT, tokenized stocks, indices, forex, and commodities. Investors can use Gate’s TradFi features to trade 24/7 and quickly capture market opportunities.
1. Short-Term and Long-Term Trends of Bitcoin, Crude Oil, and Gold
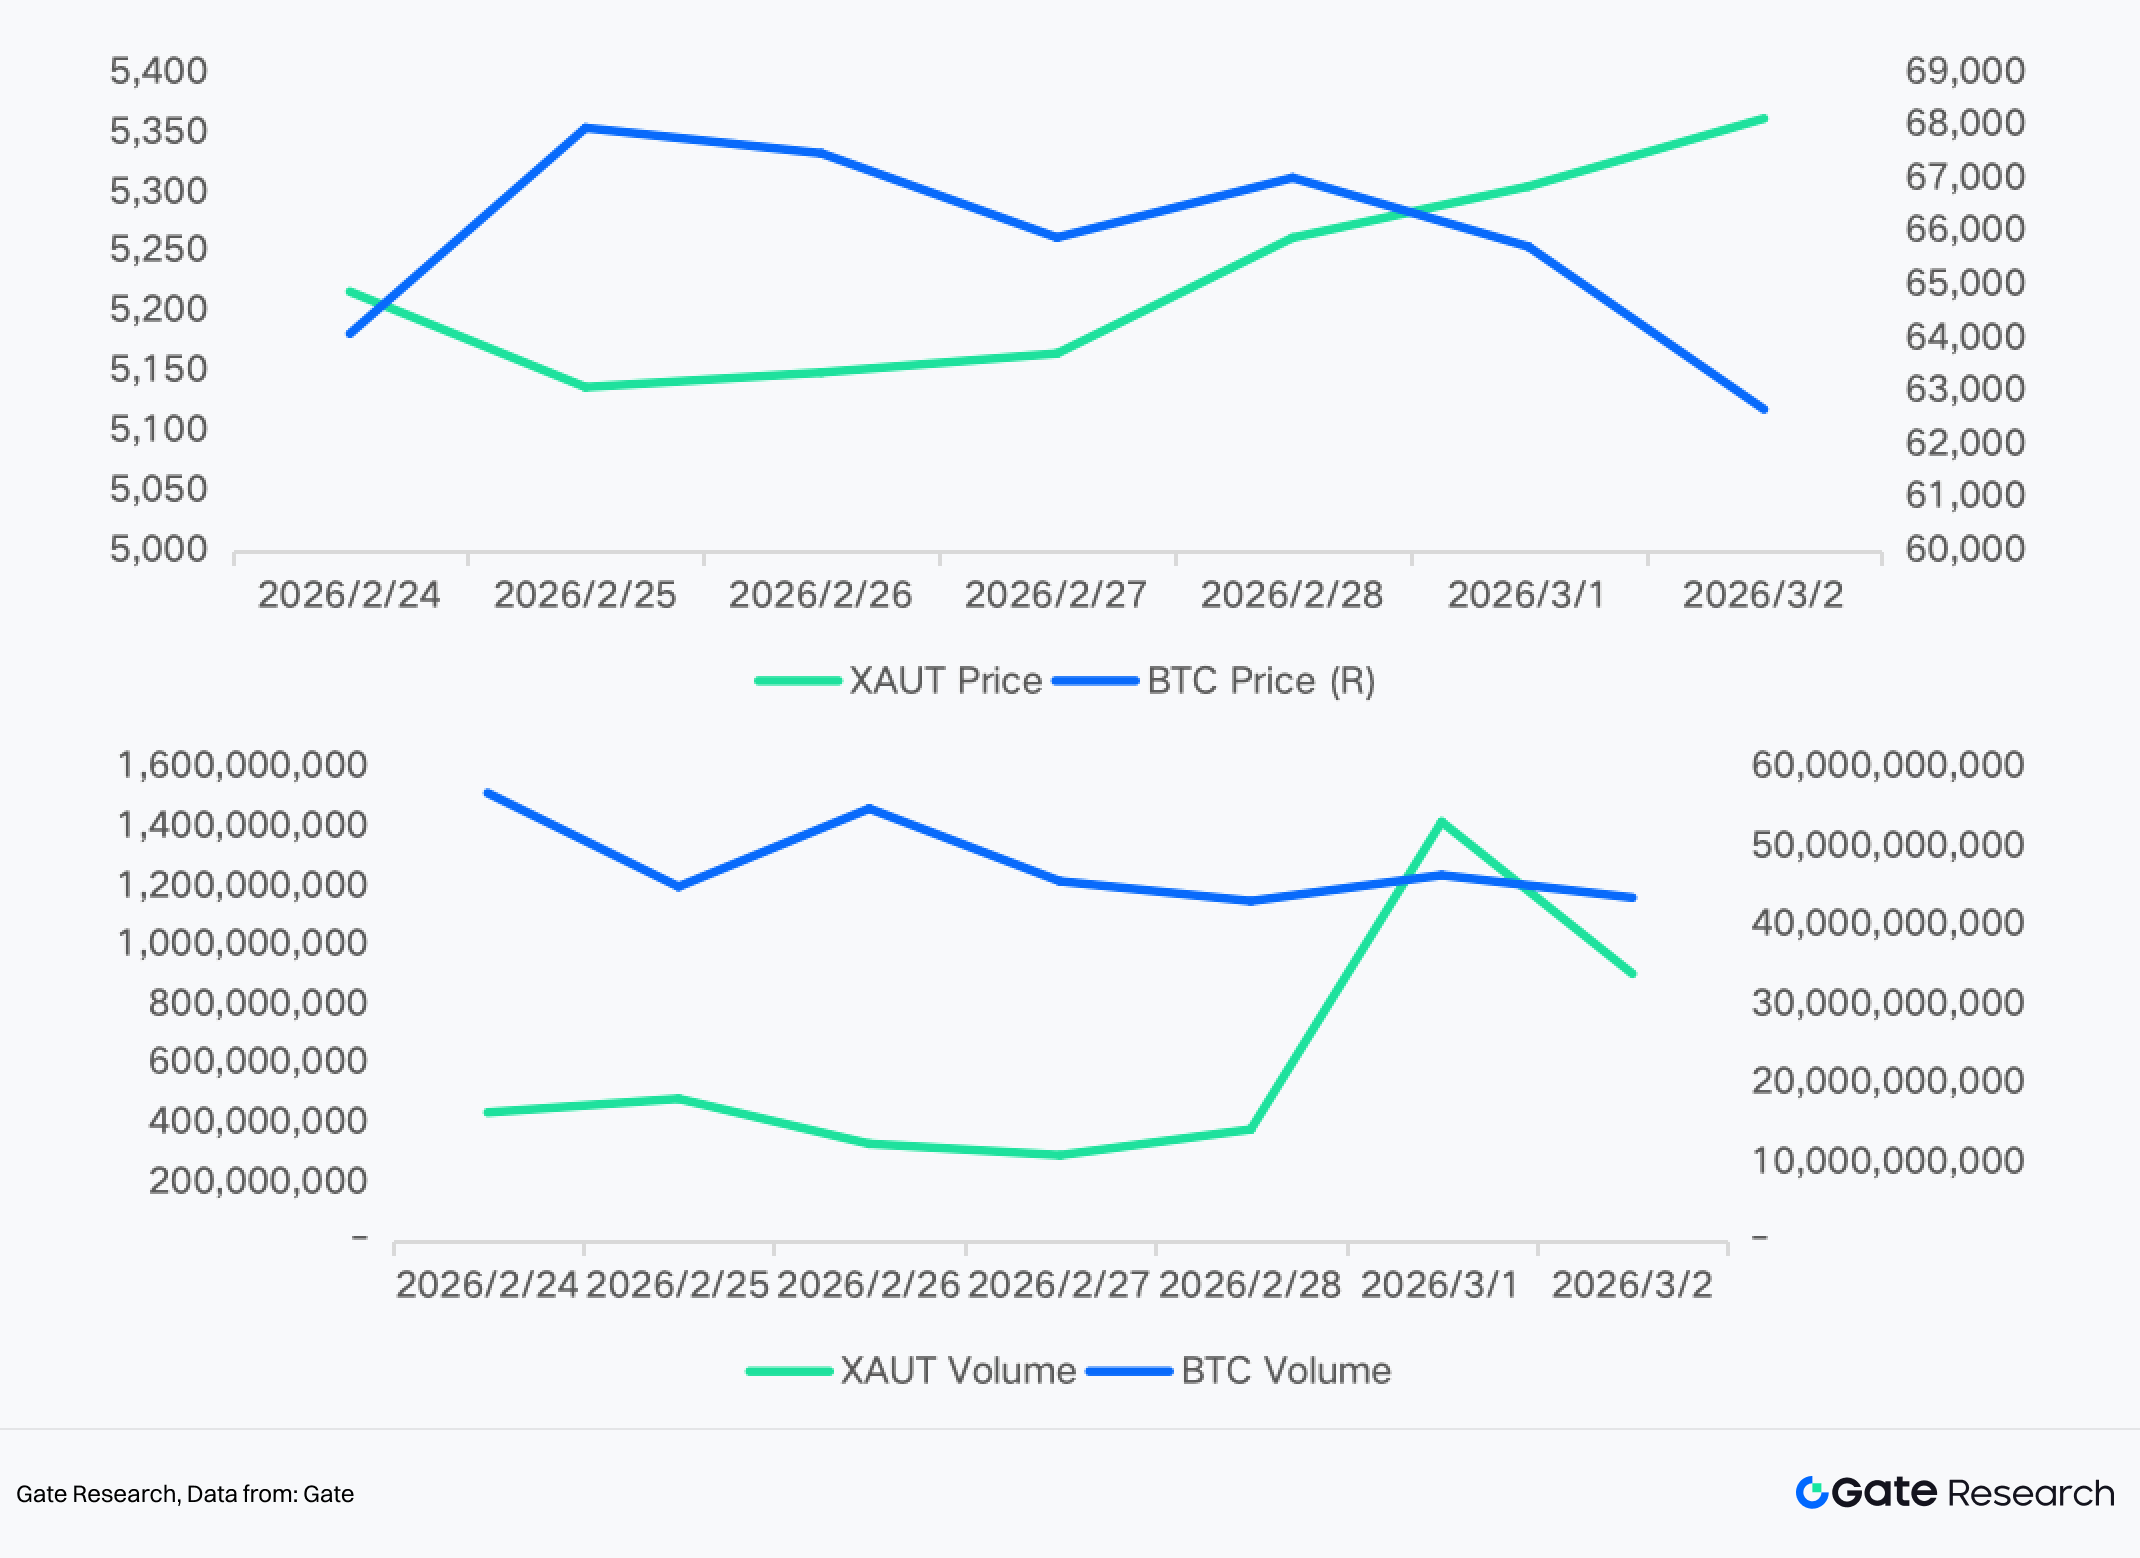
1.1 Monday Opening, March 2, 2026
On Saturday, the United States and Israel launched joint airstrikes against Iran, causing Bitcoin to plunge to $63,000. Within hours, Iranian state media confirmed that Iran’s Supreme Leader Ayatollah Khamenei had been killed in the strikes. Bitcoin then staged a strong rebound, surging from the $63,000 low to around $68,000.
This move triggered approximately $80 billion in market cap fluctuations within just a few hours, occurring during the least liquid weekend trading window. Around 157,000 traders were liquidated, with total losses reaching $657 million.
During the sell-off, traders flocked to decentralized platforms, shifting to 24/7 oil and gold perpetual futures trading to seek hedges while traditional markets were closed. This capital rotation weakened crypto bid depth and intensified Bitcoin’s downside pressure at a critical moment when support was most needed.
The interaction between spot crypto selling and commodity perpetual contract buying during a weekend geopolitical shock represents a relatively new market dynamic.
1.2 Long-Term Trends and Correlation Analysis
Over the long term, Bitcoin has often been regarded as a safe-haven asset and is frequently referred to as “digital gold.” For example, when the Russia–Ukraine conflict broke out in late February 2022, the market speculated that Russian capital might shift into crypto assets. Bitcoin surged about 20% in the short term, briefly breaking above $45,000.
In June 2025, as geopolitical tensions between Israel and Iran escalated, Bitcoin also experienced a noticeable short-term rally. Shortly thereafter, in October, discussions surrounding “currency debasement concerns” and sovereign debt issues—commonly referred to as the “debasement trade”—emerged. Bitcoin rose in tandem with gold prices, reaching new highs amid synchronized asset movements driven by macroeconomic uncertainty.
However, since late 2025, Bitcoin’s safe-haven characteristics have weakened. Multiple analyses suggest that Bitcoin’s performance during risk events has clearly diverged from that of gold. The sharp decline in October 2025 reflected that, under major macro shocks, Bitcoin behaved more like a risk asset rather than a safe-haven asset, moving distinctly differently from gold and U.S. Treasuries.
In inflationary or macro-stress scenarios, gold has continued to rise, while Bitcoin’s price has often pulled back or declined in tandem with risk assets, indicating that the “digital gold” narrative has not been fully validated under real market conditions. Recent macro shock cases show that trade policy risks and rising global uncertainty led to Bitcoin falling while gold climbed, further undermining Bitcoin’s safe-haven reputation.
Looking at weekly return correlations since 2020, Bitcoin exhibits clear “risk-asset” characteristics. Its correlation with the NASDAQ stands at 0.43—the highest in the matrix—highlighting strong linkage with technology stocks. This was particularly evident during the global monetary easing following the 2020 pandemic, the liquidity-driven bull market in 2021, and the AI- and tech-led rallies from 2023 to 2025, when rising risk appetite pushed both higher simultaneously.
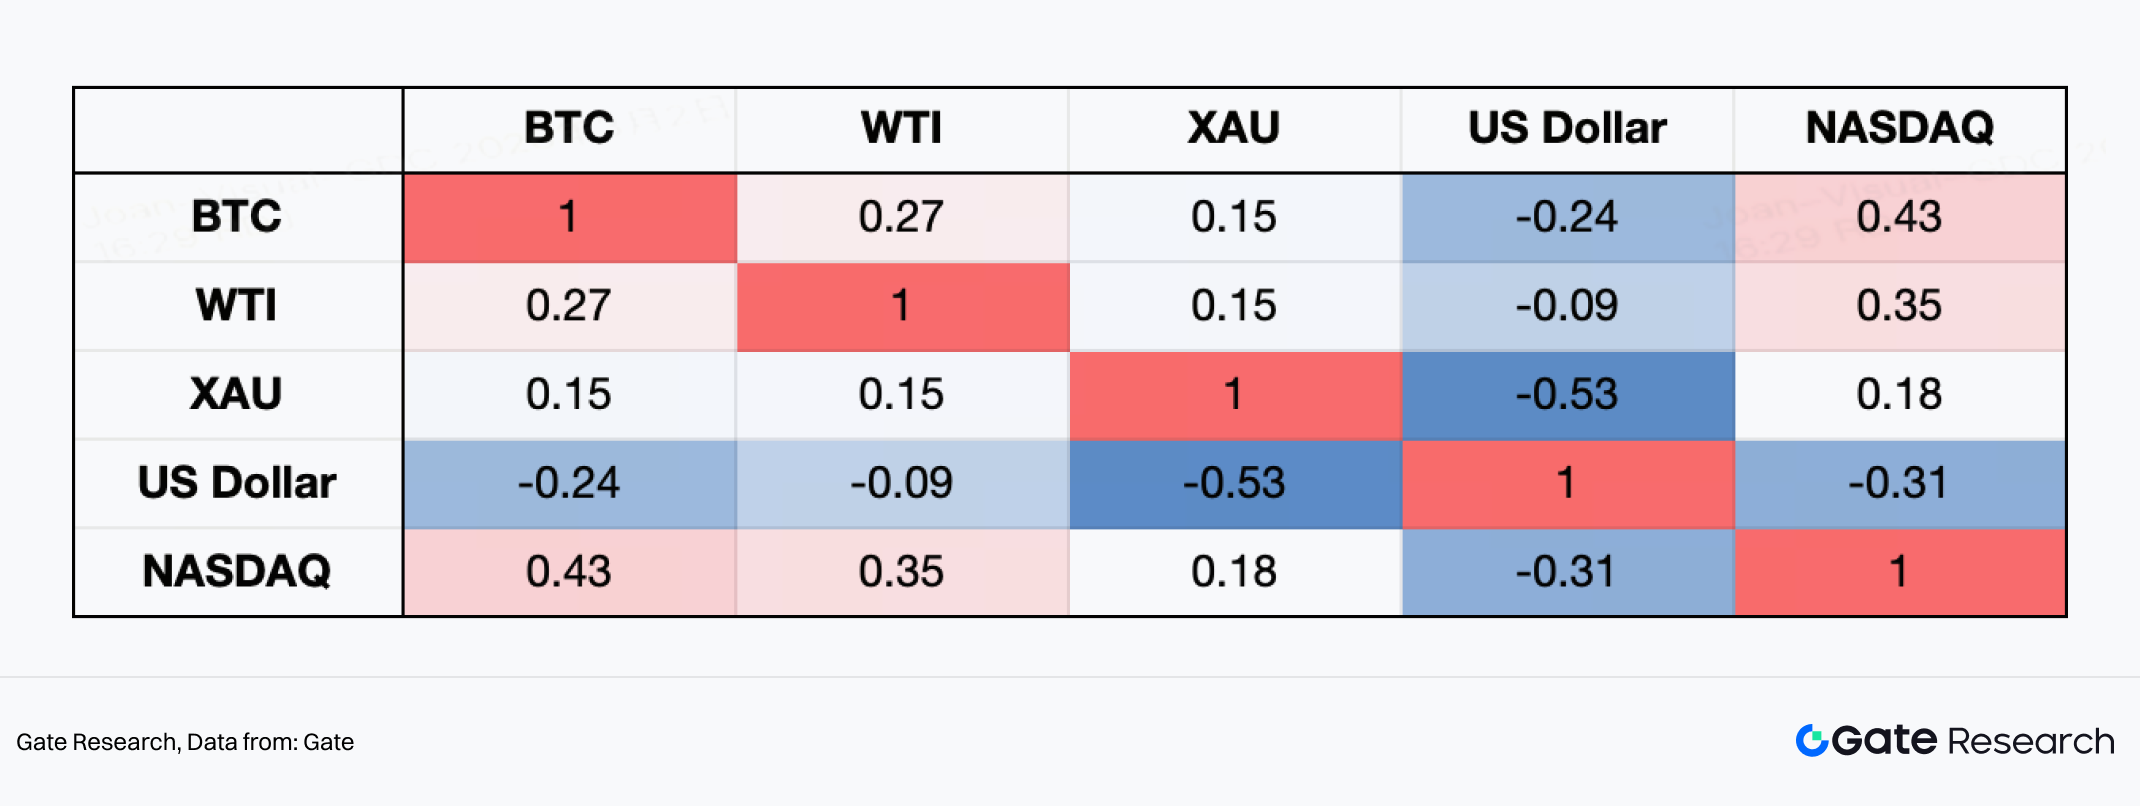
In contrast, Bitcoin shows a -0.24 negative correlation with the U.S. Dollar Index. During the Federal Reserve’s aggressive rate hikes in 2022, when the dollar strengthened significantly, Bitcoin faced notable pressure—underscoring its high sensitivity to global liquidity conditions. Gold (XAU) exhibits the strongest negative correlation with the dollar (-0.53), reflecting traditional safe-haven dynamics. Meanwhile, Bitcoin’s correlation with gold is only 0.15, indicating that its “digital gold” attribute is unstable.
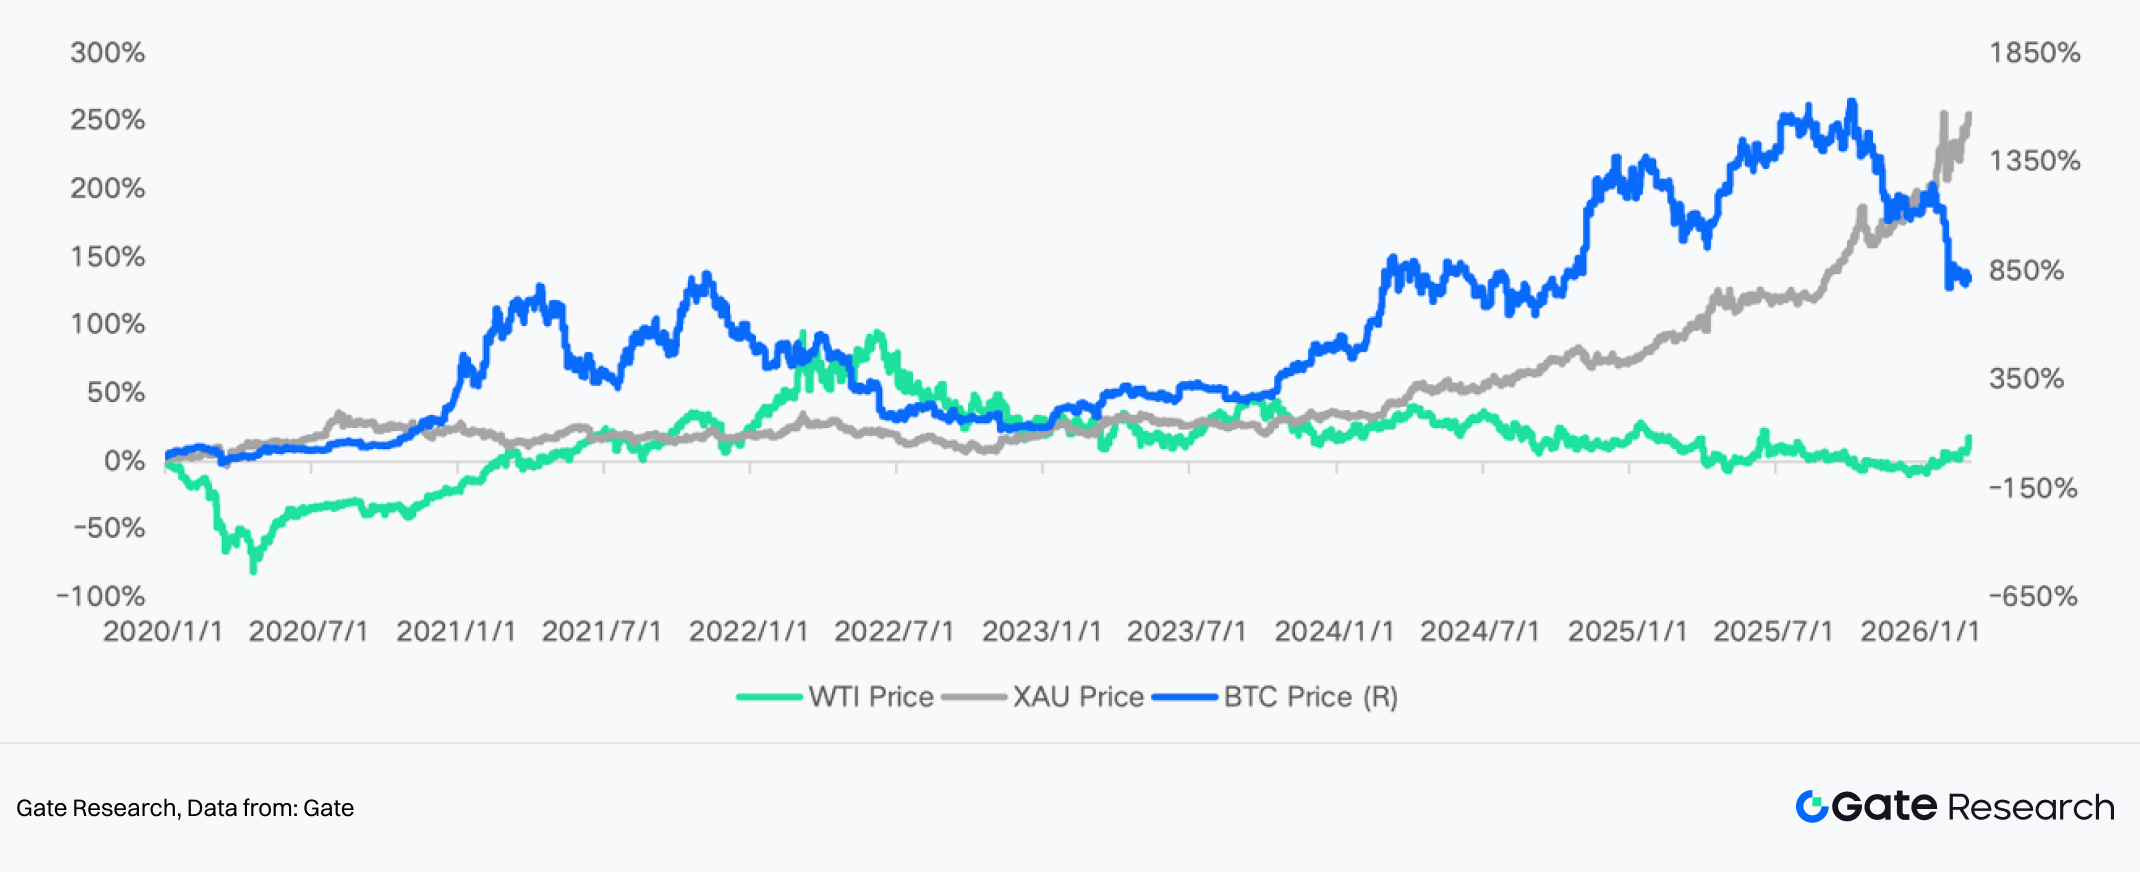
Overall, since 2020, Bitcoin has behaved more like a high-beta macro risk asset. Its core price drivers remain liquidity cycles and risk sentiment, rather than pure geopolitical safe-haven demand.
In contrast, the movements of gold and crude oil are more directly driven by real interest rates, U.S. dollar strength, and geopolitical risk premiums. During the 2020 pandemic shock, large-scale global monetary easing and a rapid decline in real interest rates pushed gold prices to record highs that year. Subsequently, between 2021 and 2022, aggressive rate hikes by the Federal Reserve and a stronger U.S. dollar kept gold fluctuating at elevated levels.
Thereafter, escalating global geopolitical tensions, combined with continued gold reserve accumulation by central banks worldwide, reinforced gold’s safe-haven and reserve asset status. This supported gold prices at high levels and led to repeated cyclical highs.
From the supply side, global gold mine production has maintained modest growth overall, with limited new large-scale mining projects. Rising energy and labor costs have increased production expenses, while stricter environmental regulations have further constrained capacity expansion. Overall, since 2020, the gold market has exhibited characteristics of “rigid supply and financialized demand.”
The crude oil market, meanwhile, experienced a historic shock in 2020. Amid the pandemic, WTI briefly traded at negative prices. It later rebounded rapidly, supported by global economic recovery and large-scale production cuts by OPEC+. In 2022, concerns over energy supply pushed oil prices above $100 per barrel at one point. Prices later retreated from highs as global growth slowed and demand expectations weakened.
On the supply side, OPEC+ has long managed prices through proactive production cuts, with spare capacity in the Middle East serving as a key buffer. U.S. shale oil production gradually recovered between 2021 and 2023, but stronger capital discipline significantly slowed expansion compared to the 2010s. In 2024–2025, oil prices were caught in repeated tug-of-war dynamics among geopolitical conflicts, shipping risks, and slowing global demand, resulting in heightened volatility.
Overall, since 2020, the core characteristic of the oil market has been cyclical shifts among “demand shocks, supply maneuvering, and geopolitical premiums.” Although the price center has risen significantly from pandemic lows, it remains highly sensitive to macroeconomic cycles and policy changes.
2. Outlook
2.1 Impact Analysis Across Asset Classes
At the opening of global financial markets on Monday, market panic surrounding the Iran issue was largely released through the gap-up in gold and crude oil, as well as the lower opening of global equity markets. From the main transmission channels, the impact of the Iran crisis on the global economy and macro markets is primarily concentrated in the energy sector, with the severity of the crisis and its expected duration serving as the key determinants of the depth of its effects.
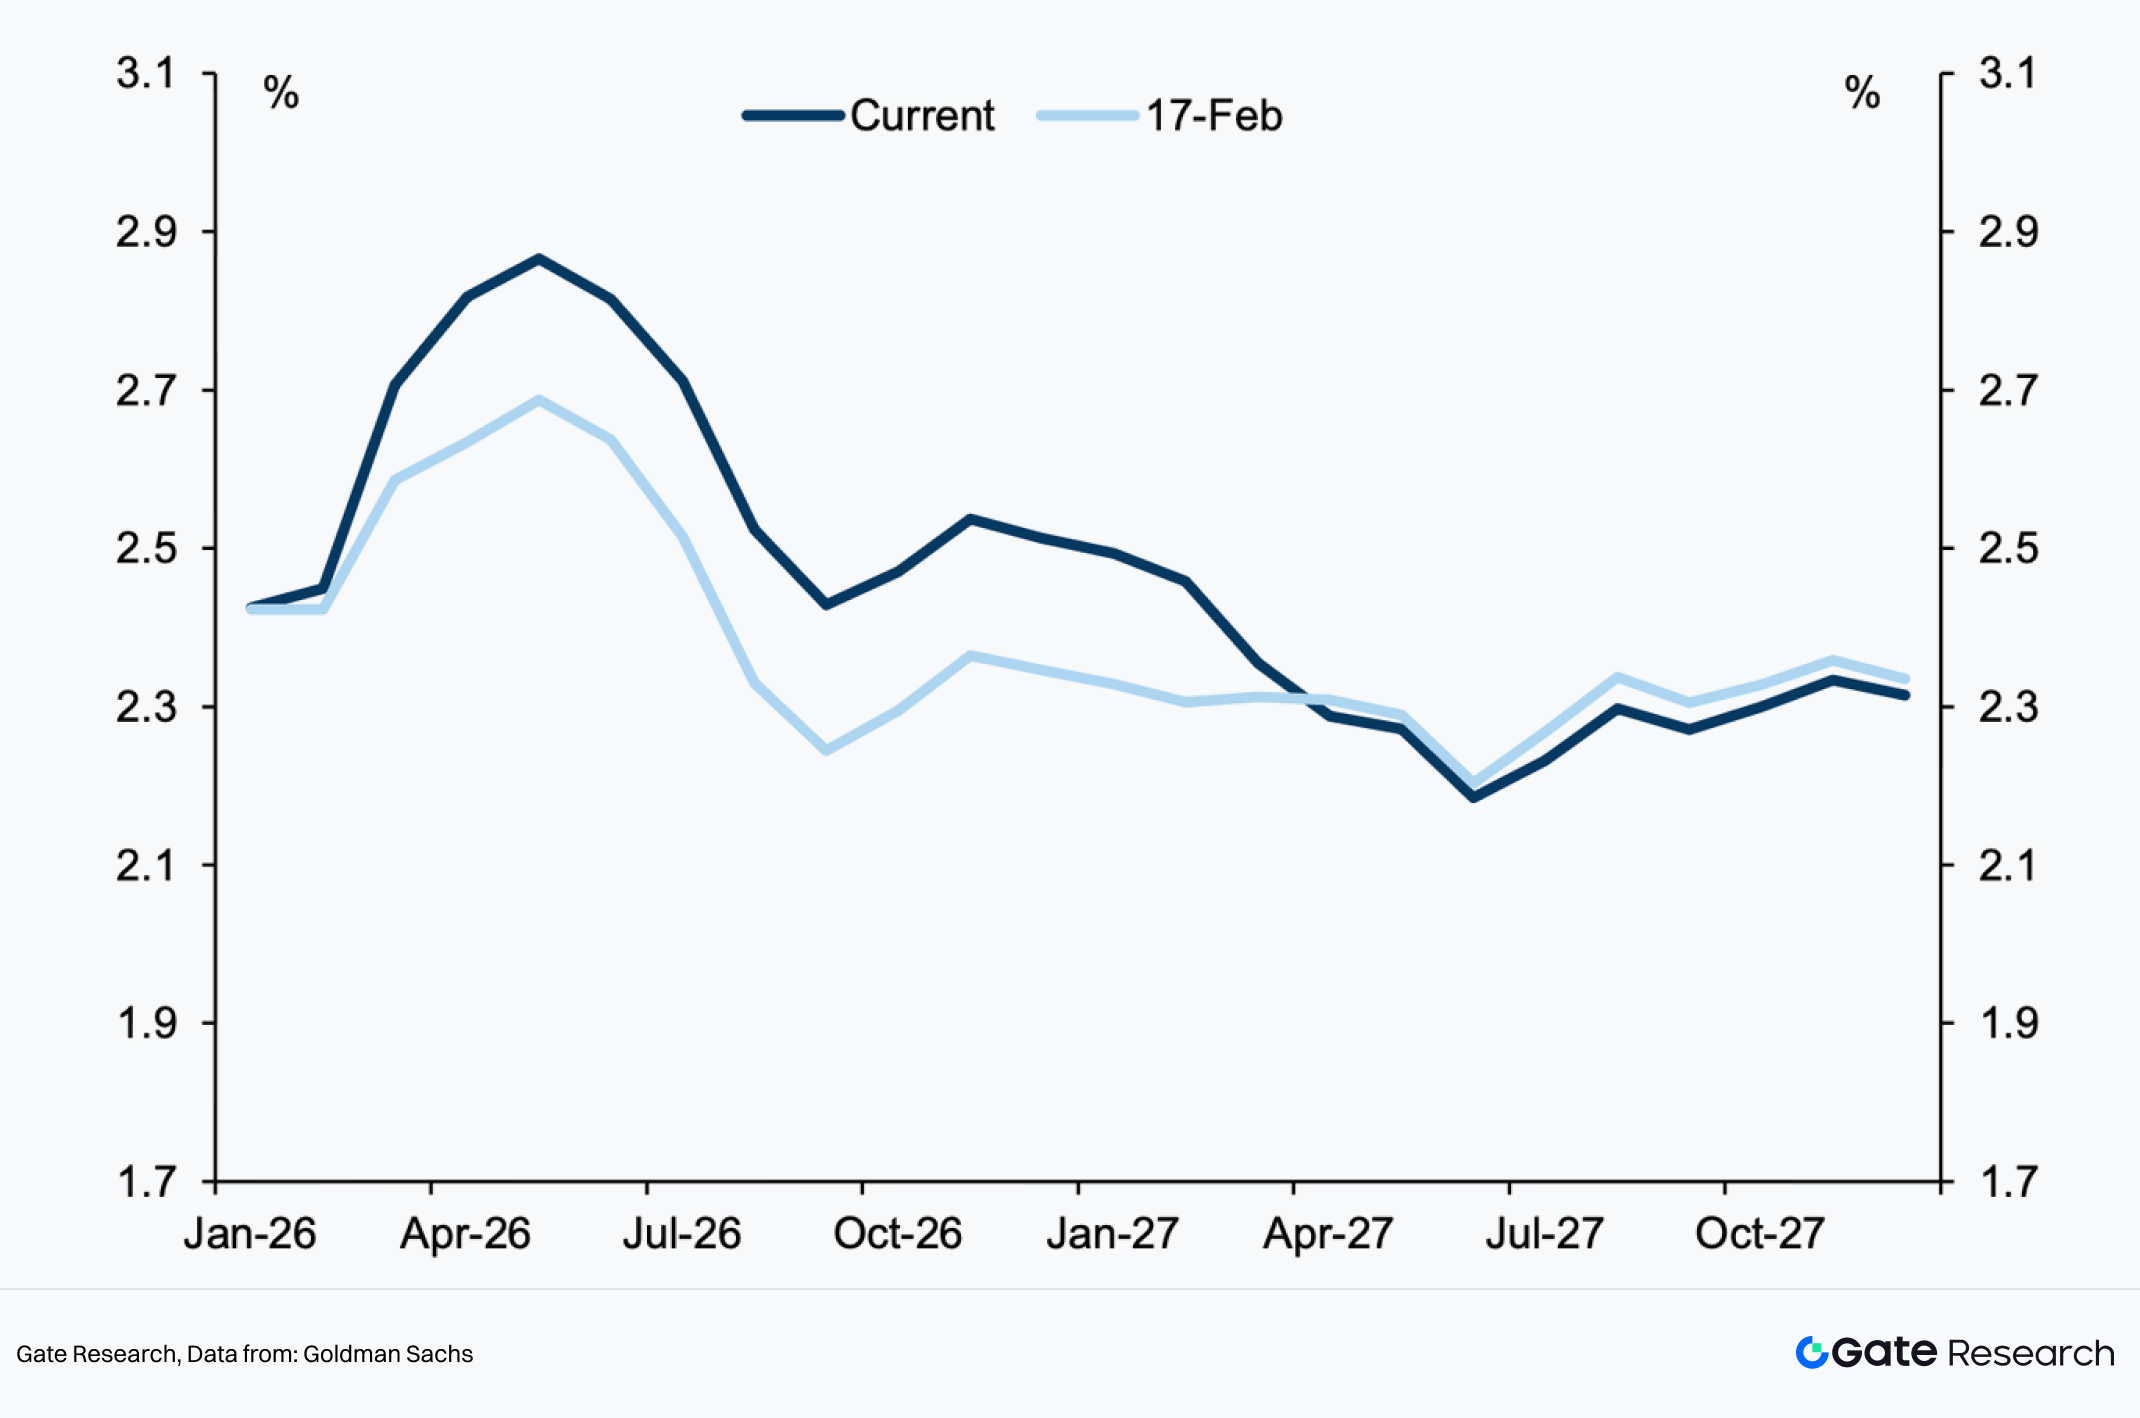
Under normal circumstances, when uncertainty rises and the distribution of risks shifts toward the tail, the market’s first reaction is to increase risk premiums. For example, short-term inflation expectations rose over the weekend, reflecting concerns about higher energy prices. However, the market has already partially priced in the risks of slower economic growth and rising inflation to some extent.
The current market pricing logic is in a highly sensitive and fragile balancing phase. If the situation ultimately moves toward compromise or phased de-escalation—similar to the “Venezuela incident” scenario earlier this year—the previously accumulated geopolitical risk premium could unwind rapidly, triggering a significant pullback in commodity prices. Conversely, if the conflict escalates in a spiral and spreads more deeply, gold and oil prices may face the risk of further sharp surges.
2.1.1 BTC and Other Crypto Assets
Impacts Observed:
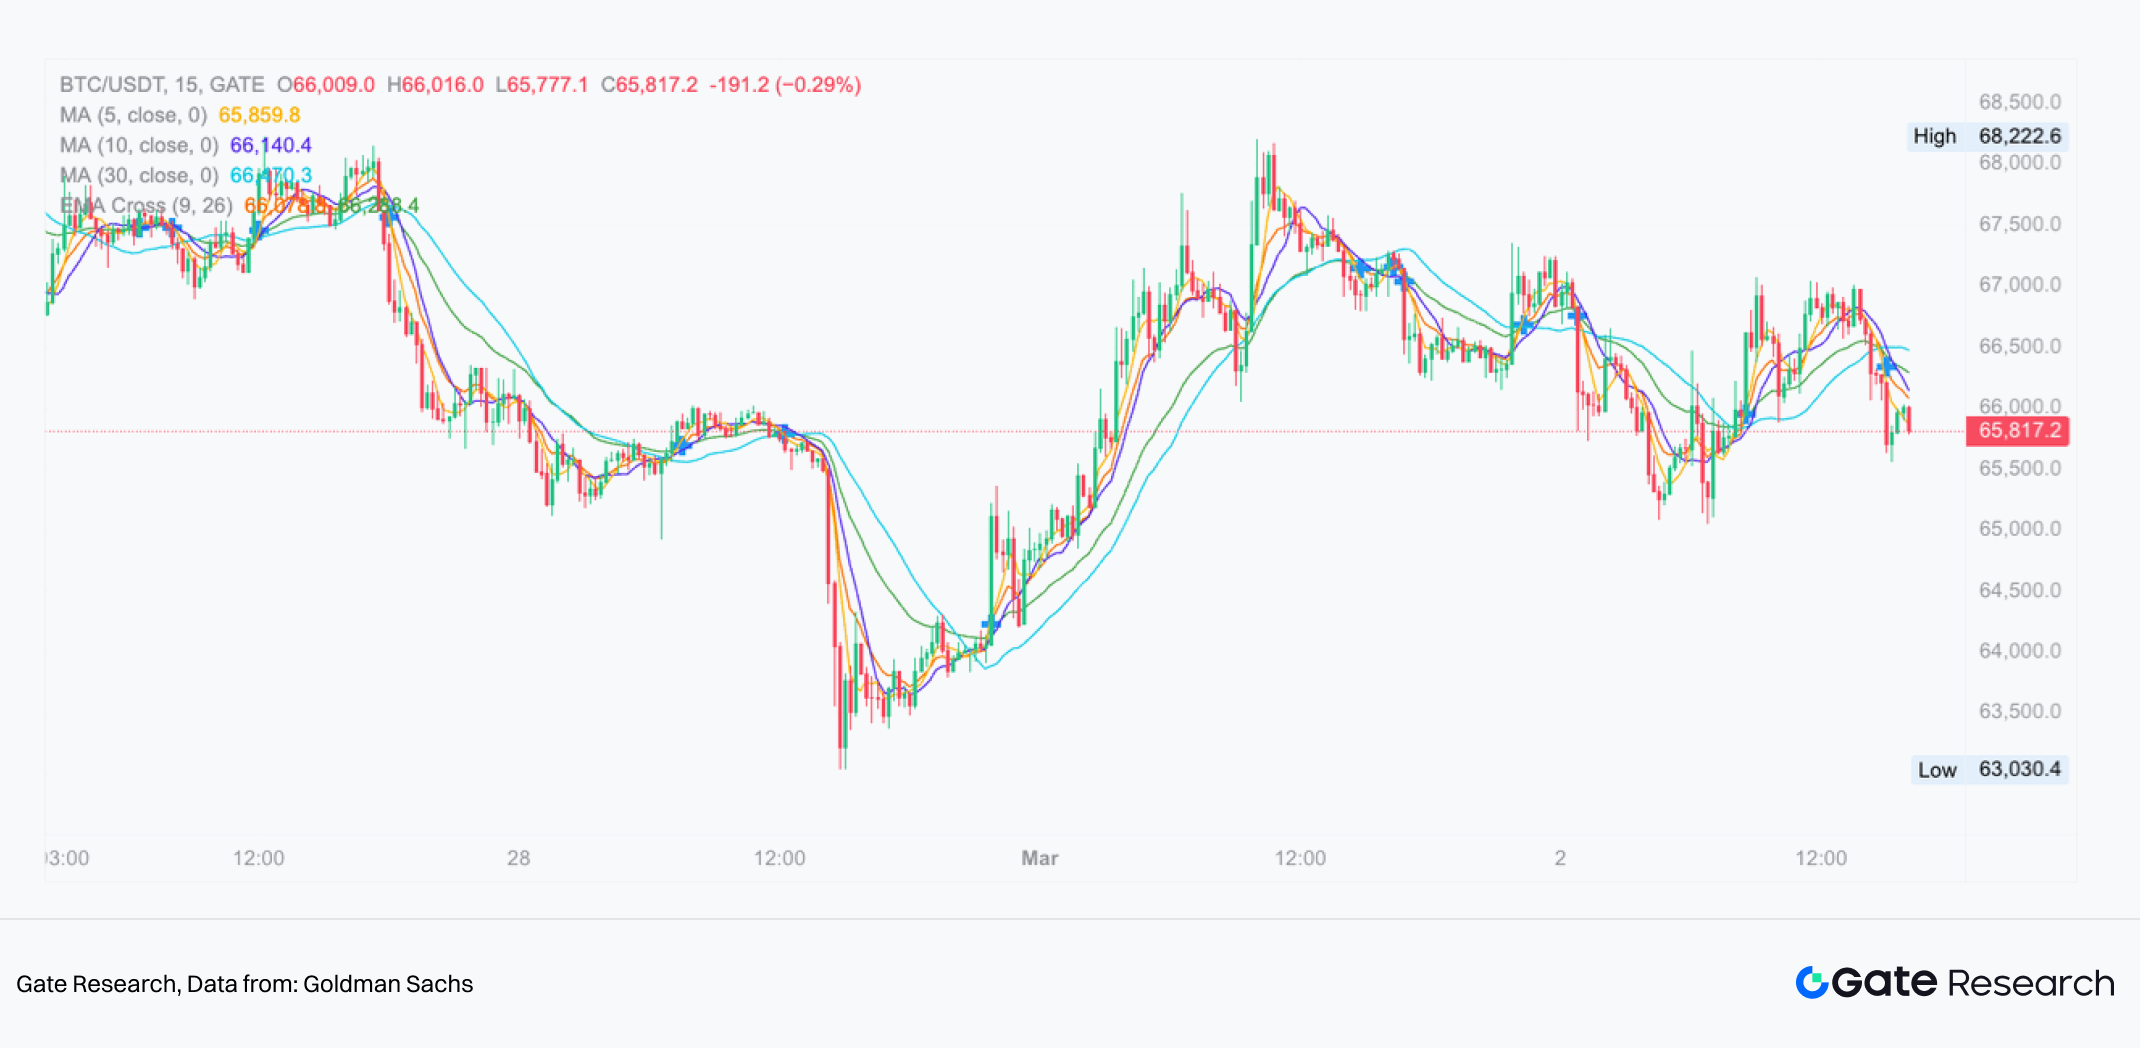
Amid the escalation of U.S.–Iran conflict news, Bitcoin experienced a noticeable increase in volatility. From a market structure perspective (15-minute timeframe), BTC briefly plunged to around the $63,000 level before rebounding above $68,000, then entered a phase of high-level consolidation.
Short-term moving averages (MA5/MA10) repeatedly crossed with the medium-term moving average (MA30), reflecting rapid shifts in market sentiment. Overall, Bitcoin behaved more like a “high-volatility risk asset” rather than a stable safe-haven asset—experiencing liquidity-driven, panic-style declines at the onset of the conflict, followed by a rebound alongside the broader recovery in risk assets.
This suggests that short-term capital, in the face of geopolitical shocks, prioritizes reducing leverage and overall risk exposure.
Institutional Forecasts
Mainstream institutions hold differing views on BTC, but the overall consensus leans toward a “short-term pressure, medium-term liquidity-dependent” framework:
- Bloomberg Intelligence notes that in the early stages of geopolitical conflicts, markets typically adopt a “haven-first strategy,” prioritizing traditional safe-haven assets. Crypto assets tend to move in tandem with equities and other risk assets, and may therefore face short-term pressure.
- JPMorgan’s Digital Assets team previously stated in its geopolitical conflict research that Bitcoin behaves more like a “risk appetite asset,” with prices more closely correlated to liquidity conditions, the U.S. dollar index, and real interest rates, rather than functioning as a pure safe-haven asset.
- CoinShares Research, in its weekly fund flow report, pointed out that if conflict drives oil prices higher and lifts inflation expectations—thereby delaying the Federal Reserve’s easing cycle—the crypto market could face phased capital outflow pressure.
- Standard Chartered’s Digital Assets Research division previously suggested that under scenarios of extreme financial instability or rising sovereign risk, BTC may regain “alternative asset” buying interest. However, this dynamic typically lags the initial wave of risk-driven sell-offs.
Overall Assessment:
- If the conflict remains regional and oil prices rise only modestly → BTC may remain in a high-volatility range-bound pattern.
- If oil prices surge significantly and delay rate-cut expectations → BTC may face liquidity-driven pressure.
- If the conflict triggers systemic global financial concerns → BTC may attract “credit risk hedge” buying in a second phase.
2.1.2 U.S. Equities
Impacts Observed:
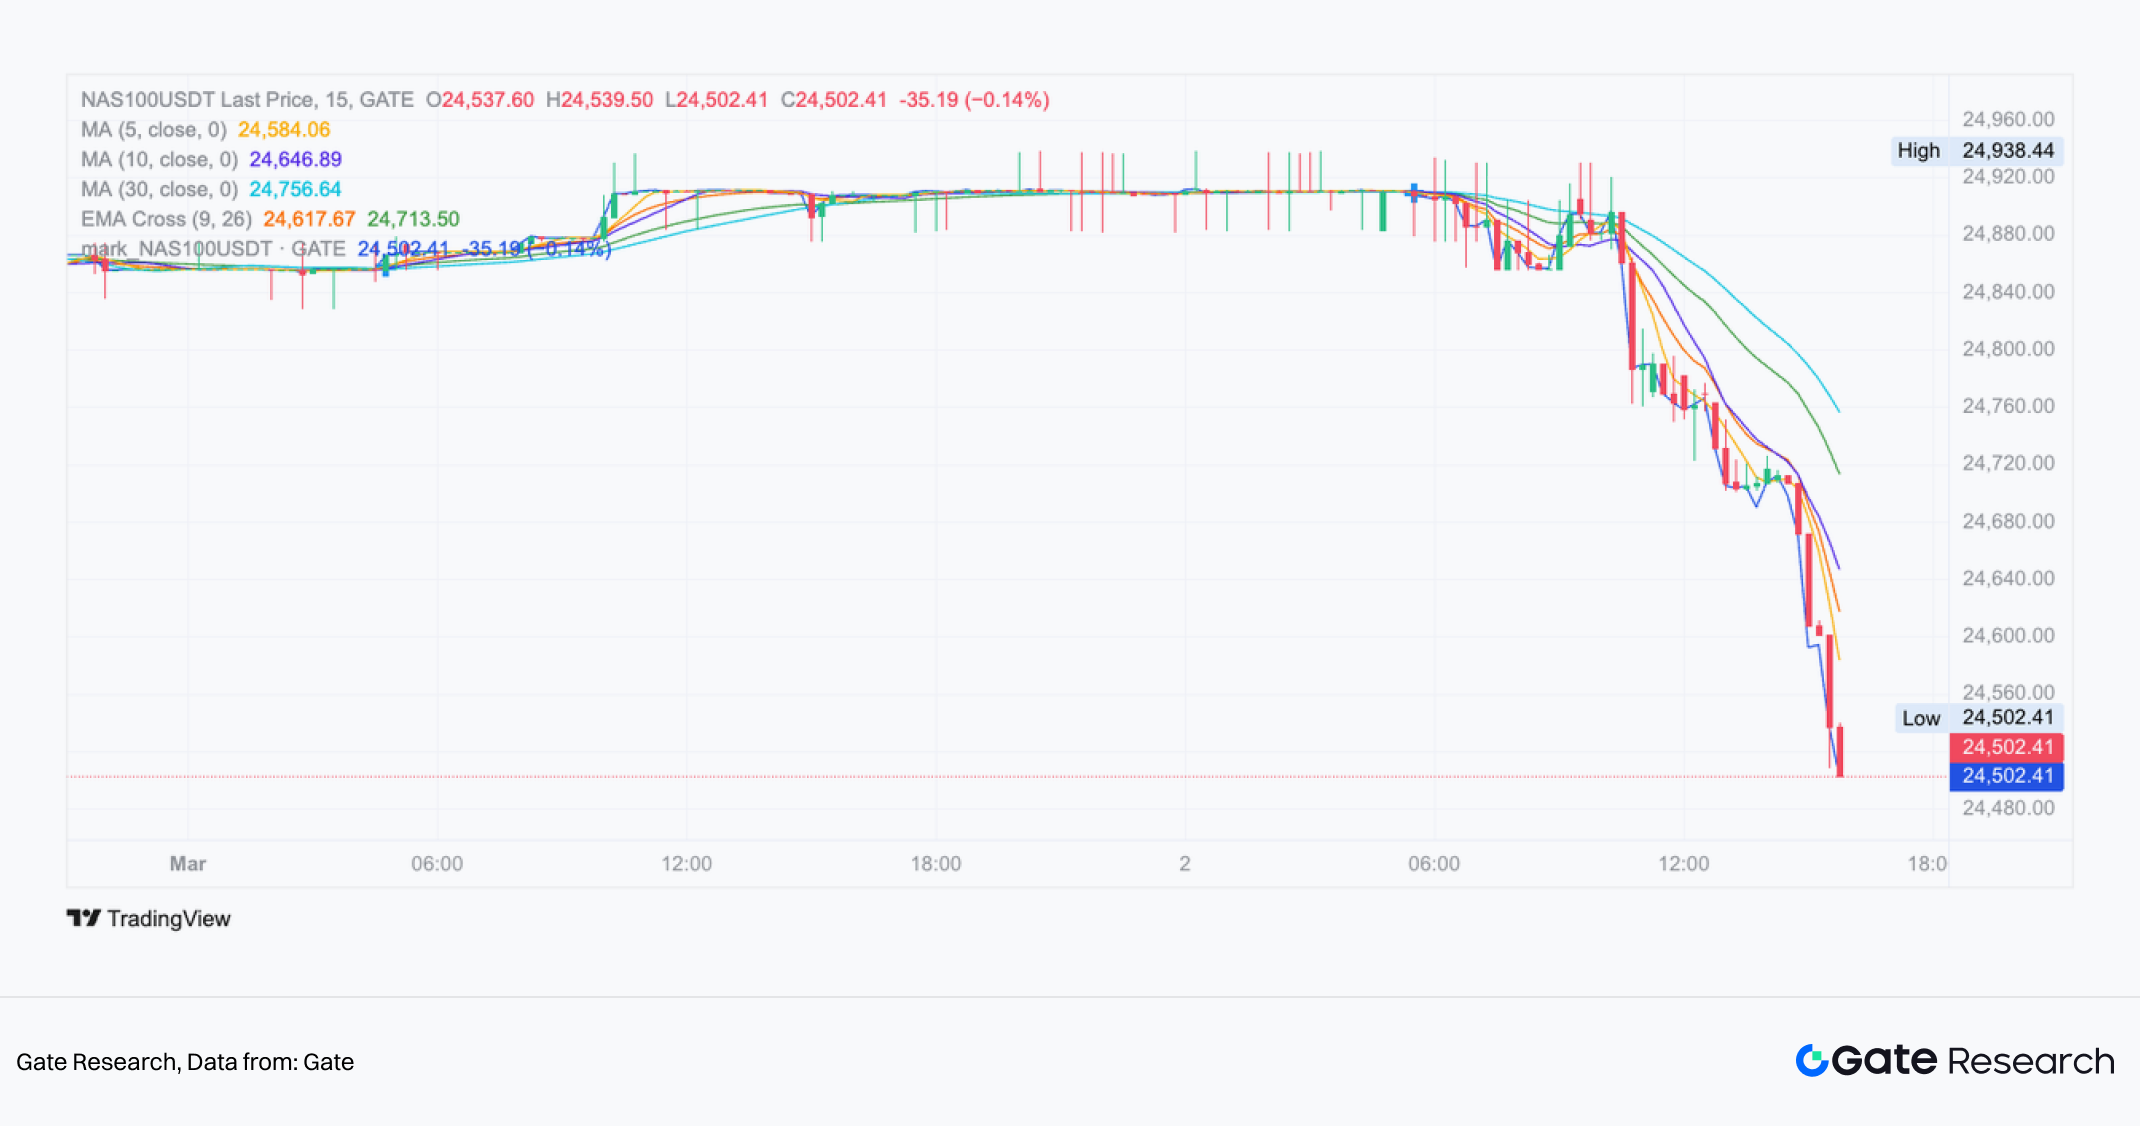
Amid the escalation of the U.S.–Iran conflict, the Nasdaq has clearly reflected pressure typical of risk assets. From a market structure perspective, the index previously surged above 25,400 before pulling back sharply. As the news developed, it formed a large bearish candle in a one-sided decline, breaking below its prior consolidation range and falling to around 24,500 at the lows.
On the 15-minute timeframe, the chart displayed a classic pattern of “weakening at highs → break of structural support → feeble rebound → new lows.” Rebound highs progressively declined, and the bearish momentum remained clear.
Technology stocks, which are highly sensitive to liquidity and interest rate expectations, came under pressure as geopolitical tensions pushed oil prices higher and reignited inflation concerns. Capital visibly reduced risk exposure, with growth sectors bearing the brunt of the sell-off.
Overall, this round of conflict has compressed the Nasdaq’s risk premium in the short term, with the market shifting from a “risk appetite-driven” regime to a “defense-first” positioning stance.
Institutional Forecasts
- Bloomberg Intelligence notes that during escalating Middle East conflicts, markets typically adopt a “risk-off + haven-first” strategy, with technology and growth sectors often leading the initial pullback.
- JPMorgan’s Global Strategy team believes that if oil prices continue rising and push up inflation expectations, this could limit the Federal Reserve’s room to cut rates, thereby placing valuation pressure on high-multiple technology stocks.
- Goldman Sachs, in its strategy report, points out that in the early stages of geopolitical shocks, equity market volatility tends to rise, and growth-heavy indices such as the Nasdaq often experience larger drawdowns than the S&P 500.
- Morgan Stanley, in prior risk scenario models, indicated that if energy prices rise above certain thresholds for a sustained period, the risk of valuation compression in growth stocks increases.
Overall Assessment:
- If the conflict remains regional and oil prices stabilize → The Nasdaq may enter a high-volatility consolidation phase.
- If oil prices break above key ranges and lift inflation expectations → Technology stocks may continue to face pressure.
- If the conflict de-escalates quickly → Risk appetite could recover, potentially leading to a technical rebound in the Nasdaq.
From the current structure, the Nasdaq has entered a short-term bearish channel. Its next directional move will depend on oil price trends, changes in the U.S. dollar and Treasury yields, and whether the conflict escalates further.
In the short term, U.S. equities are experiencing mild disruption from geopolitical sentiment. Over the longer term, however, markets are likely to revert to fundamentals and valuation dynamics. The risk of an AI bubble bursting appears relatively low; on the contrary, the application of AI technologies in wartime scenarios may provide a structural boost to the U.S. AI sector.
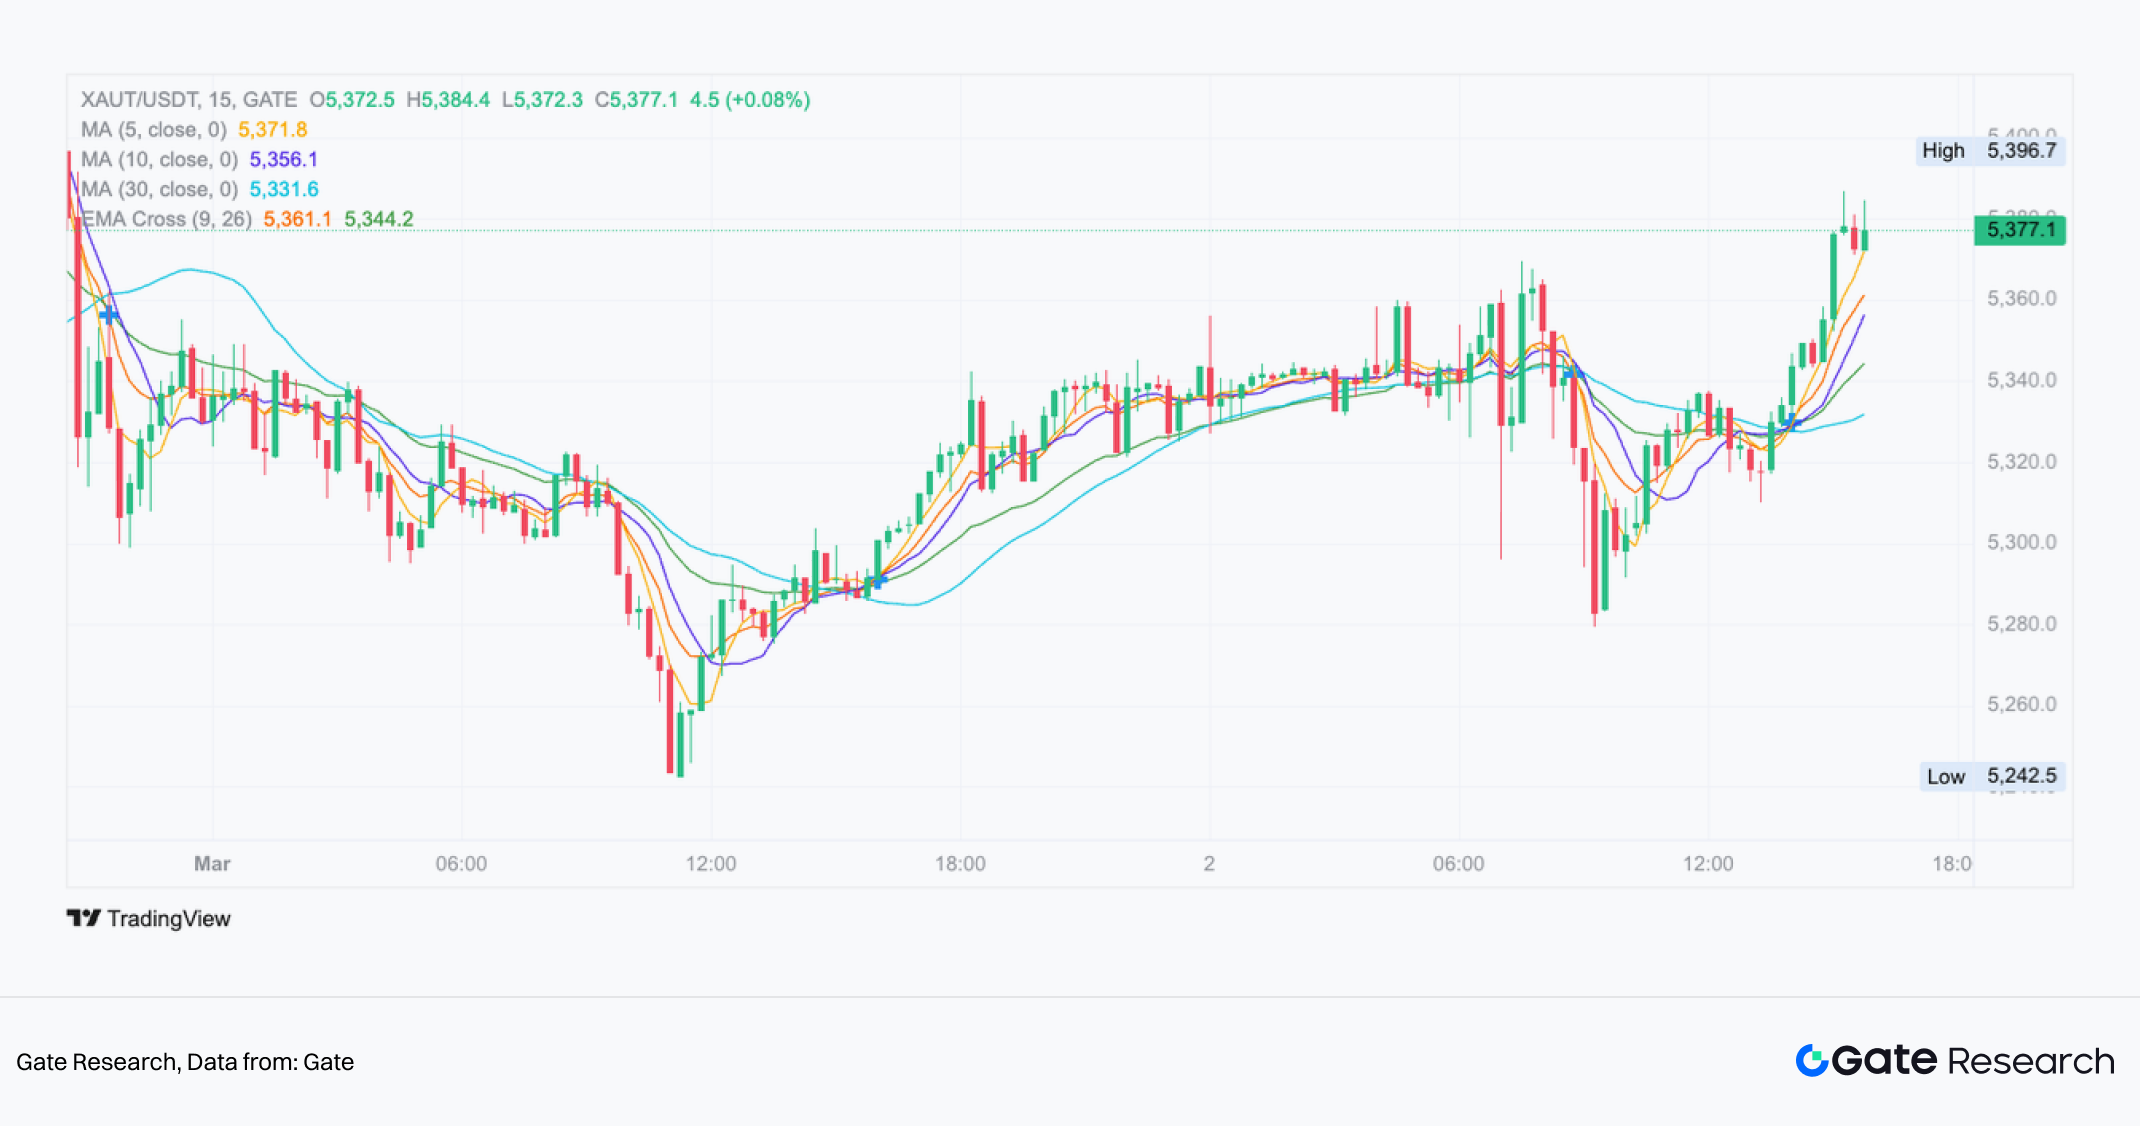
2.1.3 Gold (Gold / XAUT)
Impacts Observed:
Amid the escalation of the U.S.–Iran conflict, gold quickly demonstrated its typical safe-haven characteristics. From a market structure perspective, gold prices experienced a near-vertical rally during the peak of the news flow, breaking above previous highs within a short period and setting new cyclical highs before entering a phase of high-level consolidation.
On the 5-minute and 15-minute timeframes, moving averages displayed a bullish divergence structure. Prices repeatedly pulled back to short-term moving averages before continuing higher, indicating decisive capital inflows.
Notably, while risk assets such as BTC experienced sharp volatility, gold maintained relative strength. This reflects the capital rotation pattern toward safe-haven assets amid rising geopolitical uncertainty. Overall, this round of conflict has clearly elevated gold’s geopolitical risk premium.
Institutional Forecasts
- Bloomberg Intelligence notes that in scenarios of escalating Middle East conflict, gold is typically the preferred safe-haven asset, with capital flowing first into gold and U.S. Treasuries rather than crypto assets.
- Goldman Sachs’ Commodities team previously indicated in its geopolitical conflict models that if energy supply risks persist, gold would benefit from the dual drivers of “safe-haven demand + rising inflation expectations.”
- JPMorgan’s Global Macro Strategy report suggests that if rising oil prices push down real rate expectations or weaken the U.S. dollar, gold could further challenge historical high ranges.
- The World Gold Council, in past geopolitical studies, has pointed out that major military conflicts often lead to a significant initial increase in gold ETF inflows and net long futures positions.
Overall Assessment:
- If the conflict remains regional → Gold may maintain a high-level consolidation with a bullish bias.
- If the conflict continues to escalate and lifts inflation expectations → Gold could enter a trend-driven rally phase, with potential to break above $6,000 per ounce.
- If the conflict de-escalates quickly → The safe-haven premium may unwind, and prices could retrace toward key moving average support levels.
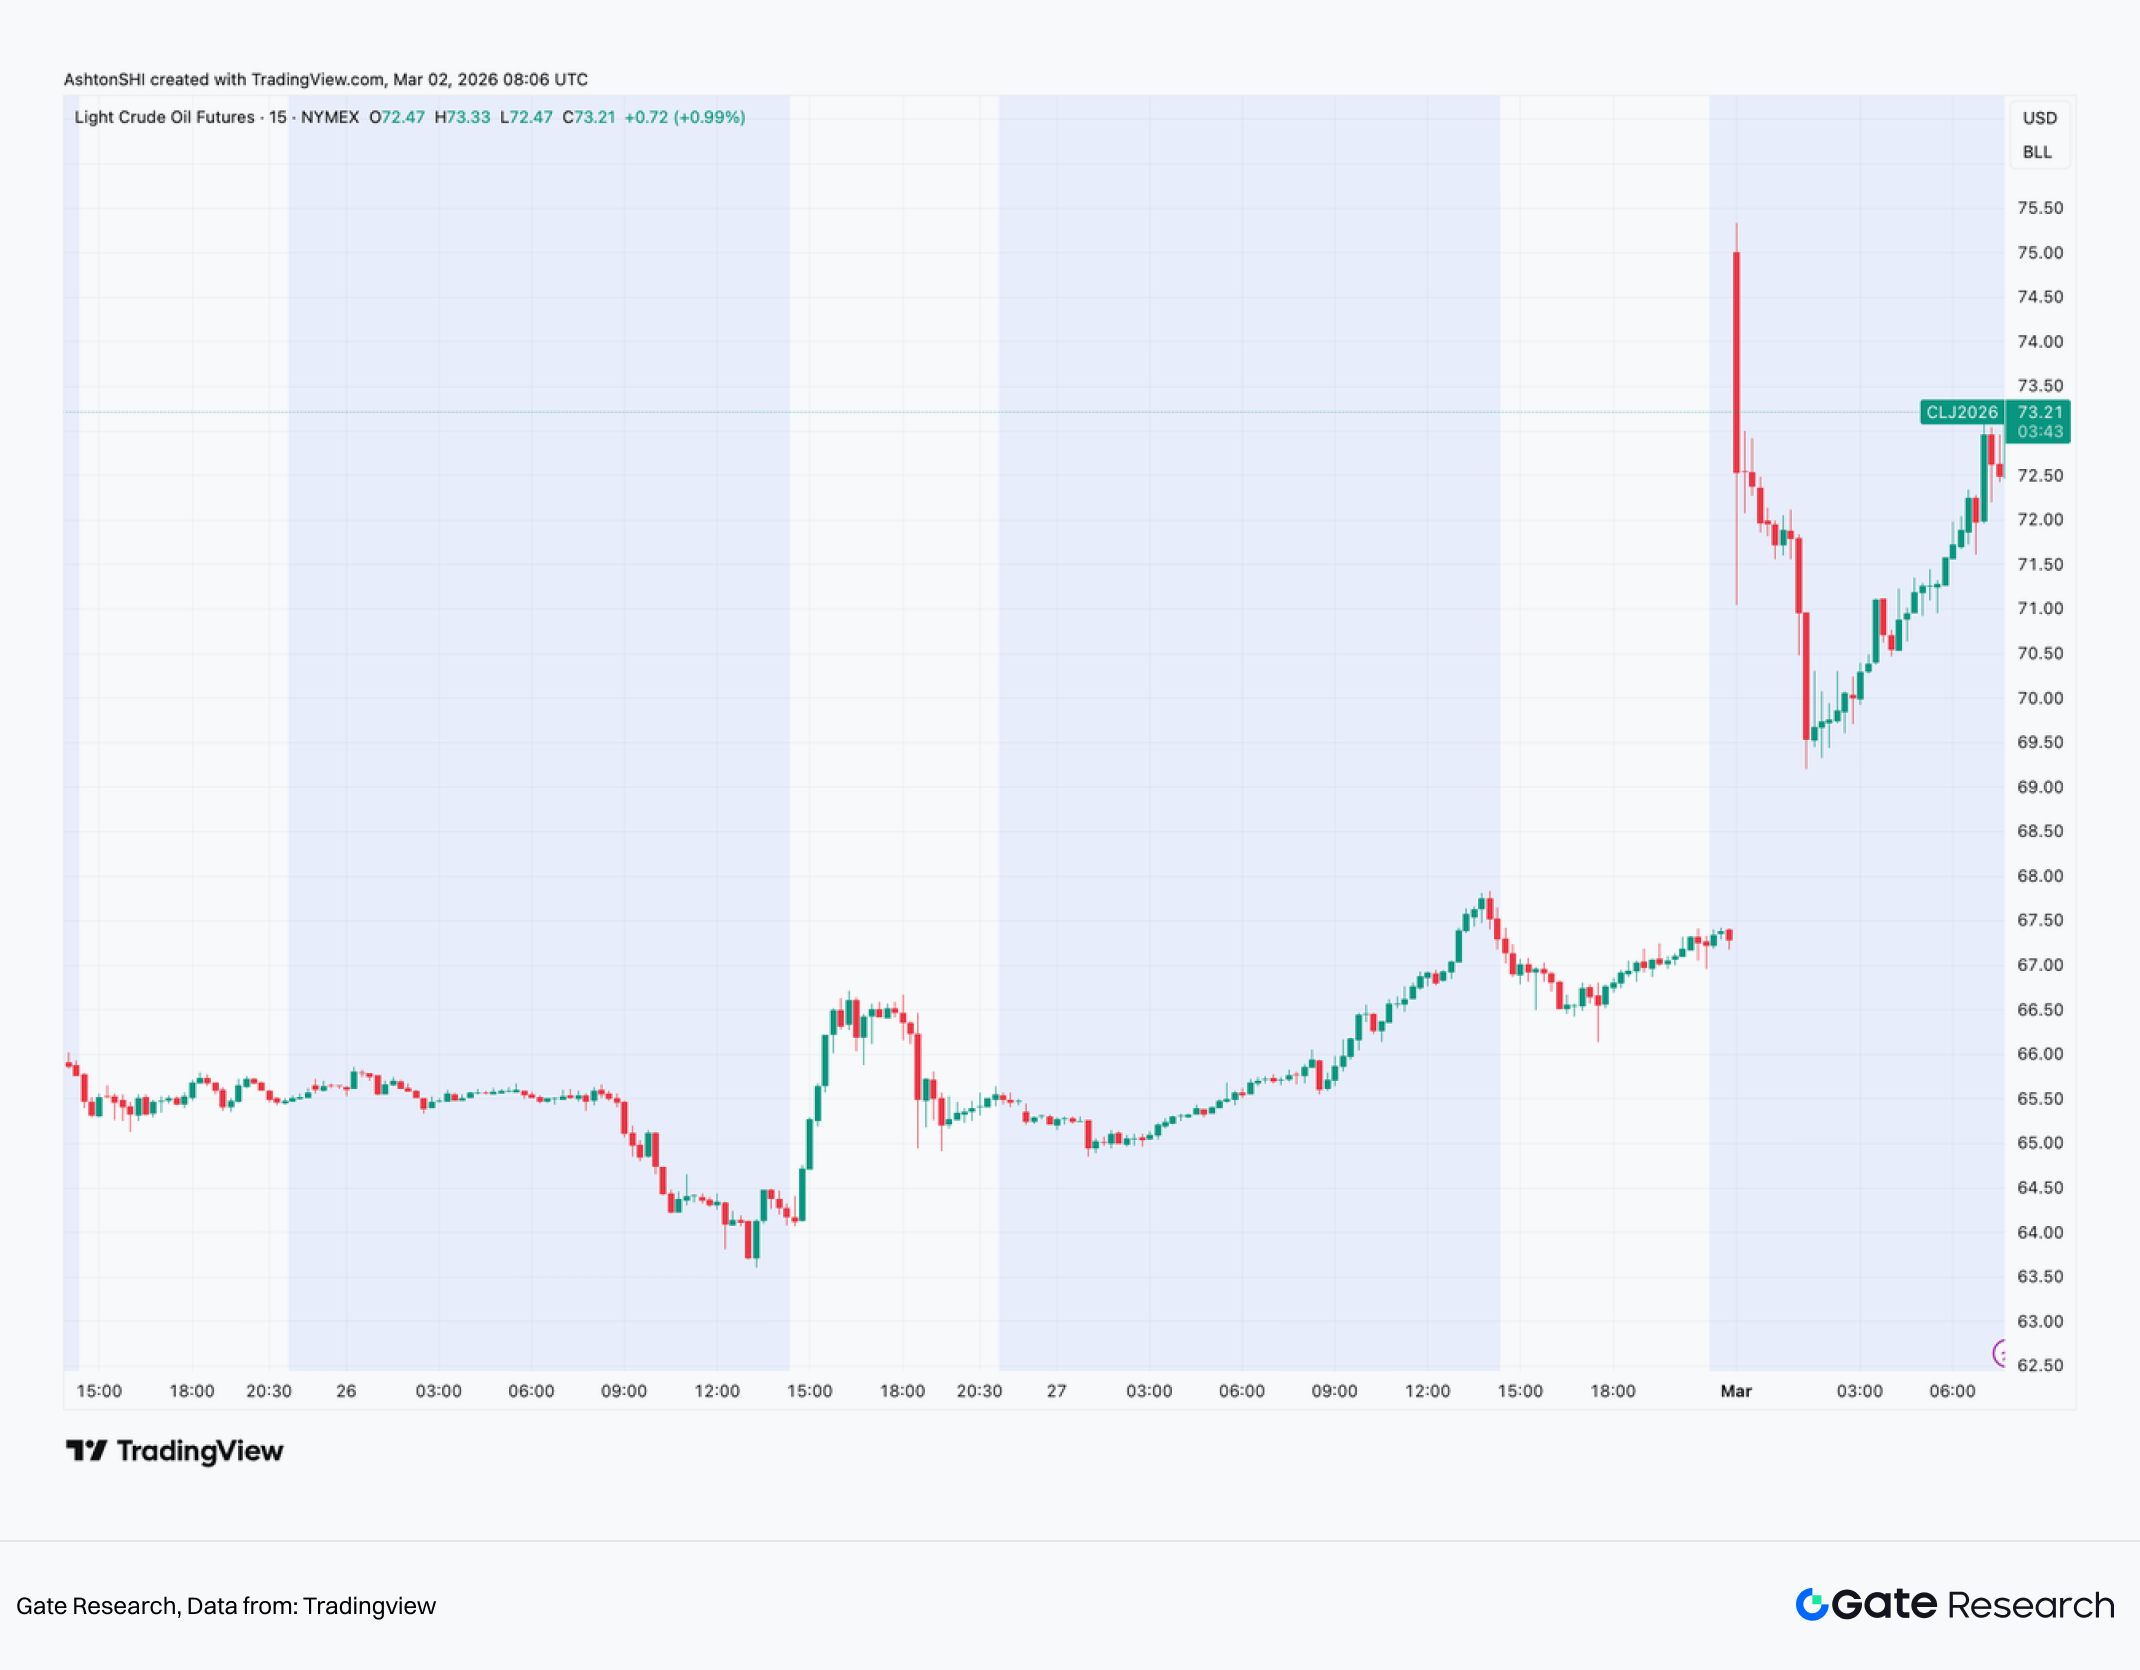
2.1.4 Oil
Impacts Observed:
Amid the escalation of the U.S.–Iran conflict, WTI crude oil exhibited a classic “risk premium spike” pattern. From a market structure perspective, prices surged rapidly following the news trigger, briefly climbing above $75 per barrel before pulling back sharply to around $69, and then entering a technical rebound phase. Prices have since recovered to the $72–73 range.
On the 15-minute timeframe, the price action displayed a pattern of “emotional spike → rapid profit-taking → secondary recovery,” with volatility expanding significantly. In the early stage of the conflict, the market quickly priced in Middle East supply risks—particularly concerns surrounding shipping security in the Strait of Hormuz—thereby lifting the geopolitical risk premium. The subsequent pullback reflected the view among some participants that actual supply had not yet been materially disrupted.
Overall, this round of conflict has clearly elevated oil’s volatility range.
Institutional Forecasts
- Goldman Sachs’ Commodities team notes that if the conflict persists without materially affecting physical supply, oil prices may remain range-bound within a geopolitical risk premium zone. However, if supply chains are disrupted, prices could move further higher.
- JPMorgan Energy Research suggests that during geopolitical conflicts, the key variable for oil prices is whether the Strait of Hormuz faces a substantive threat. If transportation is restricted, prices could rise sharply in a short period.
- Rystad Energy analysis indicates that if Middle Eastern supply experiences temporary disruptions, oil prices could enter a high-volatility regime and probe higher price ranges.
- Bloomberg Intelligence believes that the current rise in oil prices is driven more by risk premiums than by inventory changes, and the next move will depend on whether the conflict materially impacts exports.
Overall Assessment:
- If the conflict remains limited to localized military strikes and does not affect oil exports → WTI may fluctuate within the $70–75 range.
- If transportation routes or production capacity are materially impacted → Oil prices may break above recent highs and enter a rapid upward trend.
- If the conflict de-escalates quickly → The risk premium may unwind, and oil prices could retreat toward previous trading ranges.
From the current structure, oil prices have completed the first round of emotional shock and are now in a “post-volatility repair phase.” The next direction will depend heavily on news flow and the actual extent of supply disruptions. If the conflict intensifies and navigation through the Strait of Hormuz is obstructed, international crude oil prices could set new highs.
2.2 Prediction Market Perspective
Using the latest odds from relevant markets on Polymarket as an event tree framework, the geopolitical conflict involving U.S.–Israel escalation or invasion of Iran can be broken down into several key branches.
2.2.1 Event Tree
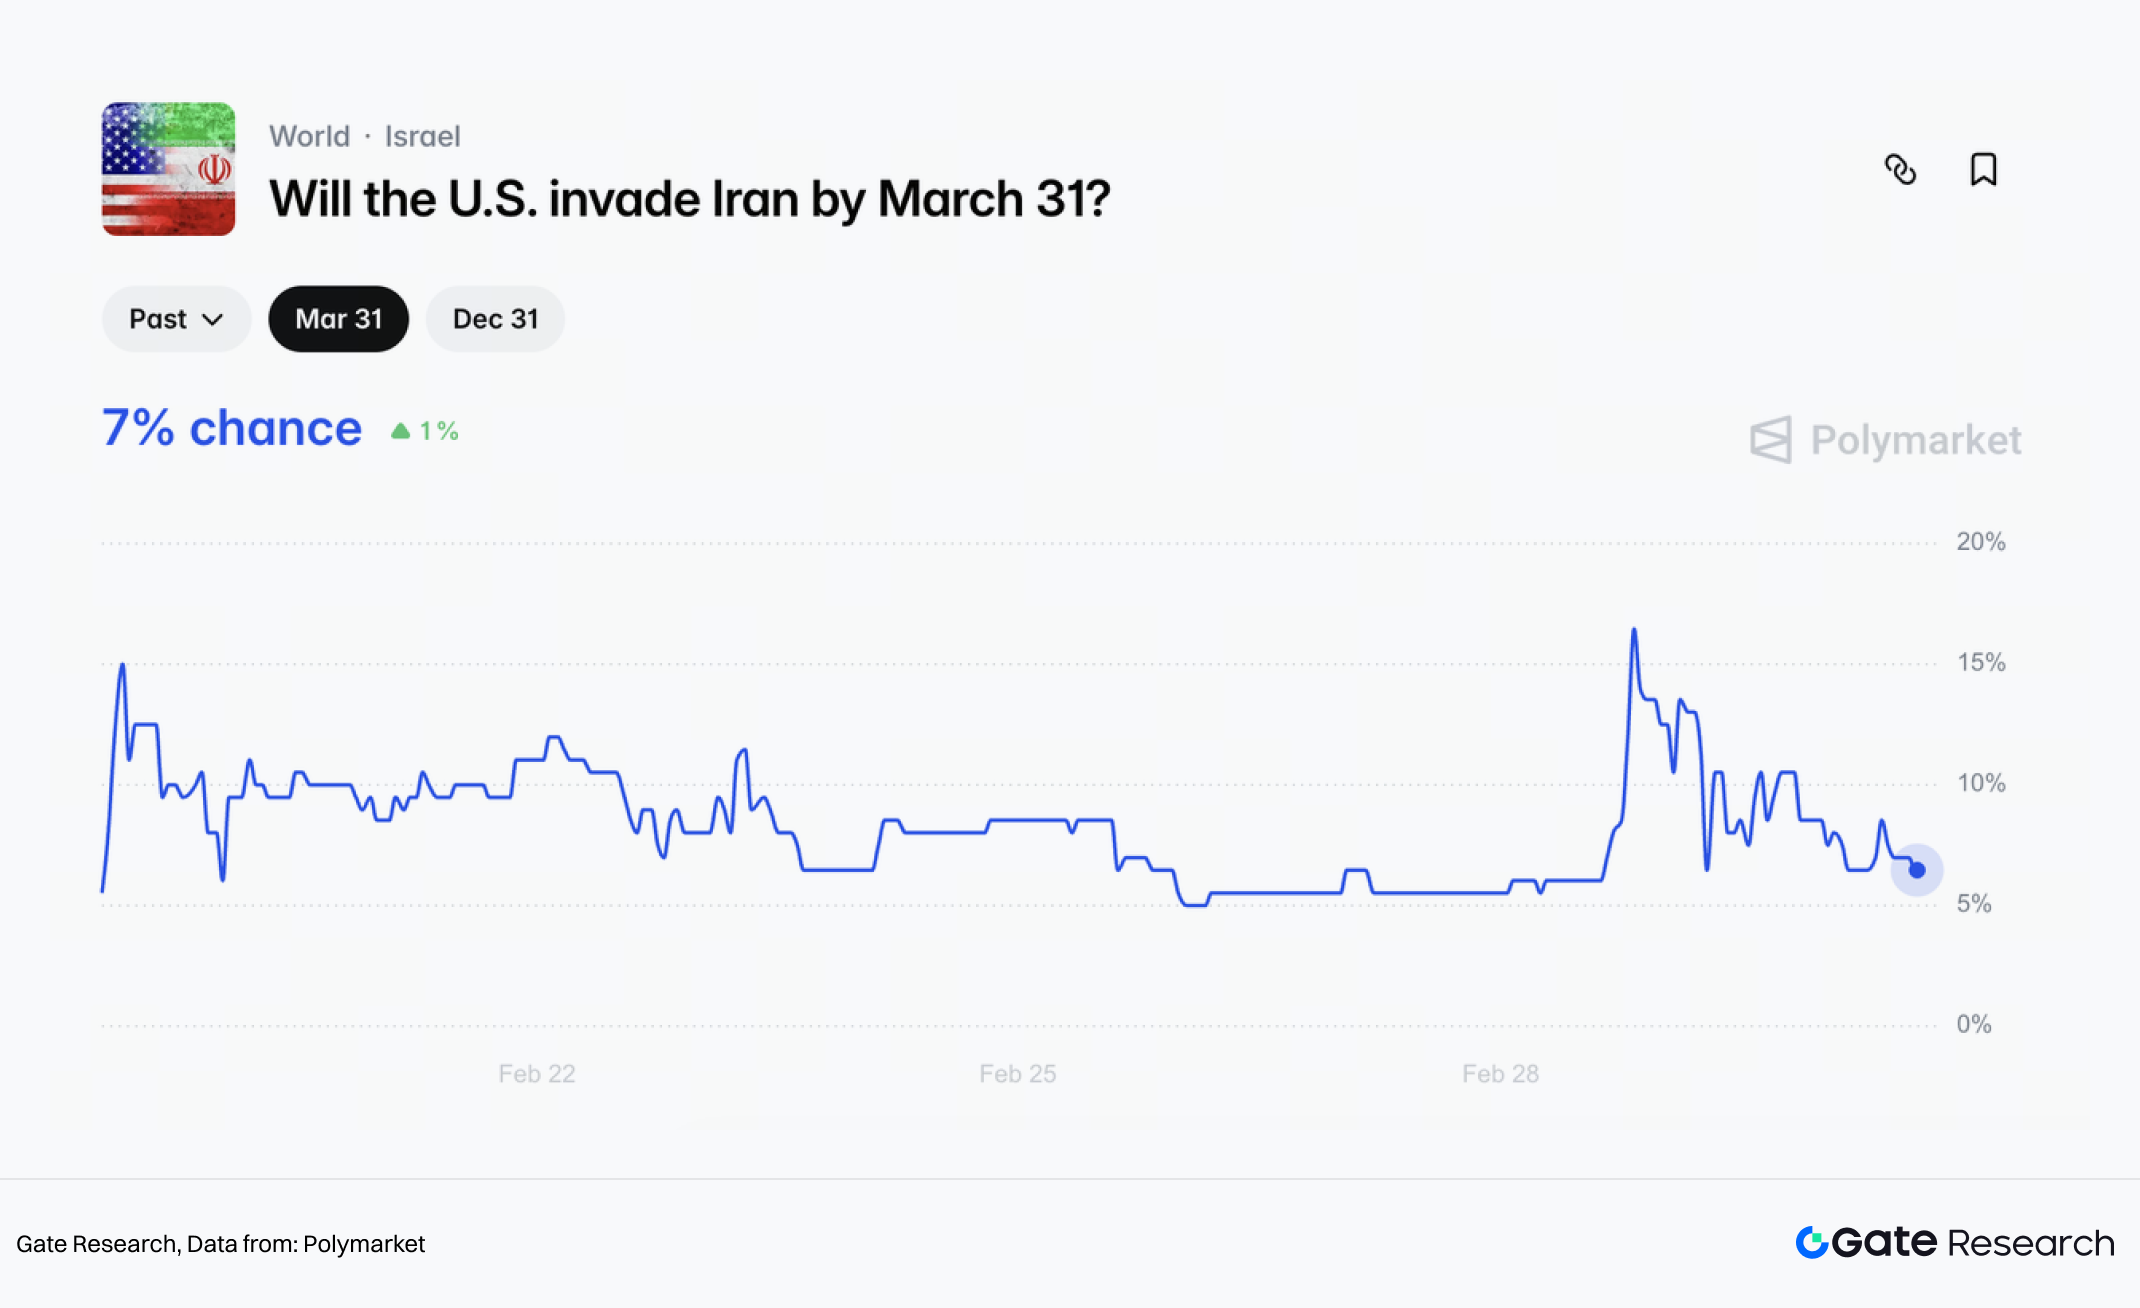
(1) The market assigns a low probability to a “full-scale invasion”
Polymarket currently prices the probability of “the U.S. invading Iran before 3/31” at about 7% (Yes). In this market, “invasion” is defined as the U.S. launching a military offensive and establishing control over parts of Iranian territory.
This definition distinguishes brief airstrikes, targeted attacks, or proxy conflict escalation from a ground-occupation-style invasion. In other words, the market views the latter as a low-probability tail event.
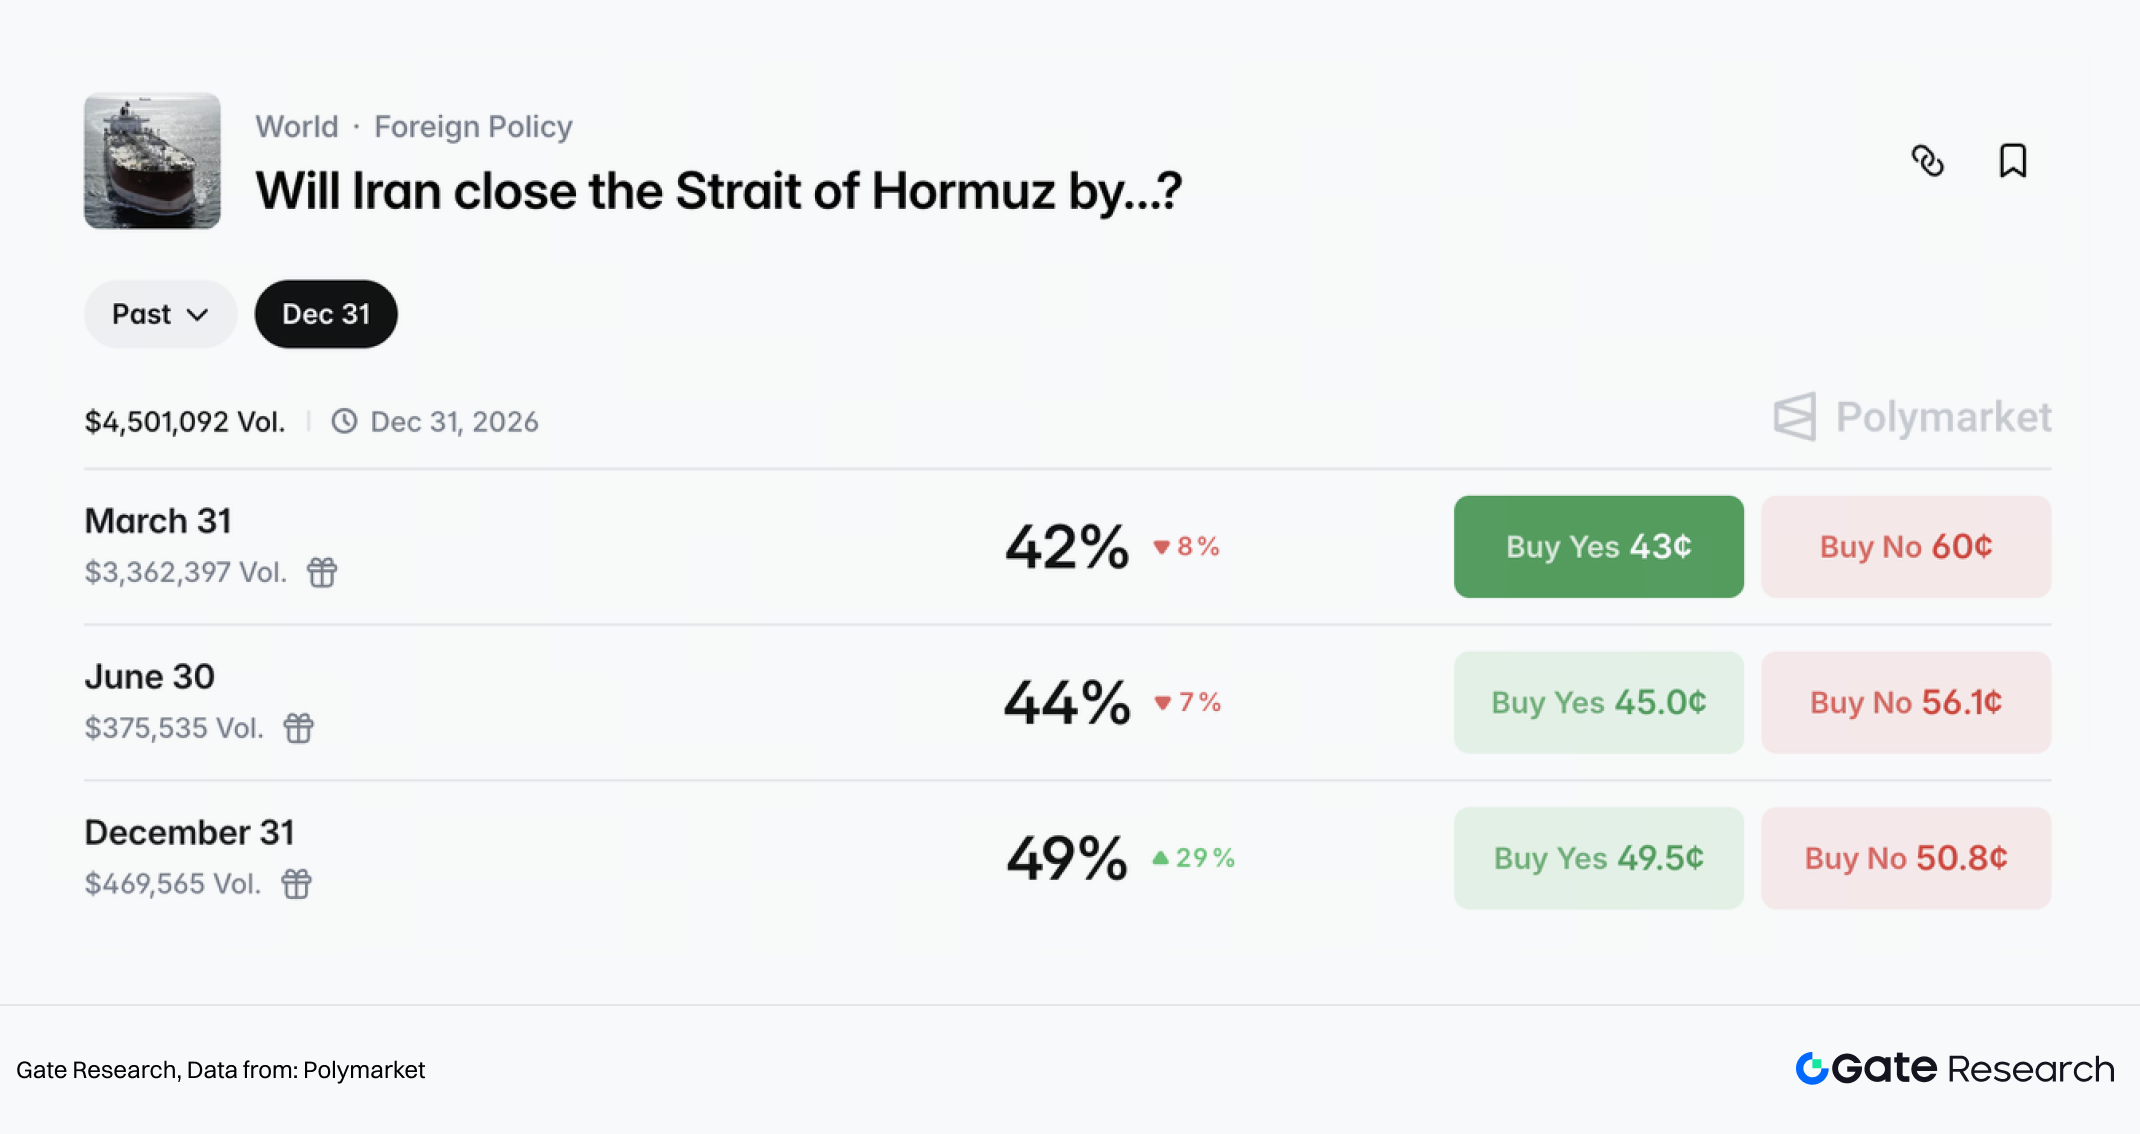
(2) Macro core risk: The tail risk of a Hormuz choke point is not low
Compared to a full-scale invasion, Polymarket assigns much higher probabilities to “Iran closing or severely restricting the Strait of Hormuz before 3/31”:
- ~42% by 3/31
- ~44% by 6/30
- ~49% by 12/31
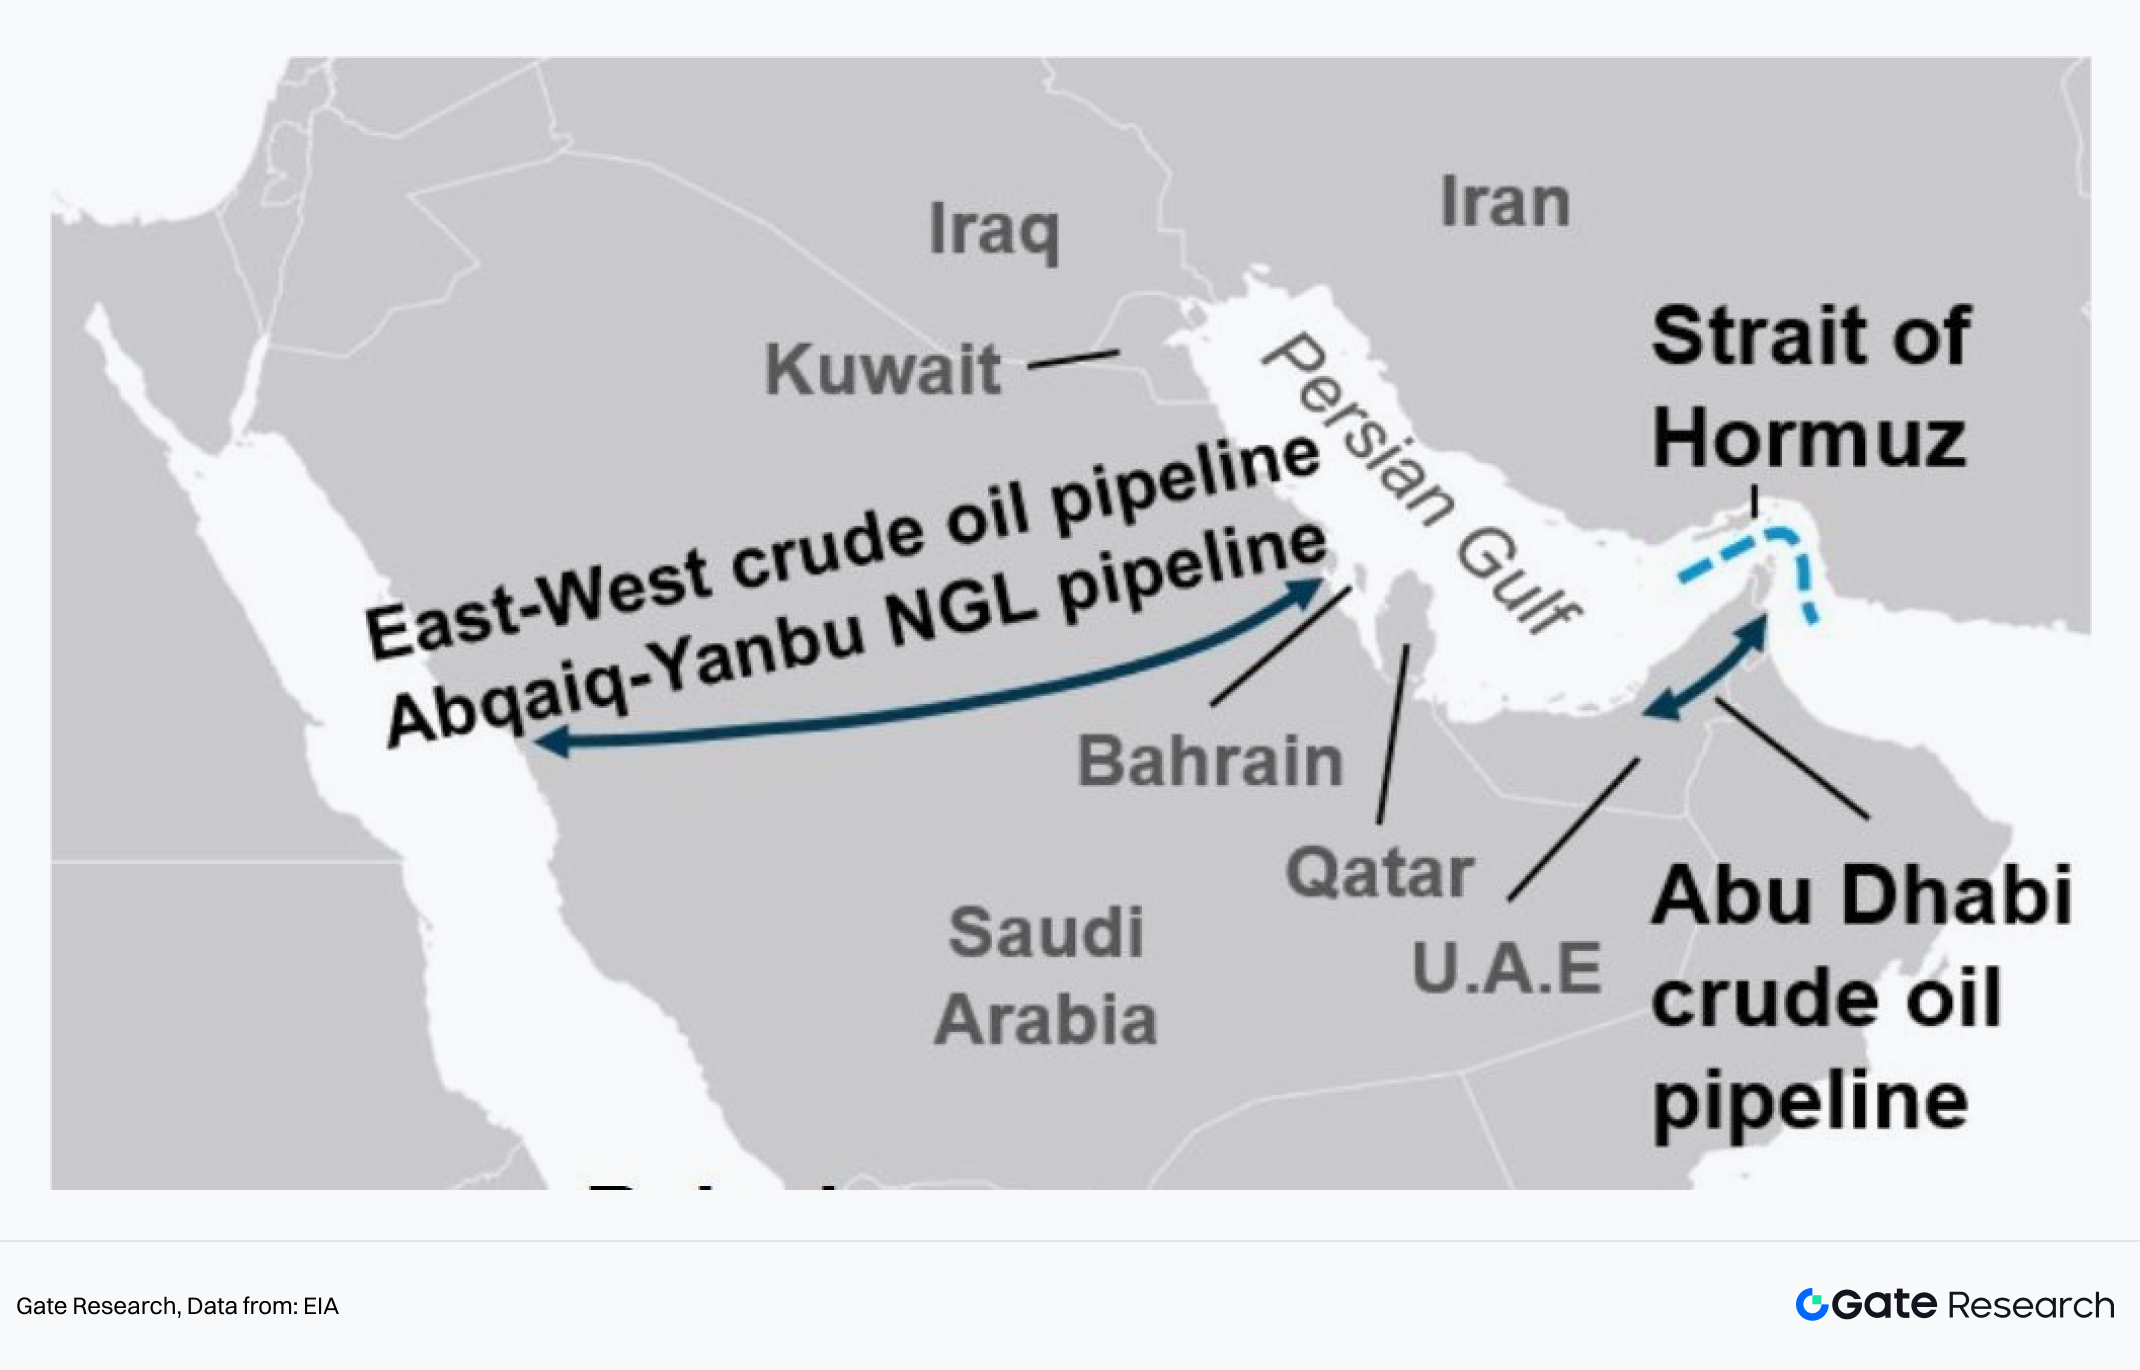
This is the core reason why commodity markets are highly sensitive to geopolitical headlines. The Strait of Hormuz is a critical energy chokepoint. Reuters cites analysis suggesting that more than 20% of global crude oil passes through this route. If sustained disruptions occur, oil prices could be pushed toward or even above the $100 per barrel level.
(3) Conflict intensity may cool within weeks, but formal ceasefire likely later
In terms of timing, Polymarket assigns about a 47% probability that “the conflict ends before 3/31.” However, under the rules, this requires 14 consecutive days without new military action.
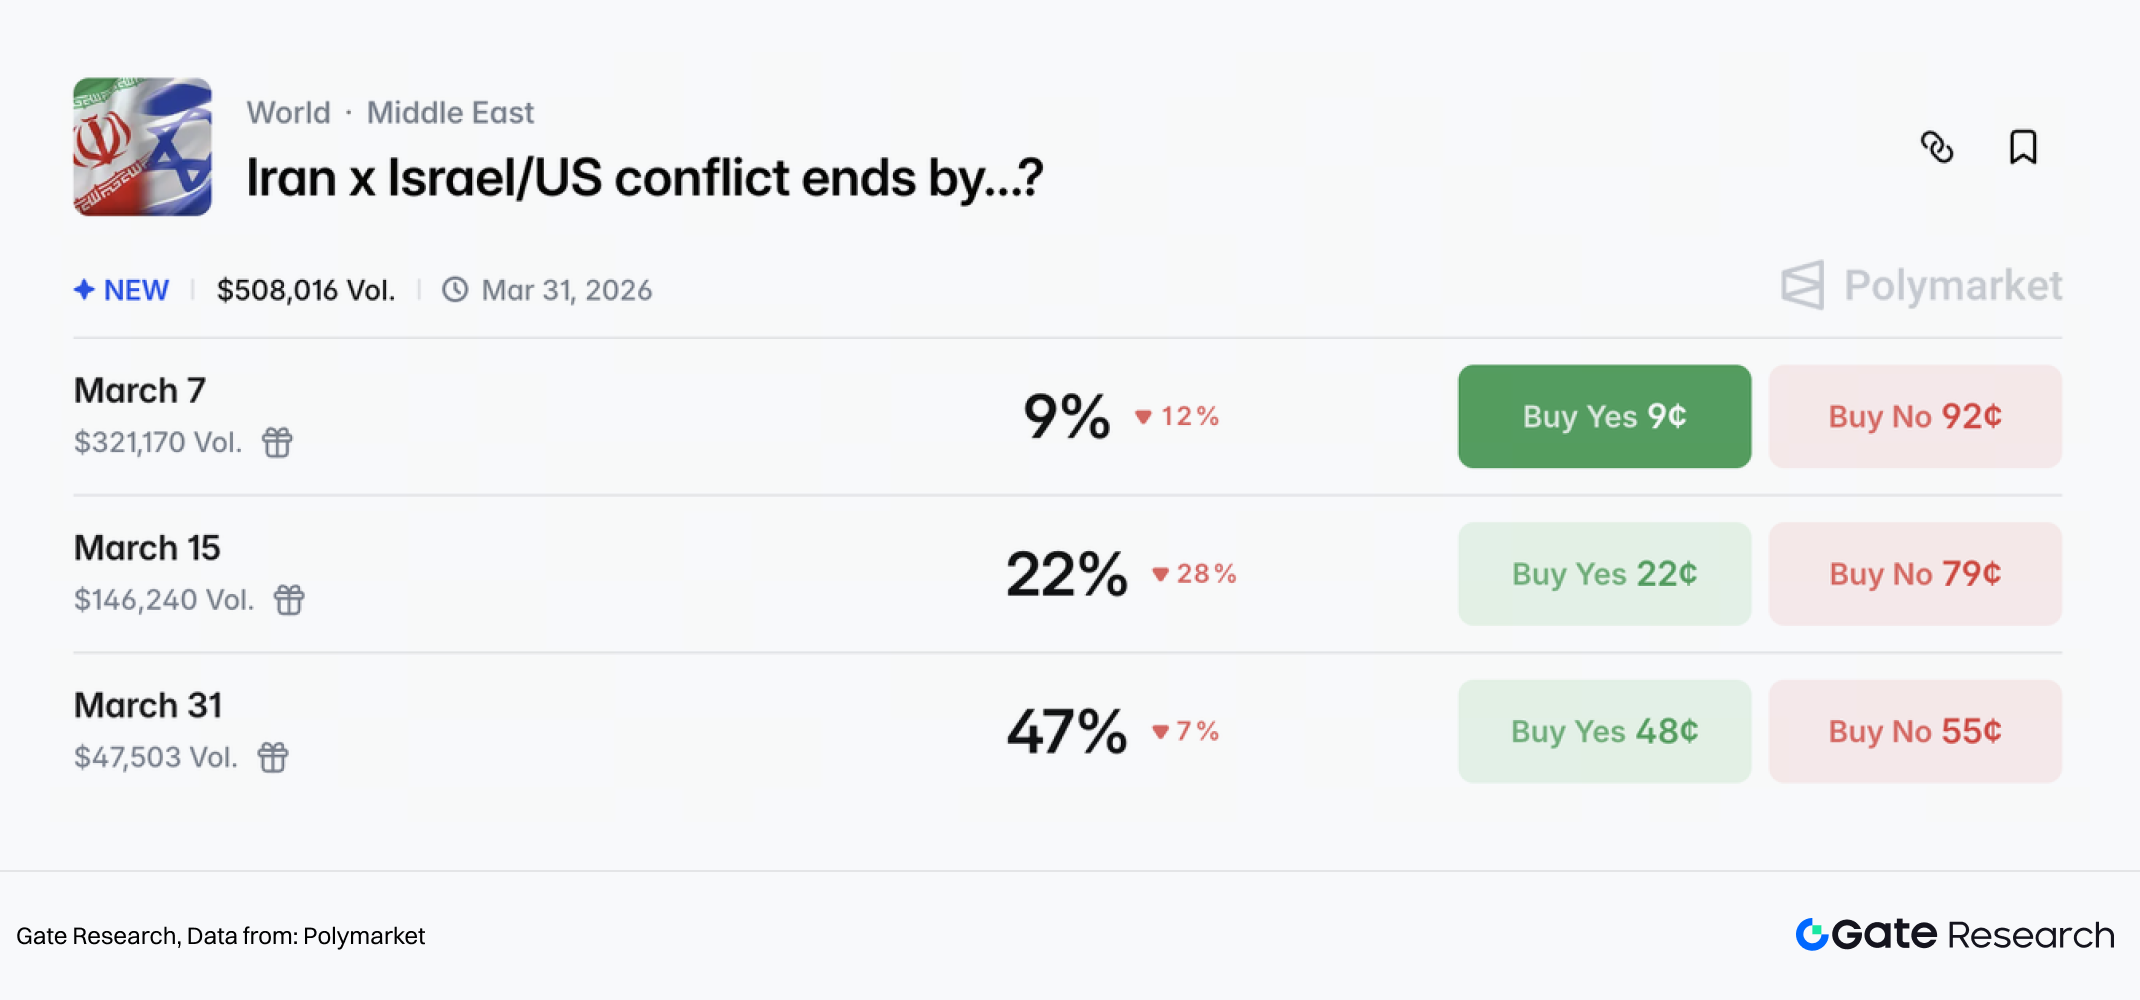
Another, more official event market—“When will the U.S. and Iran reach a formal ceasefire agreement?”—assigns approximately:
- 55% probability before 3/31
- 71% probability before 4/30
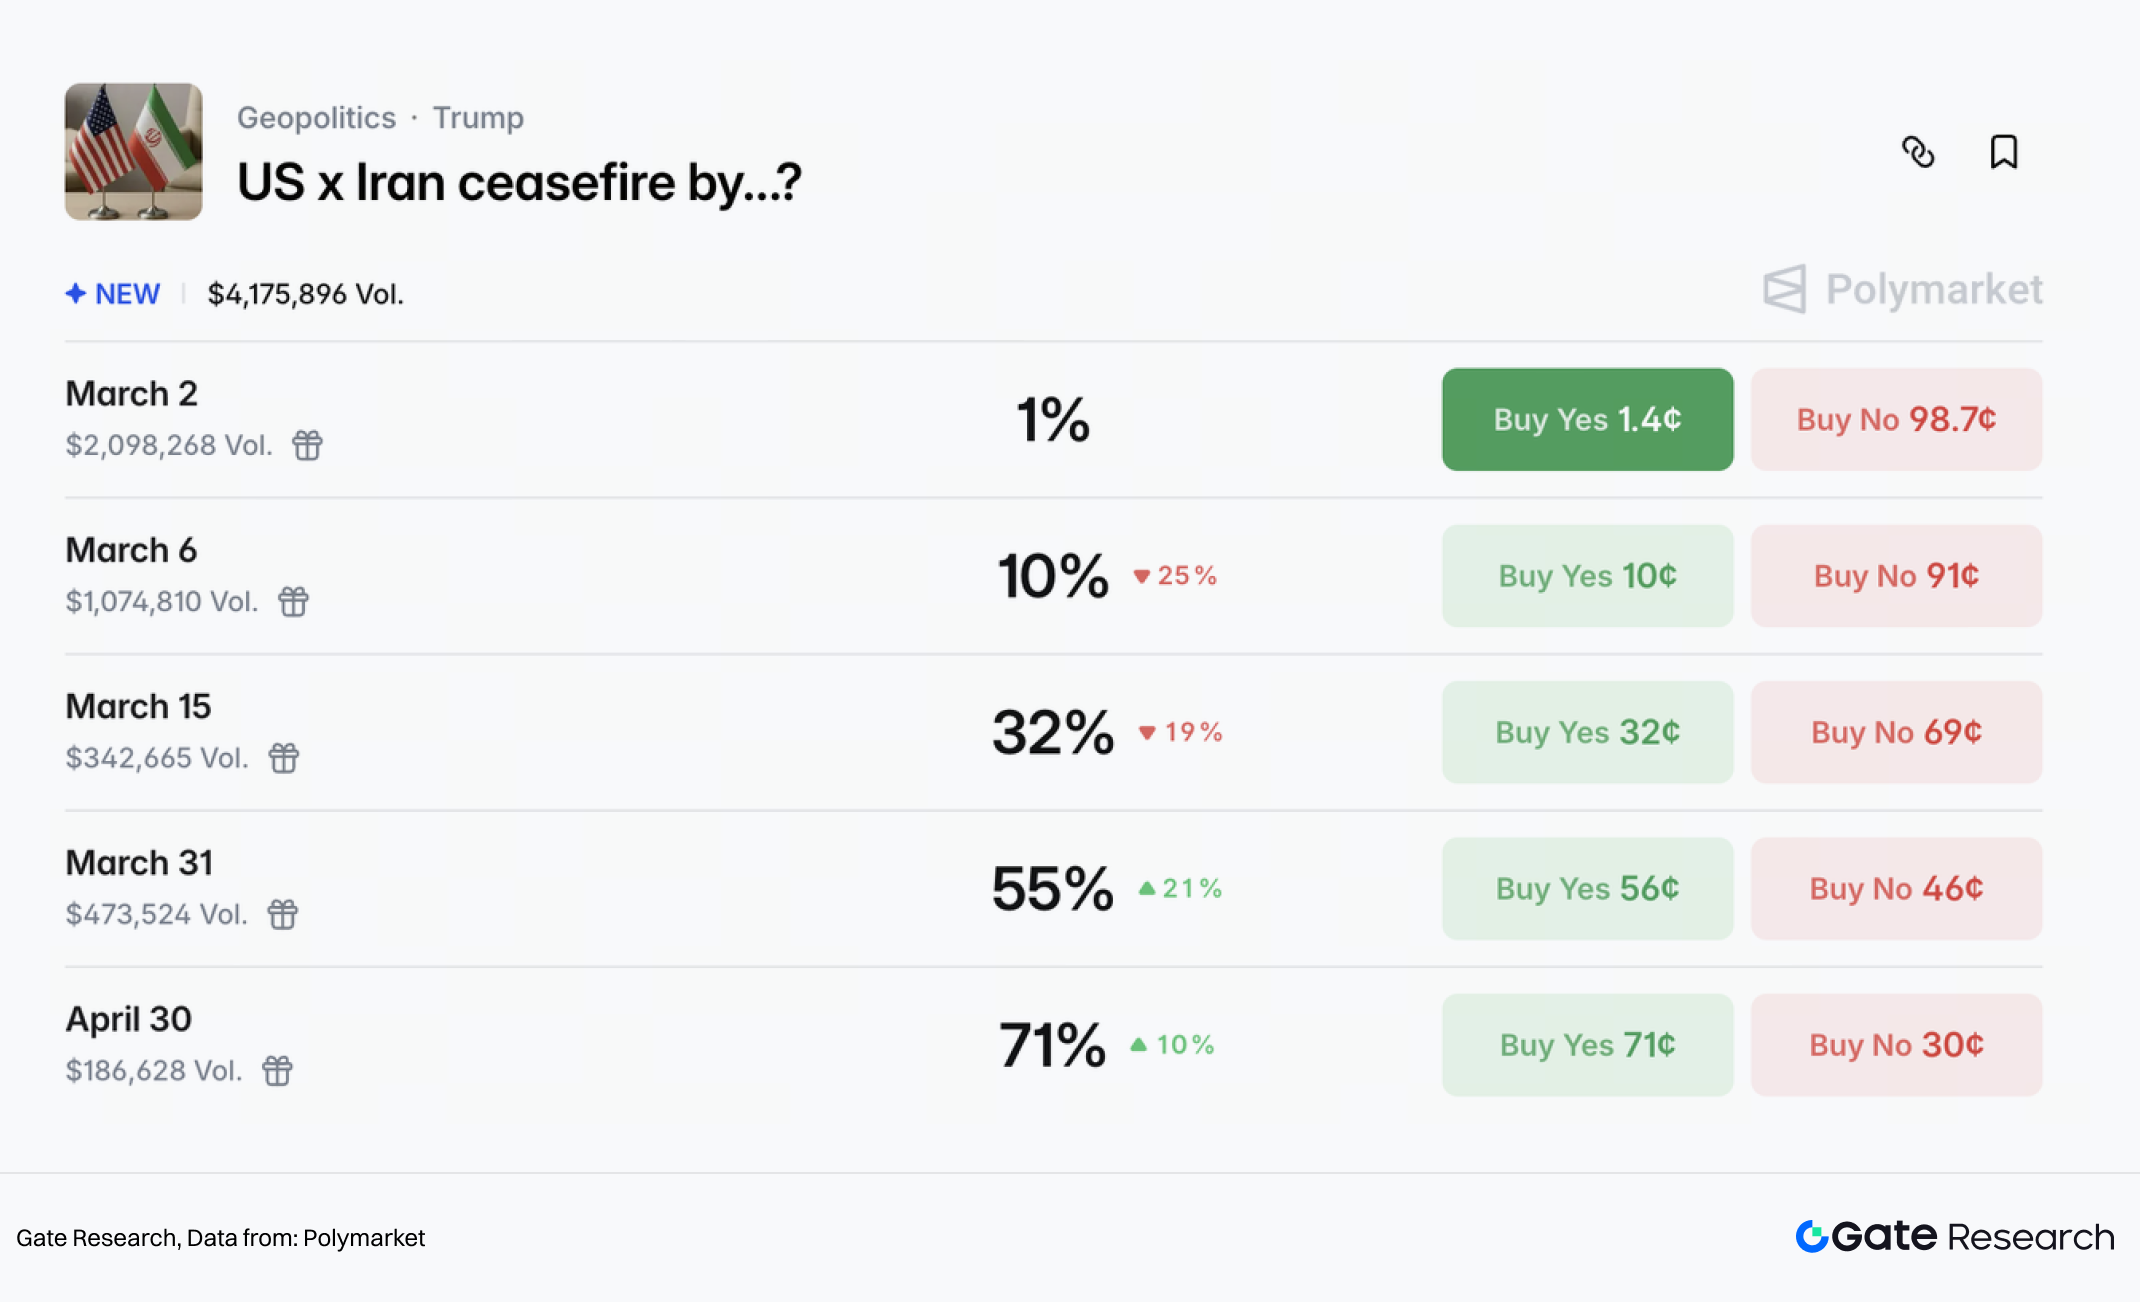
Taken together, these markets suggest that traders are betting the heat of the conflict will cool within a few weeks, but the formalization of a ceasefire is expected at a later date.
2.2.2 Asset Impact Projections
(1) Crude oil is the most direct geopolitical pricing asset
In this conflict, oil pricing reflects a combination of two layers:
- Geopolitical risk premium
- Supply and transportation disruptions
The former rises with escalation and increased shipping risk, while the latter depends on whether the Strait of Hormuz is restricted and whether oil and gas infrastructure is directly attacked. Only the second factor would likely push prices toward extreme right-tail outcomes.
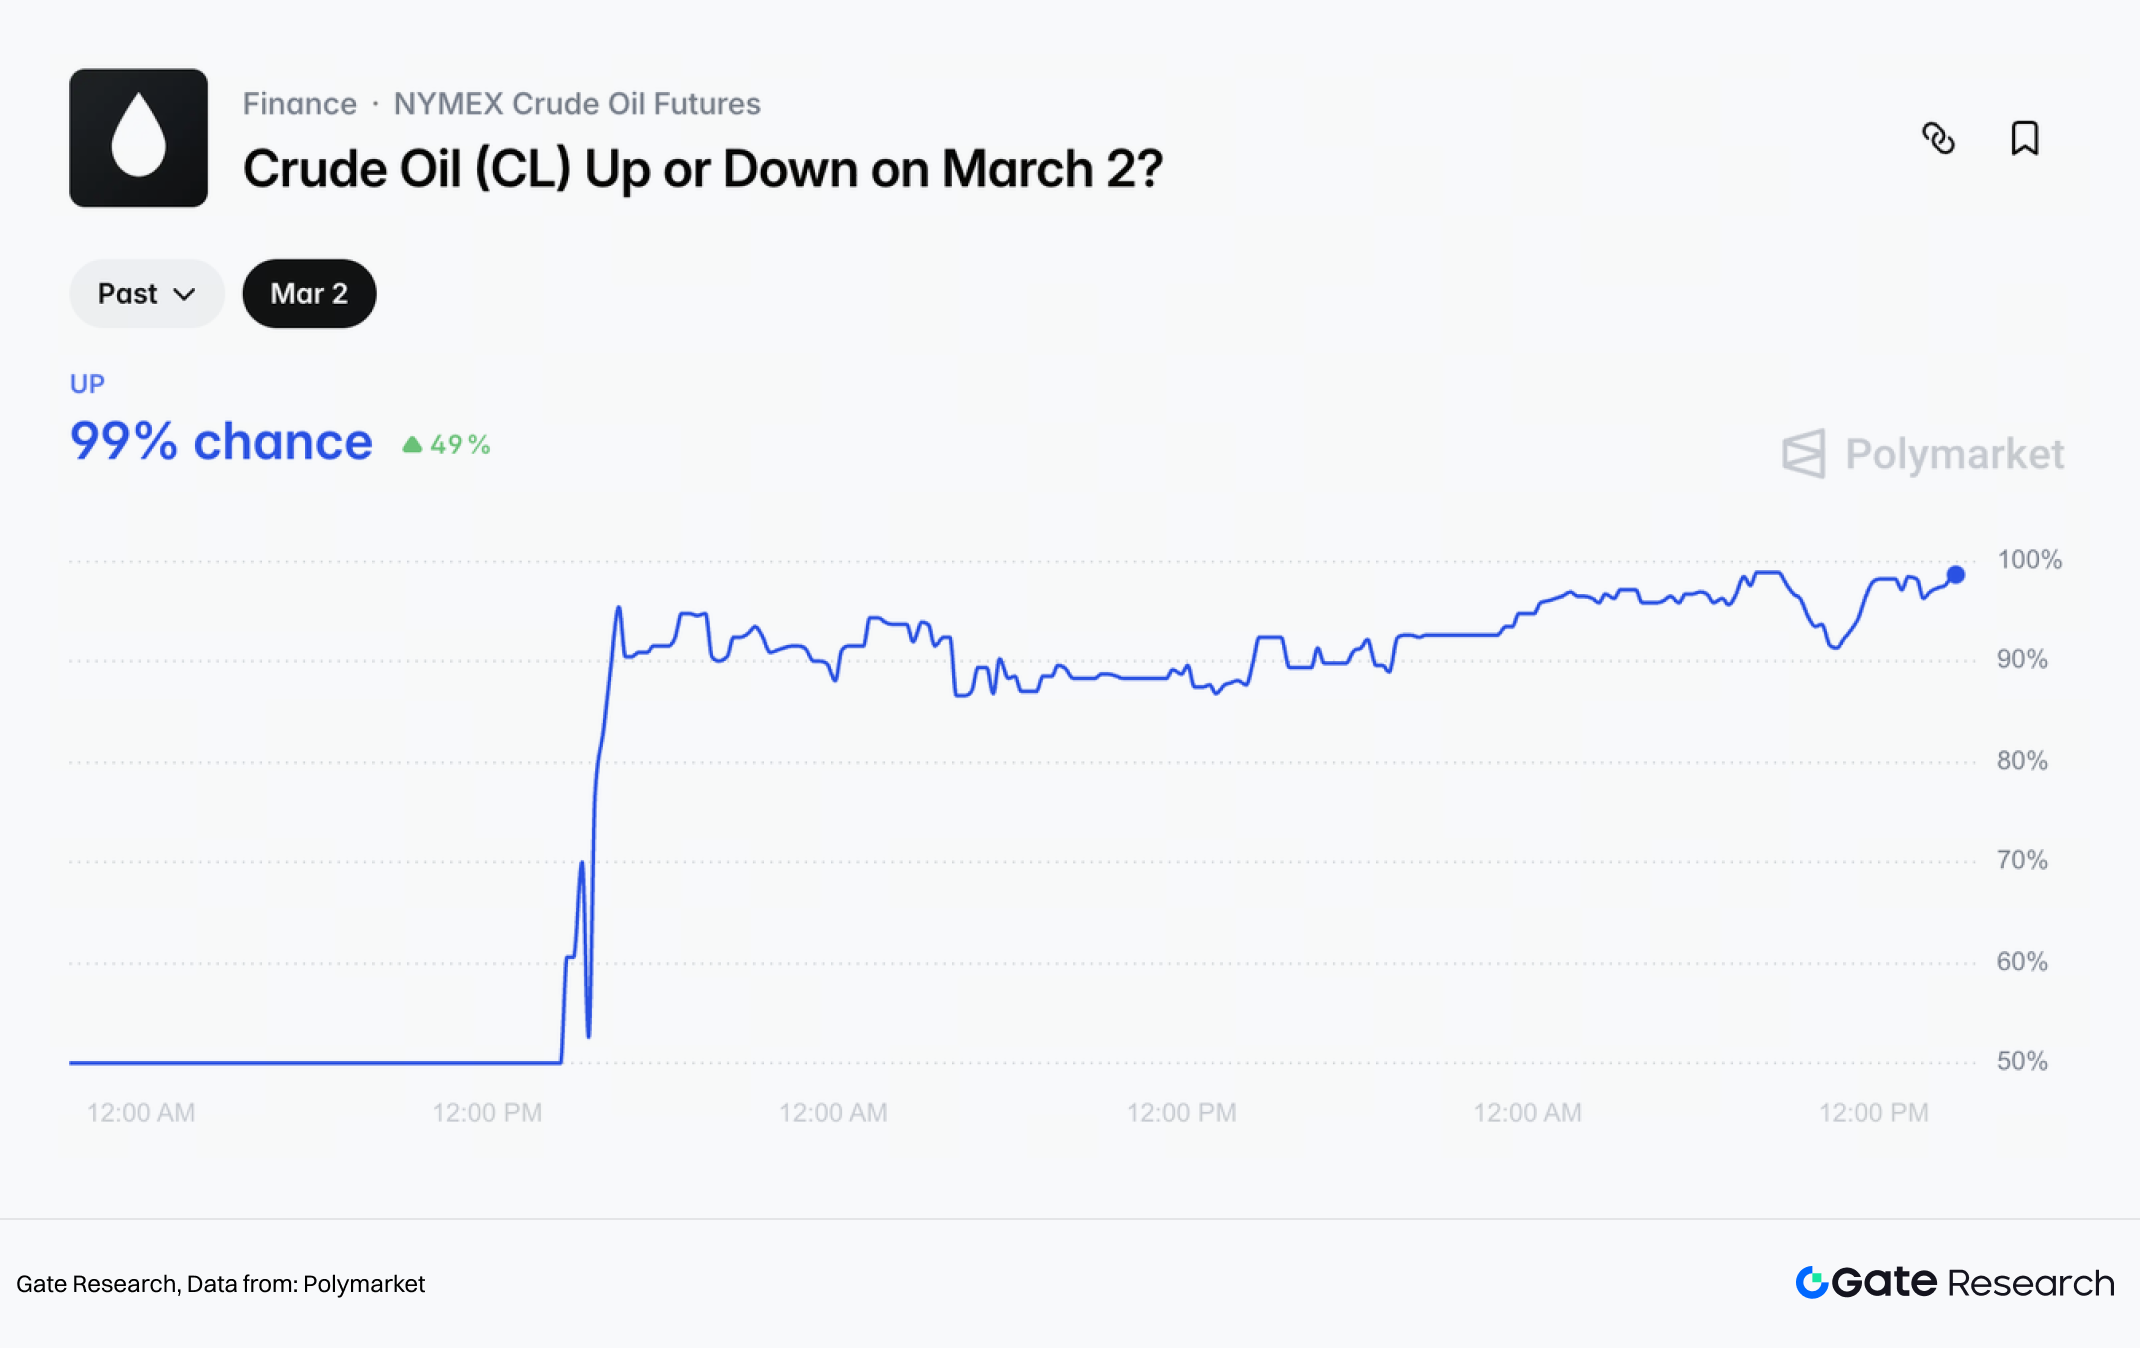
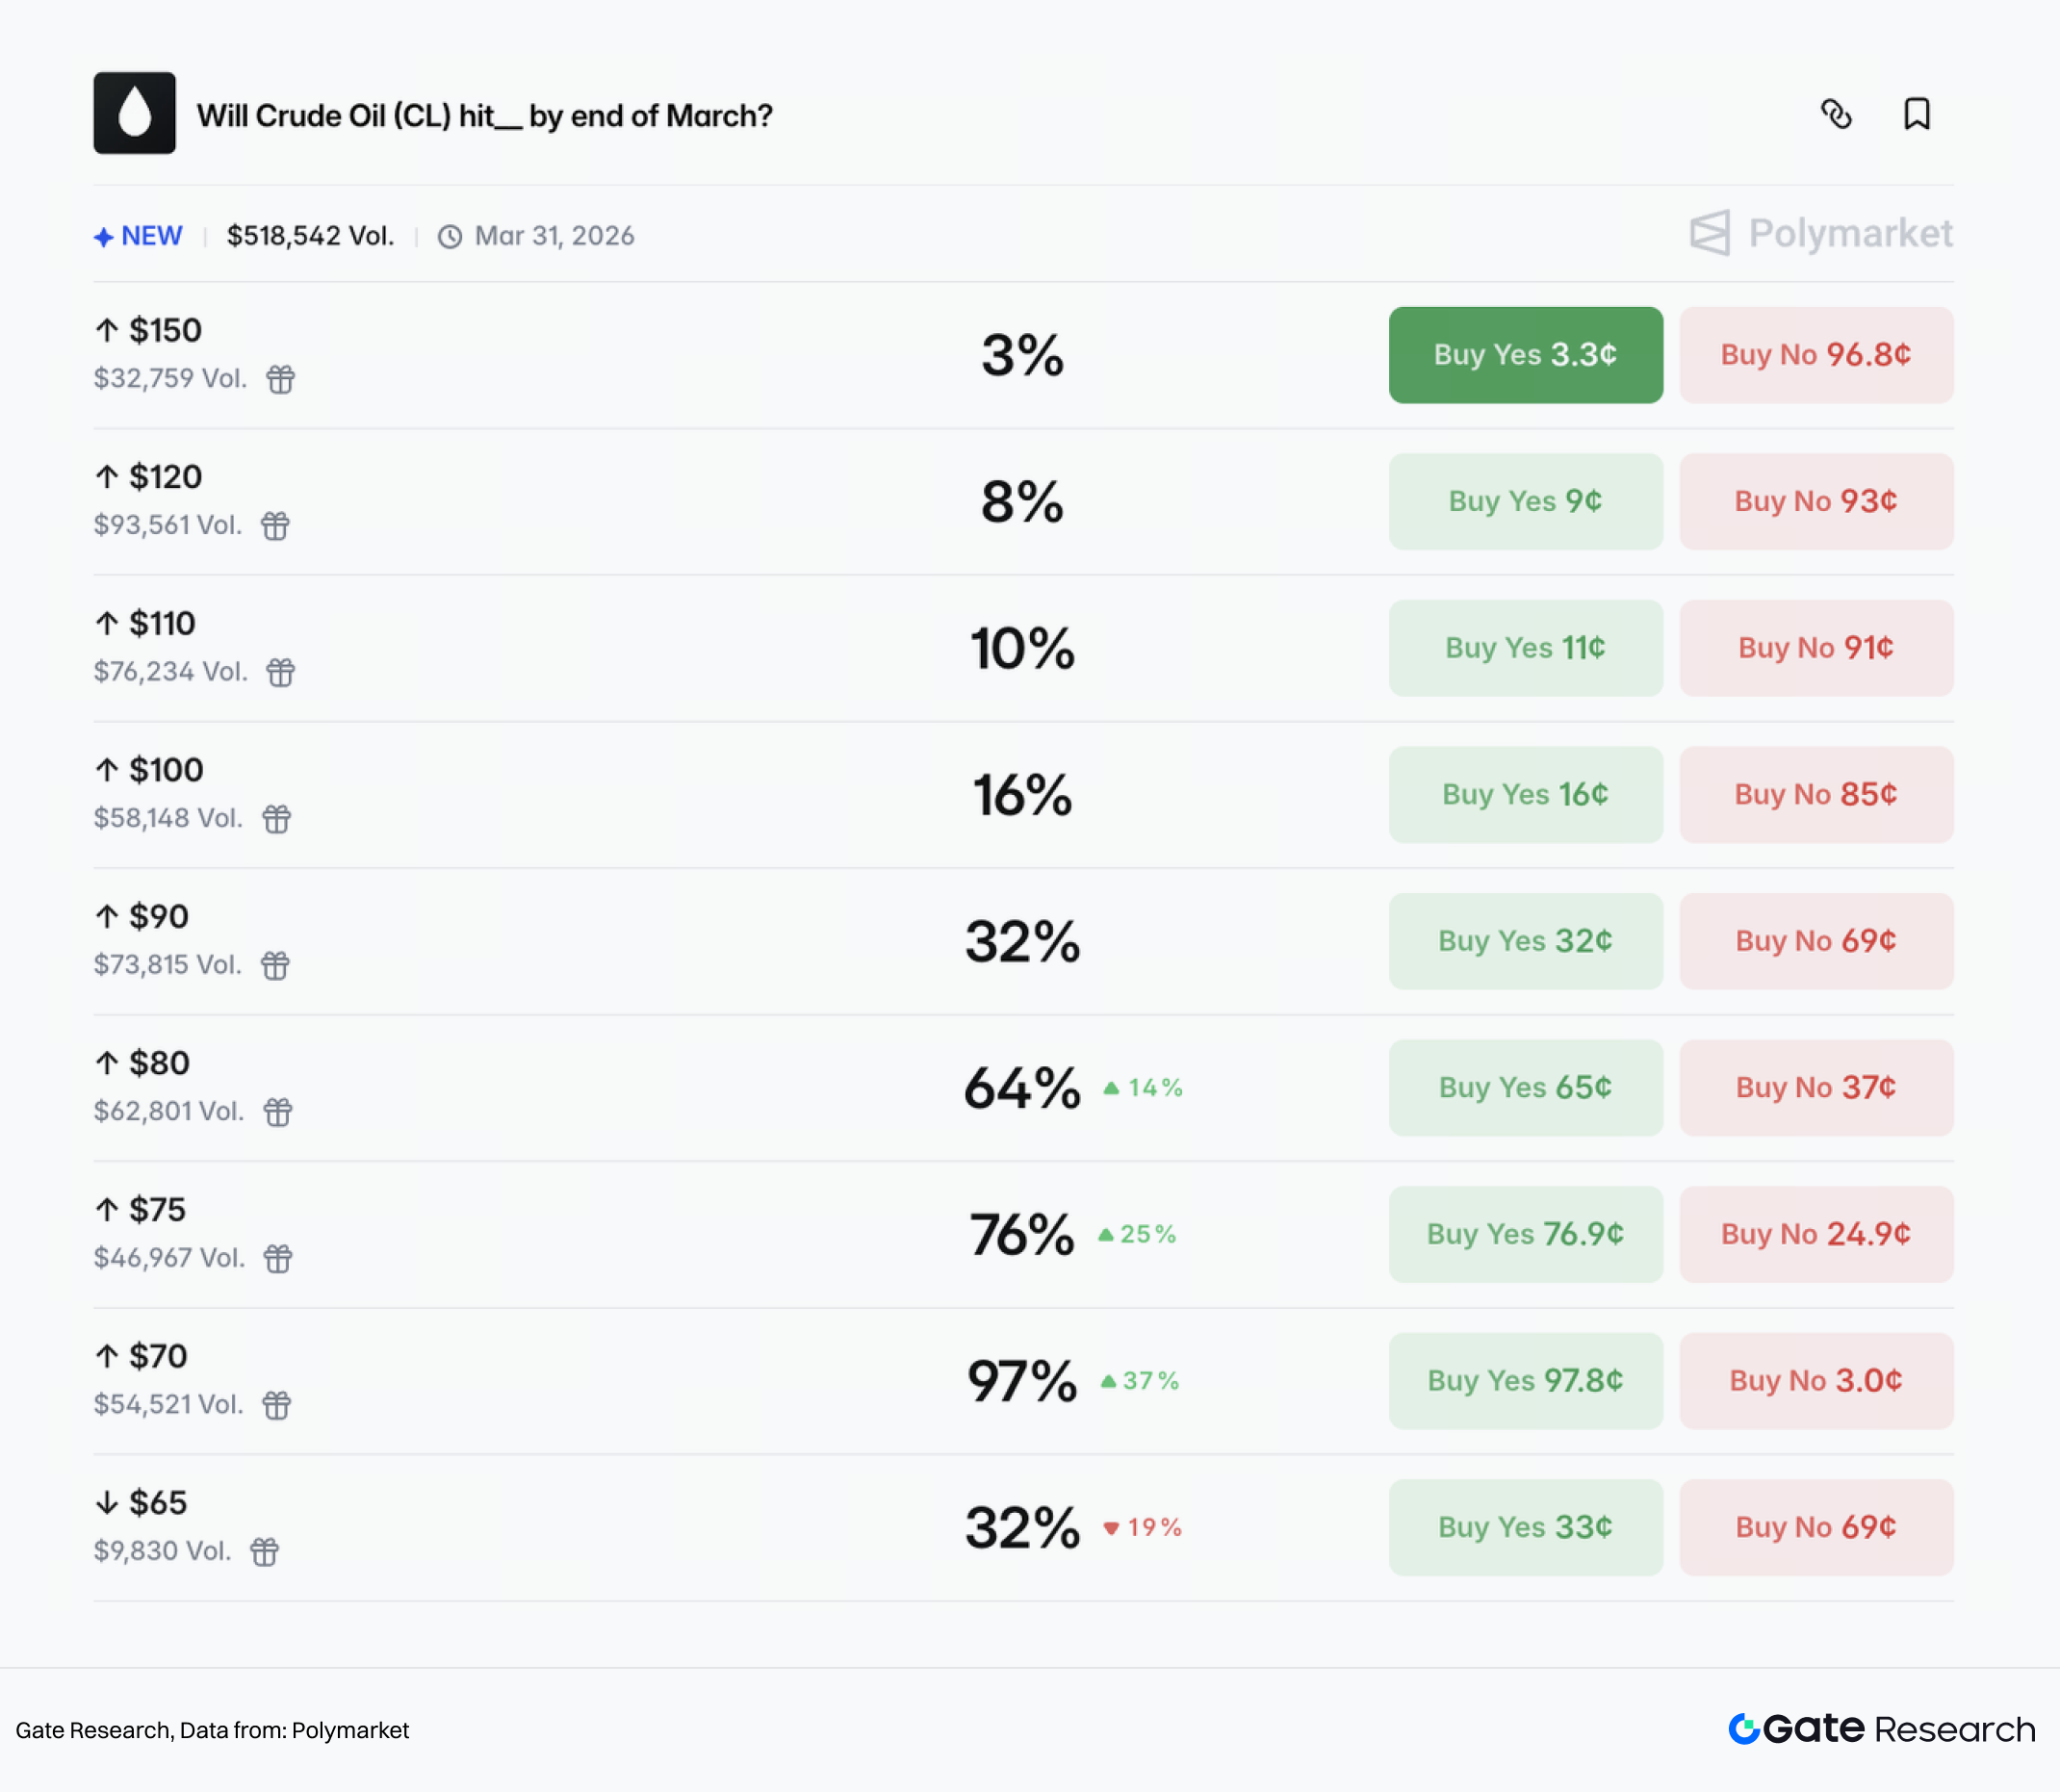
In the short term, the market consensus leans toward further oil price increases. Even without a total blockade, rising shipping, insurance, and rerouting costs could significantly elevate the short-term risk premium.
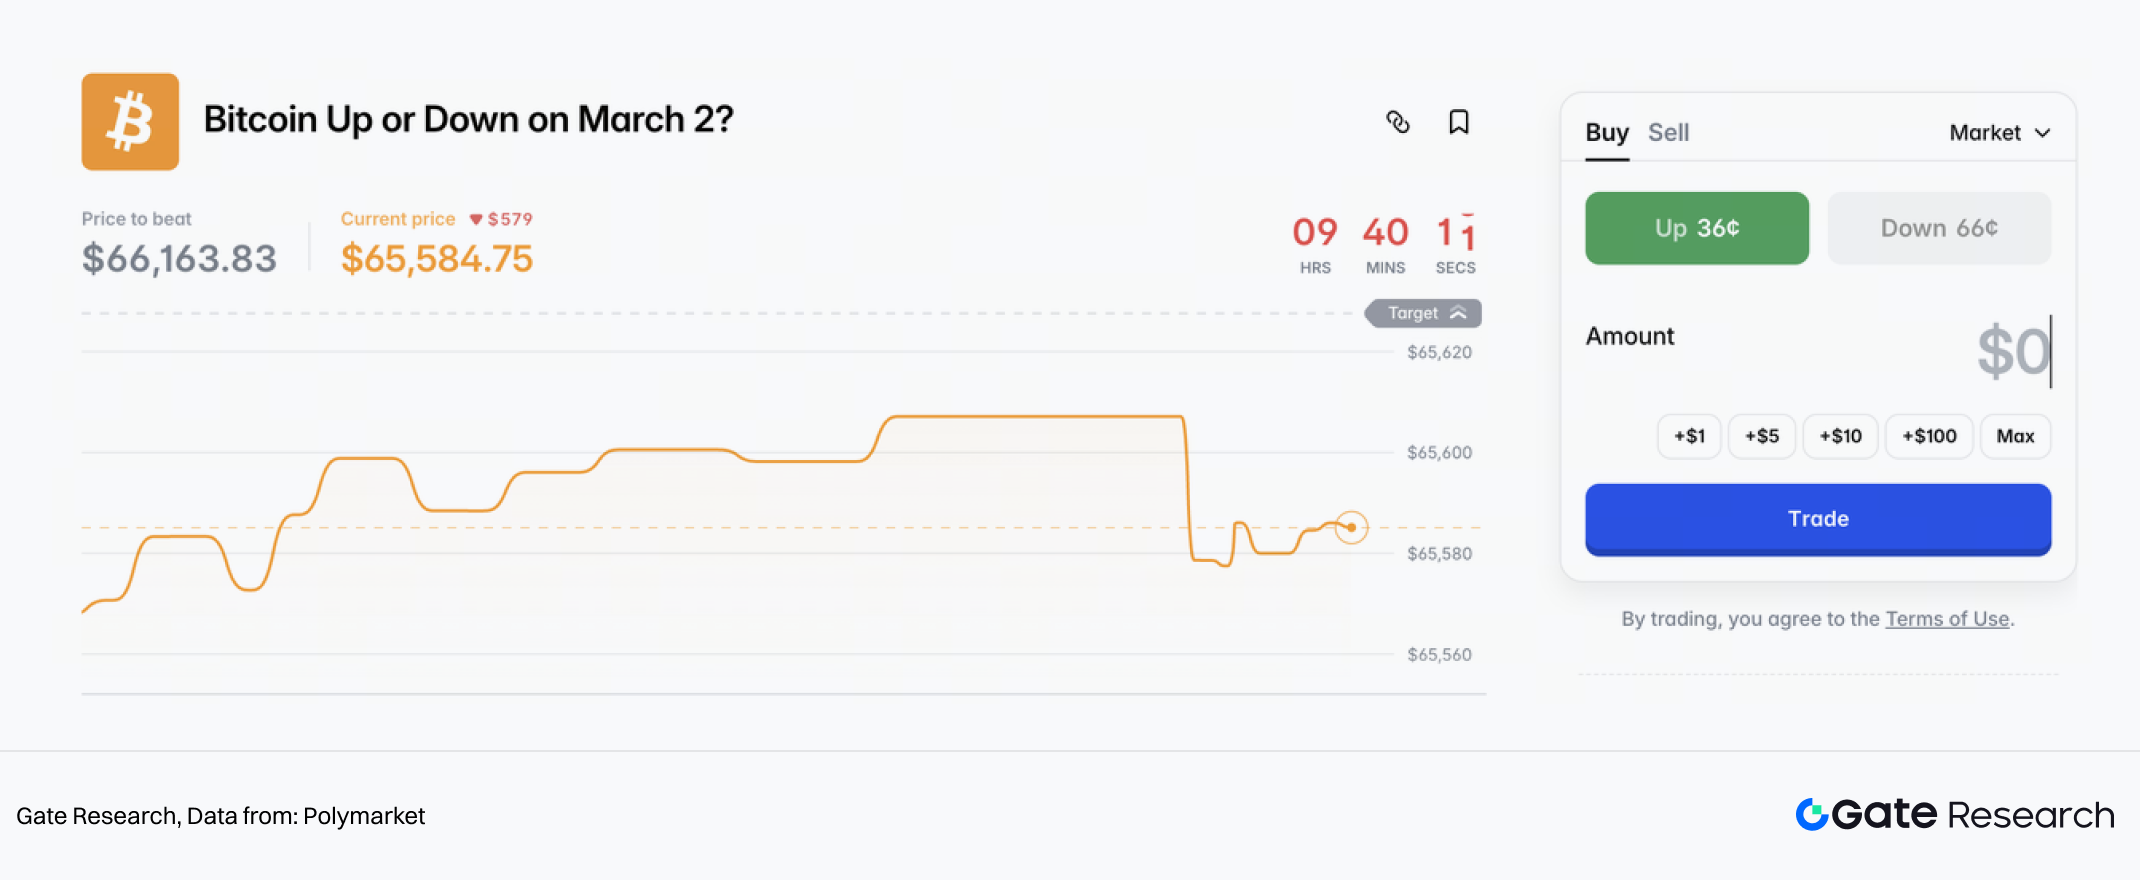
Polymarket assigns a 99% probability that crude oil rises on March 2. It also gives the following probabilities for oil reaching certain levels before the end of March:
- $80 → 64%
- $90 → 32%
- $100 → 16%
- $110 → 10%
(2) Gold benefits
When geopolitical risks rise and macro uncertainty increases, capital typically flows first into traditional safe-haven anchors such as gold. Following the escalation, spot gold has climbed to around $5,350 per ounce.
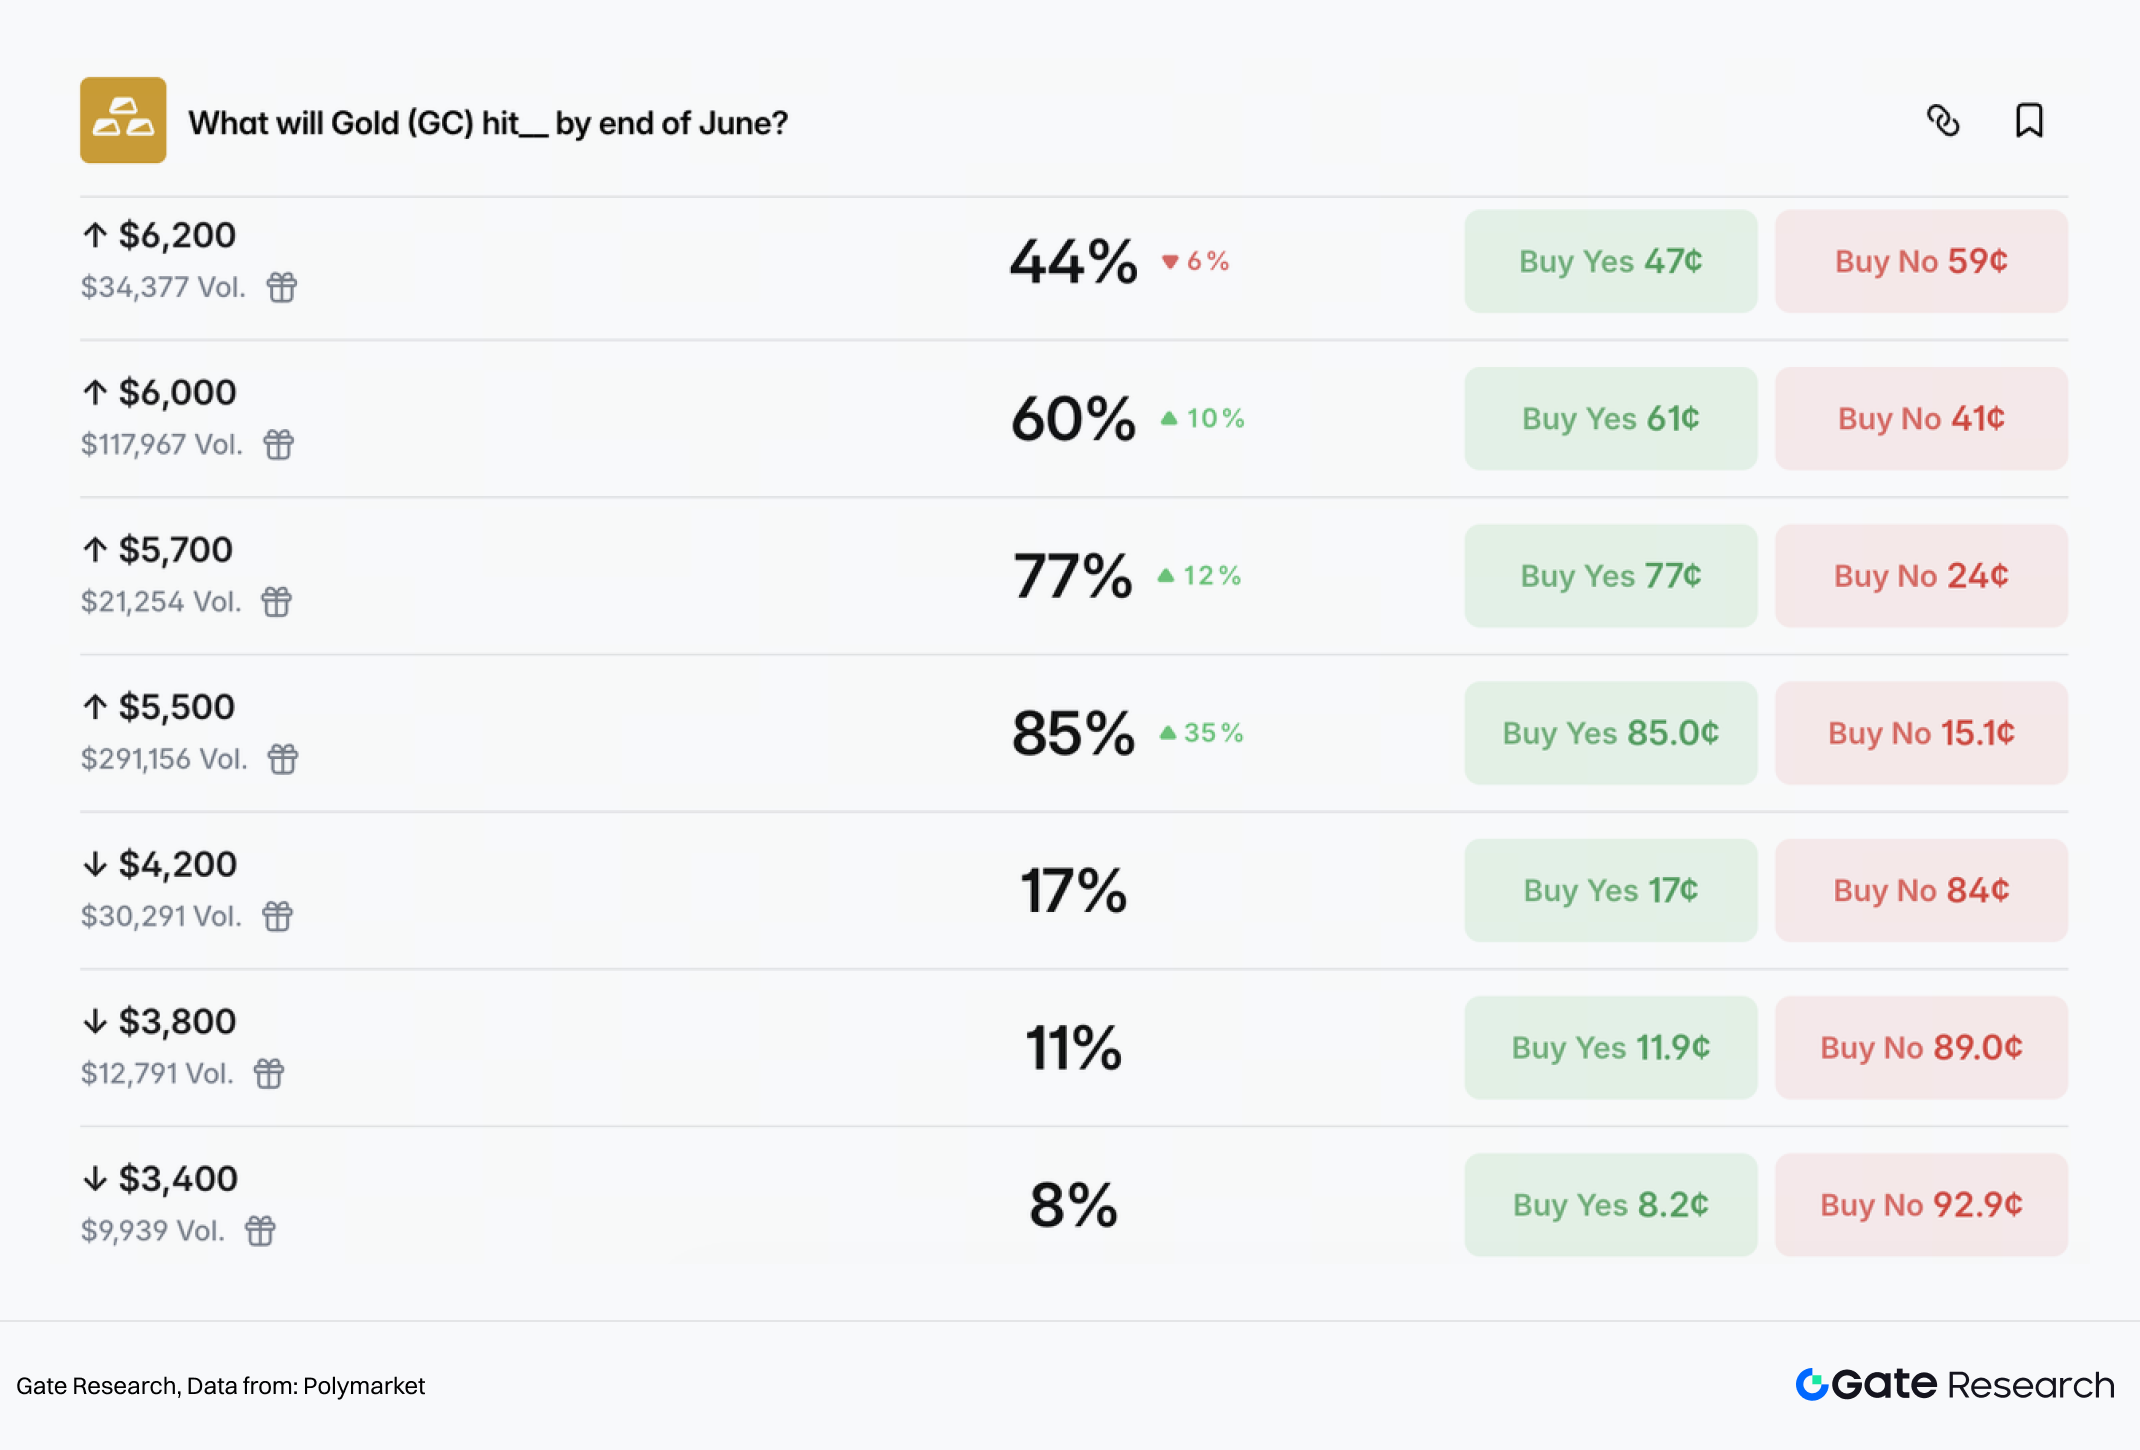
The market holds an optimistic medium- to long-term outlook for gold, assigning probabilities for reaching the following levels before the end of June:
- $5,500 → 85%
- $5,700 → 77%
- $6,000 → 60%
- $6,200 → 44%
In contrast, the probability of a decline to $4,200 or lower is priced at less than 20%.
For gold, the key question may not be whether it rises, but rather the structure of its upward momentum. If the conflict cools within weeks as prediction markets suggest, gold may transition into high-level consolidation. If Hormuz-related risks continue rising and drive oil-induced re-inflation, gold could receive a second wave of upside momentum driven by renewed inflation expectations and policy repricing.
(3) BTC behaves more like a risk asset in the short term
In geopolitical conflicts, BTC often follows a typical sequence: it is first priced as a risk asset, increased volatility triggers deleveraging, and only afterward does the market revisit the safe-haven narrative.
In short-term sentiment markets, Polymarket’s odds for BTC moving up or down on 3/2 show significantly higher uncertainty compared to oil and gold.
The Hormuz risk is a key inflection point for BTC’s medium- to short-term price dynamics. If risks continue rising, higher oil prices may revive discussions of re-inflation or a more hawkish rate path, potentially causing BTC to replicate a “pressure first, direction later” pattern.
The medium- to long-term divergence point lies in whether the conflict becomes prolonged. If, as markets expect, tensions cool within weeks and a formal ceasefire is reached shortly thereafter, BTC is more likely to revert to a trading framework driven by the U.S. dollar, liquidity conditions, and risk appetite.
However, if the situation evolves into a prolonged geopolitical standoff accompanied by sanctions, capital flow frictions, and fragmentation of payment systems, BTC may gain a stronger incremental narrative as an alternative safe-haven asset.
2.3 Overseas Political Assessment
In the short term, how might the U.S.–Iran conflict evolve? From the U.S. perspective, the successful implementation of a “decapitation strike” has materially strengthened its strategic position. Under the established principle of avoiding ground troop deployment and steering clear of an open-ended war, the “strike” phase of its “fight to negotiate” strategy is largely complete.
Should the conflict escalate further—resulting in a prolonged disruption of the Strait of Hormuz and a sharp surge in oil prices—the Federal Reserve could be compelled to adopt a more hawkish stance to contain inflation. This would not only weigh on the U.S. economy but also pose significant political risks for Trump ahead of the midterm elections. Conversely, a rapid compromise that fails to secure a more favorable nuclear agreement would likewise expose Trump to pressure from domestic hardliners. Balancing economic and political costs, a scenario of “controlled escalation followed by a limited resolution” appears to be the more realistic path.
The prevailing market view suggests that both sides are likely to contain the scale of confrontation, potentially replicating the pattern of the June 2025 Israel–Iran “Twelve-Day War”: primarily air-based strikes, avoidance of ground warfare, and mutual declarations of phased victory to consolidate domestic political support. The conflict is expected to ease within 2–3 weeks. As risk premiums recede, gold and crude oil prices may retrace from elevated levels, and safe-haven sentiment could gradually cool.
However, several key uncertainties remain:
- The possibility of a material blockade of the Strait of Hormuz.
The Strait accounts for roughly 20–30% of global seaborne crude oil shipments. Although shipping activity has reportedly slowed and Iranian officials have publicly stated no intention to close the Strait, any escalation resulting in an effective blockade would significantly increase the probability of Brent crude breaking above USD 100–110 per barrel in the short term.
The risk of U.S. involvement in ground warfare.
If the U.S. deploys ground troops—or is drawn into a prolonged conflict due to Israel’s hardline stance—the nature of the confrontation would fundamentally change. The U.S. would face dual pressures: first, surging oil prices could reignite inflation and force monetary tightening; second, sustained military engagement could strain fiscal resources and national strength, raising the risk of a protracted war of attrition similar to the Russia–Ukraine conflict.
Uncertainty surrounding Iran’s internal power structure.
The degree of control exercised by successor leadership over state institutions and the Islamic Revolutionary Guard Corps, as well as its policy stance toward the United States, remains uncertain. Whether the interim leadership council can effectively consolidate internal factions and prevent fragmentation within military forces will determine whether Iran moves toward a more militarized hardline regime or experiences internal instability under mounting domestic and external pressure—thereby influencing the likelihood of further escalation.
Overall, current market pricing is anchored in a “limited conflict” baseline scenario. However, tail risks have not been fully eliminated, and fluctuations in geopolitical risk premiums are likely to remain the key driver of asset prices in the coming weeks.
3. Potential Investment Opportunities
From a strategic perspective, overseas markets are likely to follow a “risk-off first, normalization later” trajectory in the short term, although medium- to long-term uncertainties remain unresolved. According to Bloomberg model estimates, crude oil prices have risen by approximately USD 11 per barrel year-to-date, with roughly USD 6 attributable to geopolitical risk premiums and USD 5 to improved demand fundamentals—indicating that risk premiums now account for a materially larger share of oil pricing.
Based on statements from Israeli officials, hostilities are expected to persist over the coming week, suggesting that safe-haven sentiment may remain elevated in the near term. In terms of asset performance, this environment favors gold, crude oil, and bonds, while posing headwinds for global equities.
If the conflict shows signs of easing within 2–3 weeks, risk premiums could gradually unwind. Oil prices may retreat toward the USD 60–70 range, while gold could pull back toward the USD 5,200 level. Nevertheless, continued structural demand from global central bank gold purchases should provide medium- to long-term downside support.
Over a longer horizon, both the frequency and intensity of geopolitical conflicts appear to be rising, while uncertainties surrounding energy security and fiat currency credibility persist. From a strategic asset allocation perspective, gold and crude oil retain attractive characteristics as inflation hedges and geopolitical risk buffers, supporting their role as core long-term holdings.
Gate has launched precious metals perpetual contracts such as XAUT/USDT, along with tokenized equities, index trading, and commodities trading segments. Through the Gate TradFi platform, investors can access 24/7 trading to respond swiftly to market developments and capture emerging opportunities.
References
Gate Research is a comprehensive blockchain and cryptocurrency research platform that provides deep content for readers, including technical analysis, market insights, industry research, trend forecasting, and macroeconomic policy analysis.
Disclaimer
Investing in cryptocurrency markets involves high risk. Users are advised to conduct their own research and fully understand the nature of the assets and products before making any investment decisions. Gate is not responsible for any losses or damages arising from such decisions.