The Nifty 50 is not only an important benchmark for domestic investors in India, but is also widely used by global ETFs, index funds, and institutional investors. Its calculation methodology directly affects index fund tracking efficiency, market representativeness, and the logic behind global capital allocation, making it one of the key pieces of infrastructure in India’s capital market.
What Is the Nifty 50 Index?
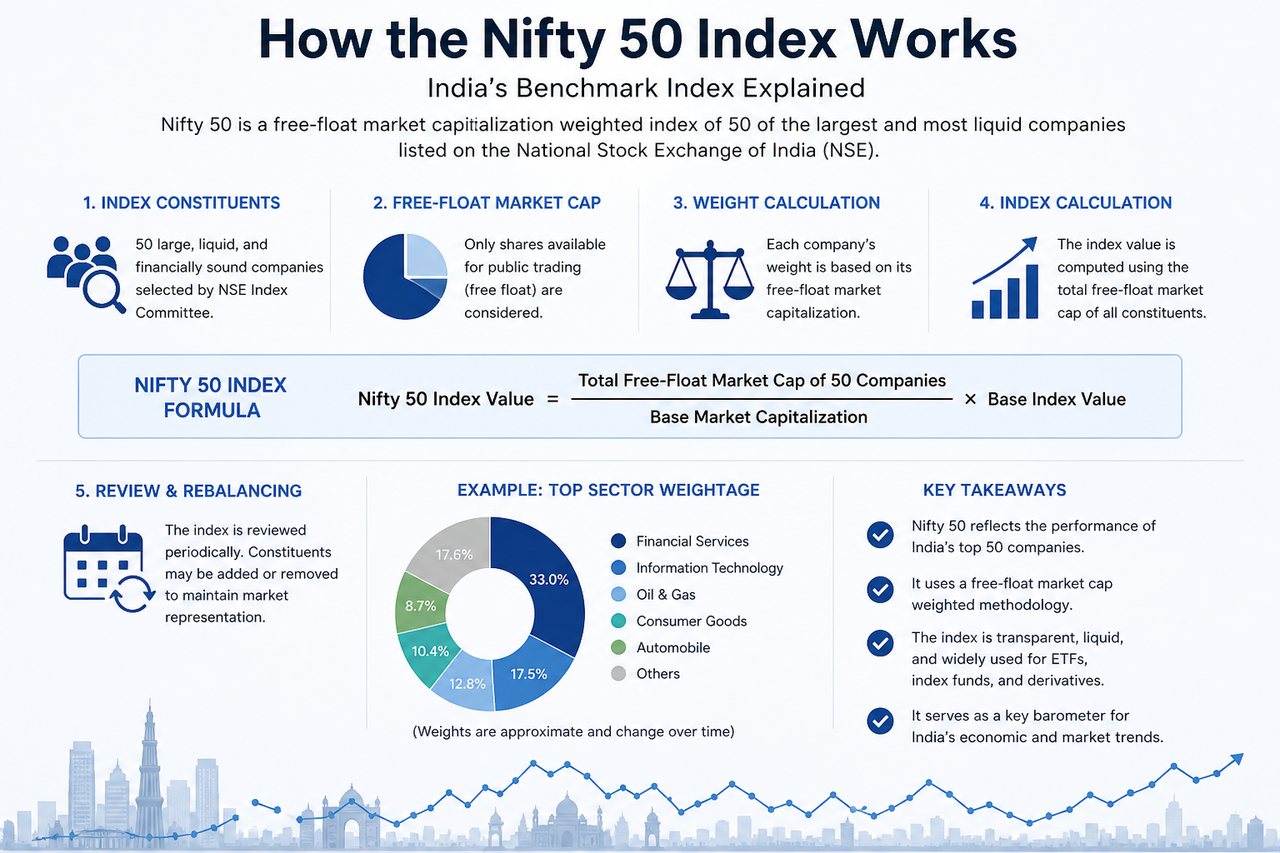
As a core stock index launched by the National Stock Exchange of India (NSE), the Nifty 50 covers 50 large blue chip listed companies in the Indian market. The index is widely used to reflect the overall performance of India’s capital market and serves as an important benchmark for ETFs, index funds, and derivatives products.
Unlike some traditional indices, the Nifty 50 does not simply track whether stock prices rise or fall. Instead, it uses a free float market capitalization weighted methodology. This means a company’s influence within the index is mainly determined by the value of its shares that are actually available for trading in the market.
Because the index covers several key sectors, including finance, technology, energy, consumption, and manufacturing, the Nifty 50 is also seen as an important window into India’s economic structure and industrial development trends.
What Is Free Float Market Capitalization?
Free float market capitalization is the core concept behind the Nifty 50’s calculation methodology. It refers to the portion of a company’s total market value that can genuinely be traded freely in the market.
For example, a company may have a high total market capitalization, but if a large portion of its shares is held by founders, the government, or long term strategic investors, its actual free float ratio will be lower. When calculating the Nifty 50, only the value of shares that can be freely traded in the market is considered.
Free float market capitalization is usually calculated as follows:
$$\text{Free Float Market Cap} = \text{Share Price} \times \text{Outstanding Shares} \times \text{Free Float Factor}$$
The main reason for using this methodology is that it more realistically reflects the amount of capital that can actually participate in market trading, while also reducing the excessive influence of controlling shareholders on index weights.
The overall value of the Nifty 50 is calculated based on the total free float market capitalization of all constituent stocks. The index starts from a fixed base value and is continuously updated as market conditions change.
Its core calculation logic is as follows:
$$\text{Nifty 50 Index Value} = \frac{\sum (\text{Free Float Market Cap of 50 Companies})}{\text{Base Market Capital}} \times \text{Base Index Value}$$
When the price of a constituent stock rises, its free float market capitalization increases, which pushes the index higher. Conversely, a decline in stock price can pull the index lower.
Because the index uses a market capitalization weighted methodology, price movements in larger companies usually have a greater impact on the index. For example, fluctuations in the share prices of Reliance Industries or HDFC Bank often affect the index more noticeably than movements in medium weight companies.
How Are Constituent Weights Assigned?
In the Nifty 50, not every company has the same influence on the index. The higher a company’s weight, the greater the impact of its share price movements on the index.
Weights are mainly determined by free float market capitalization, so large financial institutions and technology companies usually account for a higher proportion of the index. Companies such as HDFC Bank, Reliance Industries, and Infosys have long ranked among the index’s largest weights.
The weighting logic is as follows:
$$\text{Company Weight} = \frac{\text{Company Free Float Market Cap}}{\text{Total Free Float Market Cap of Index}$$
This structure means that even if some smaller constituents rise sharply, they may not significantly lift the overall index. By contrast, large companies with higher weights are more likely to influence the index’s direction.
How Are Nifty 50 Constituents Adjusted?
To maintain market representativeness, the Nifty 50 regularly adjusts and rebalances its constituents. The index committee usually reassesses company eligibility based on the following indicators:
-
Free float market capitalization
-
Stock liquidity
-
Average daily trading volume
-
Sector representation
-
Listing history and compliance status
If some companies experience a prolonged decline in market value or insufficient trading activity, they may be removed from the index. At the same time, emerging large companies may be added.
This dynamic adjustment mechanism helps the Nifty 50 continue to reflect changes in India’s economic structure. For example, as the digital economy and technology sector grow, some IT and internet related companies have also gained increasing influence within the index.
What Happens During Index Rebalancing?
When the index is rebalanced, ETFs, index funds, and quantitative institutions usually need to adjust their holdings at the same time to ensure their products continue to track the Nifty 50 accurately.
For example, if a company is added to the index, passive funds usually need to buy the corresponding stock. Companies removed from the index, on the other hand, may face selling pressure from passive capital. As a result, index adjustments can sometimes have a noticeable short term impact on the prices of related stocks.
Rebalancing can also change the sector weight structure. For example, a decline in the weight of financials or an increase in the weight of technology could affect the future direction of the index and its market risk profile.
How Is the Nifty 50 Different from a Price Weighted Index?
Some traditional indices use a price weighted methodology, such as the Dow Jones Industrial Average (DJIA). Under this model, the higher a company’s stock price, the greater its impact on the index.
The Nifty 50, by contrast, uses a free float market capitalization weighted methodology, so it focuses more on a company’s overall market size rather than simply the absolute level of its stock price.
| Comparison |
Free float market capitalization weighted |
Price weighted |
| Core basis |
Company market capitalization |
Stock price |
| Impact of large companies |
Higher |
Not necessarily |
| Market representativeness |
Relatively strong |
Relatively limited |
| Common indices |
Nifty 50, S&P 500 |
DJIA |
This design makes the Nifty 50 more suitable as a long term market benchmark and easier for ETFs and index funds to replicate.
Conclusion
The Nifty 50’s core calculation logic is built on a free float market capitalization weighted methodology. Changes in the index are shaped not only by stock prices, but also by free float ratios, company weights, and sector structure.
Through regular constituent adjustments and rebalancing, the Nifty 50 is able to maintain its representativeness of India’s large listed companies and serve as an important benchmark for ETFs, index funds, and derivatives markets.
FAQs
How Is the Nifty 50 Calculated?
The Nifty 50 uses a free float market capitalization weighted methodology and is calculated based on the total free float market capitalization of its 50 constituent stocks.
What Is Free Float Market Capitalization?
Free float market capitalization refers to the market value of shares that can actually be traded in the market. It excludes shares held by the government, founders, or long term strategic holders.
Why Do Large Companies Have a Greater Impact on the Nifty 50?
Because the index uses a market capitalization weighted methodology, share price movements of large companies with higher weights have a more noticeable impact on index performance.
Is the Nifty 50 Adjusted Regularly?
Yes. The index committee regularly adjusts constituents based on market capitalization, liquidity, and sector representation.
How Is the Nifty 50 Different from the Dow Jones Index in Calculation Method?
The Nifty 50 uses free float market capitalization weighting, while the Dow Jones Industrial Average uses a price weighted methodology.
Why Do ETFs Care About How the Nifty 50 Is Calculated?
Because a transparent and stable calculation methodology can reduce tracking error and improve the efficiency of index fund replication.