This comparison focuses on how Ichimoku Cloud and SuperTrend differ in calculation, signal design, trend identification, swing-trading entries, stop and exit management, behavior in sideways markets, and whether they work better alone or together. For traders refining entry timing, trend assessment, and risk control, that distinction matters because the indicator you choose can materially change trade selection, exit discipline, and overall decision quality.
TL;DR
-
Ichimoku Cloud provides broader market context through five components that evaluate trend direction, momentum, equilibrium, and potential support or resistance.
-
SuperTrend produces simpler signals by plotting an Average True Range-based line above or below price.
-
Ichimoku Cloud is more suitable for structured trend analysis, while SuperTrend is easier to apply to rule-based entries and trailing exits.
-
SuperTrend can react more directly to volatility, but it may switch repeatedly during sideways conditions.
-
Neither indicator guarantees accurate signals, and both should be assessed alongside price structure, liquidity, volatility, and risk controls.
| Comparison area |
Ichimoku Cloud |
SuperTrend |
| Primary purpose |
Complete trend and market-structure analysis |
Direct trend confirmation |
| Main calculation |
Multiple price midpoints across several periods |
Average True Range and multiplier |
| Signal style |
Multi-condition and contextual |
Bullish or bearish state |
| Support and resistance |
Cloud, Tenkan-sen, and Kijun-sen |
One volatility-adjusted line |
| Chart complexity |
Higher |
Lower |
| Entry approach |
Layered confirmation |
Direct trend flip |
| Exit approach |
Several possible invalidation levels |
Clear trailing line |
| Main weakness |
More complex and sometimes slower |
Vulnerable to repeated flips in ranges |
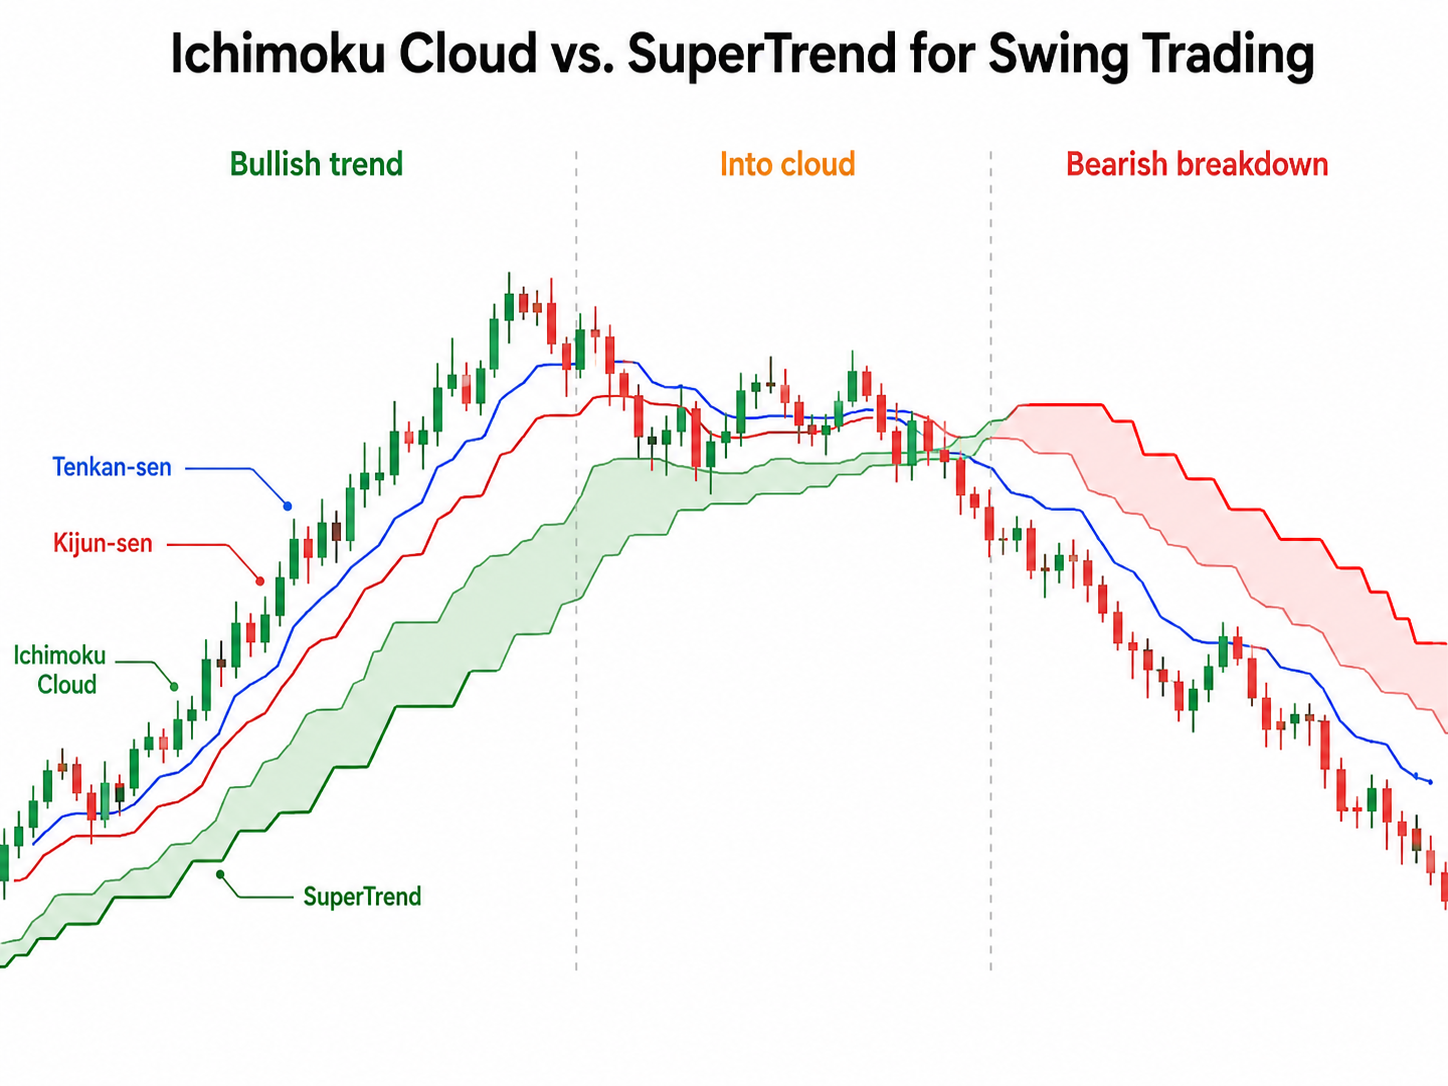
The main difference is not simply signal speed. Ichimoku Cloud describes the strength and structure of a trend, while SuperTrend converts price volatility into a more direct directional signal.
What Is the Ichimoku Cloud Indicator?
The Ichimoku Cloud, formally called Ichimoku Kinko Hyo, is a multi-component technical analysis tool that evaluates trend direction, momentum, market equilibrium, and potential support or resistance levels. It uses five plotted components rather than relying on a single moving line.
The main components are:
-
Tenkan-sen: The conversion line, a shorter-period midpoint that reacts relatively quickly to price.
-
Kijun-sen: The base line, or Kijun-sen line, a longer-period midpoint that reflects broader equilibrium.
-
Senkou Span A: One boundary of the projected cloud.
-
Senkou Span B: The second cloud boundary, calculated over a longer period.
-
Chikou Span: Current price plotted backward to compare present price with earlier market structure.
The indicator consists of five lines and a shaded area. The area between Senkou Span A and Senkou Span B forms the Kumo Cloud; these are the leading span components, including Leading span B, and the cloud is projected 26 periods into the future for support and resistance levels. Price above the cloud generally supports a bullish signal, while price below the cloud supports a bearish interpretation. Price inside the cloud often suggests consolidation, transition, or uncertainty.
The complete explanation of the Ichimoku Cloud indicator shows how its five components work together. Developed in the late 1930s and designed to help traders assess the market trend at a single glance, it is useful for identifying trends, spotting potential trading signals, and filtering false breakouts before deciding whether a trend is sufficiently established.
What Is the SuperTrend Indicator?
SuperTrend is a trend-following indicator used in trading strategies across different time frames that uses Average True Range to adjust its distance from price according to market volatility, and it was created by Olivier Seban in 2009. It normally appears as a single line that moves above or below the price chart.
A SuperTrend line below price generally indicates a bullish trend state. A line above price usually signals a bearish state. These bullish and bearish states are often shown with color-coded signals, where a green line indicates an uptrend and a red line indicates a downtrend. When price crosses the relevant volatility-adjusted band, the indicator changes sides and creates a potential trend-reversal, trend-confirmation, or sell signals setup.
The SuperTrend indicator is visually simpler than Ichimoku Cloud because traders do not need to interpret several lines and relationships. However, that simplicity means SuperTrend provides less information about momentum structure, consolidation, and layered support or resistance.
The ATR multiplier has a major effect on signal behaviour. A lower multiplier places the line closer to price and produces faster but potentially noisier signals. A higher multiplier places the line farther from price, reducing signal frequency while allowing more room for ordinary market volatility. The default ATR setting is typically between 7 and 13 periods, and traders often pair it with other technical indicators or other tools as part of broader analysis to avoid false signals.
Ichimoku Cloud vs. SuperTrend: How Do Their Signals and False Signals Differ?
Ichimoku Cloud produces contextual signals, while SuperTrend produces a clearer directional state. Both are used for identifying trends and reading the broader market trend. Ichimoku signals become stronger or weaker depending on how several components align. SuperTrend generally remains bullish or bearish until price crosses its active band.
For example, price may remain above a bullish SuperTrend line while entering the Ichimoku Cloud. SuperTrend still classifies the market as bullish, but Ichimoku indicates that the trend has moved into an uncertain or transitional area and can filter market noise better than a single-line indicator in that phase.
The opposite can also happen. Price may break above the cloud while SuperTrend remains bearish because the ATR-based line is still above price. In that situation, Ichimoku may identify an improving structure first, and a cloud break can function as a kumo breakout that creates potential trading signals before SuperTrend confirms the directional change.
| Market condition |
Ichimoku Cloud response |
SuperTrend response |
| Early bullish development |
Tenkan-sen may cross above Kijun-sen |
Remains bearish until price crosses the band |
| Established uptrend |
Price stays above a rising cloud |
Line remains below price |
| Pullback |
Kijun-sen or cloud may provide support |
Active line provides one trailing level |
| Consolidation |
Price moves inside or around the cloud |
Indicator may flip repeatedly |
| Sharp reversal |
Components weaken in stages |
A strong move can produce a direct flip |
Ichimoku therefore shows how trend conditions are changing, while SuperTrend identifies when its selected volatility threshold has been crossed.
Ichimoku Cloud vs. SuperTrend Indicator: Which Indicator Identifies Trends More Effectively?
Ichimoku Cloud generally provides a more complete trend assessment because it combines direction, momentum, and market structure, and it tends to work best in trending markets, where its layered structure can confirm trend quality. A bullish trend appears stronger when price remains above a rising cloud, the Tenkan-sen stays above the Kijun-sen, and the Chikou Span remains above earlier price action.
SuperTrend identifies trend direction more simply. Price above a bullish line suggests that buyers retain control relative to the chosen ATR period and multiplier, which can make it effective for long positions when price continues to hold above the active line. However, SuperTrend does not independently show whether a trend is mature, accelerating, weakening, or supported across several calculation periods.
A Moving Average Ribbon offers another approach to trend-strength analysis by examining the alignment, slope, and separation of several moving averages.
Ichimoku is generally more suitable when the trader wants to classify the quality of a trend. SuperTrend is more suitable when the main requirement is a clear bullish or bearish filter, though it is less reliable in ranging markets because repeated flips can weaken its directional value.
Ichimoku Cloud vs. SuperTrend Indicator: Which Indicator Is Better for Swing-Trading Entries?
SuperTrend is easier to apply to rule-based entries, while Ichimoku Cloud can produce more selective entry conditions. A trader may define a SuperTrend entry as a bearish-to-bullish flip supported by a breakout, higher-time-frame trend, or rising volume. In practice, many traders treat these as actionable trading signals, though they still confirm them with other tools before opening long positions.
Ichimoku entries normally require more interpretation. A bullish setup may include price moving above the cloud, the tenkan sen line crossing above the kijun sen line, with the kijun sen line acting as the base line, and the Chikou Span clearing earlier price action. These additional conditions may reduce weak setups, but they can also delay entry.
A bullish signal can also appear when price breaks above the cloud, especially if the current price holds above projected support.
Pullback strategies also differ. Ichimoku traders can monitor the Tenkan-sen, Kijun-sen, or cloud boundary as dynamic reaction zones. These reference zones can help define clearer entry and exit points. SuperTrend traders usually work with one active line. The EMA 20 indicator may provide an additional short-term pullback reference when the SuperTrend line is positioned far from price.
Ichimoku Cloud may suit traders who:
-
Prefer several forms of confirmation
-
Evaluate trend structure before entering
-
Use dynamic zones rather than one exact line
-
Accept later signals for additional context
SuperTrend may suit traders who:
-
Prefer simple and repeatable entry rules
-
Need a direct bullish or bearish signal
-
Want a less crowded chart
-
Adjust signals according to changing volatility
Ichimoku Cloud vs. SuperTrend Indicator: Which Indicator Is Better for Stops and Exits?
SuperTrend is generally more practical for trailing exits because its line moves with price and volatility. During a bullish trend, the rising line below price can act as a dynamic invalidation level and is often used to place a stop loss that trails as volatility changes. A bearish flip may then indicate that the previous trend condition has ended.
Ichimoku Cloud provides several possible exit references. A trader may respond when price closes below the Tenkan-sen, loses the Kijun-sen, enters the cloud, or breaks completely below the cloud. These levels can also help define exit points and stop-loss placement depending on whether the trader uses the Tenkan-sen, Kijun-sen, or cloud boundary. Each method reflects a different tolerance for temporary weakness.
This flexibility gives Ichimoku traders more control, but it also introduces discretion. SuperTrend creates a more consistent exit rule, and its active side can function like an upper band in a downtrend or a lower band in an uptrend, although a sudden volatility increase can trigger an early exit before the broader trend resumes.
The Parabolic SAR vs. SuperTrend comparison demonstrates how acceleration-based and volatility-based trailing indicators can produce different exit timing.
Neither Ichimoku Cloud nor SuperTrend performs consistently in persistent sideways markets or ranging markets. Ichimoku may produce repeated line crossings while price moves through a flat cloud. SuperTrend may switch between bullish and bearish states as small price movements repeatedly cross its bands.
Ichimoku provides a clearer visual warning when price remains inside a narrow or flat cloud. SuperTrend does not have a neutral state, so it normally continues to display either bullish or bearish conditions even when no durable trend exists. These conditions increase the odds of false signals and make both indicators less useful for reliable trading signals.
The ADX indicator, or Average Directional Index, can help evaluate whether a trend has enough strength to justify following an Ichimoku breakout or SuperTrend flip. Low or declining ADX values may indicate that the market remains range-bound, while stronger readings can help confirm whether a breakout has enough strength to avoid false signals.
Can Ichimoku Cloud and SuperTrend Be Used Together?
Ichimoku Cloud and SuperTrend can be combined when each indicator has a clearly defined role. Ichimoku can identify the broader trend structure, while SuperTrend can provide immediate directional confirmation or a trailing exit. Used this way, the pair can improve trading strategies by separating market-structure analysis from execution signals.
One possible process is:
-
Confirm that price is above a rising Ichimoku Cloud.
-
Check that the Tenkan-sen is above the Kijun-sen.
-
Wait for SuperTrend to appear below price or switch bullish.
-
Place a stop loss around SuperTrend, the Kijun-sen, or recent price structure.
-
Avoid the trade when price is moving inside a flat cloud.
Bollinger Bands can be one of the other technical indicators used to confirm volatility and reduce false entries.
Some traders also review the same setup on an hourly chart for tighter entry and exit timing.
Using both indicators may reduce contradictory trades, but it can also increase lag because both depend on historical price data. Agreement between the indicators improves confirmation within a chosen strategy, but it does not guarantee continued price movement. Combined well, they can support practical financial goals only when risk controls remain defined.
Conclusion
Ichimoku Cloud is generally the stronger choice for swing traders who need a detailed view of trend direction, momentum, market equilibrium, and dynamic support or resistance. SuperTrend is more suitable for traders who prioritise direct volatility-adjusted signals, simple execution rules, and practical trailing exits.
The better indicator ultimately depends on the trading process. Ichimoku Cloud supports deeper market interpretation, while SuperTrend supports faster decision-making and clearer trend-state changes. Some traders may use Ichimoku to filter market conditions and SuperTrend to manage entries or exits, while others may prefer one indicator to avoid duplicated signals and chart clutter.
Neither tool should be treated as a standalone prediction system. Both indicators use historical price information and may react late, generate false signals, or perform poorly during sideways conditions. Swing-trading decisions should also consider price structure, liquidity, volatility, position sizing, and predefined risk limits.
Technical indicators do not guarantee profitable trades or accurately predict every reversal. Cryptocurrency and financial markets can be highly volatile, and this material is provided for educational purposes rather than financial advice.
FAQ
Is Ichimoku Cloud better than SuperTrend?
Ichimoku Cloud is better for detailed trend and market-structure analysis, while SuperTrend is better for simple directional signals and trailing exits. The more appropriate indicator depends on the trader’s strategy, preferred level of complexity, and whether they want a complete technical analysis tool or a simpler directional filter.
Is SuperTrend suitable for swing trading?
SuperTrend can support swing trading by identifying trend direction and providing a volatility-adjusted trailing level. It generally performs better in sustained directional markets, making it more effective in trending markets than in ranging markets.
Which indicator gives faster signals?
SuperTrend often gives clearer and more direct signal changes, although speed depends on the ATR period and multiplier. Ichimoku signals may develop gradually as its different components move into alignment.
Can Ichimoku Cloud and SuperTrend predict reversals?
Neither indicator predicts reversals with certainty, and both can still produce false breakouts or delayed reversals in weak market conditions. Ichimoku can reveal weakening trend structure, while SuperTrend confirms that price has crossed a volatility-adjusted threshold.
Should traders change the default settings?
Indicator settings may be adjusted for the asset, timeframe, trading approach, and should be tested across different time frames rather than one chart interval, but excessive modification can create overfitting. Alternative settings should be tested across several market conditions rather than selected from one successful historical example.







