The difference between technical indicators like MACD and ADX, matters because price often moves quickly, produces false breakouts, and changes character in a short period of time. A market may be rising but weak, or falling with unusual strength, and traders need a way to separate those conditions. MACD and ADX differences make it easier to read charts with more context and less guesswork.
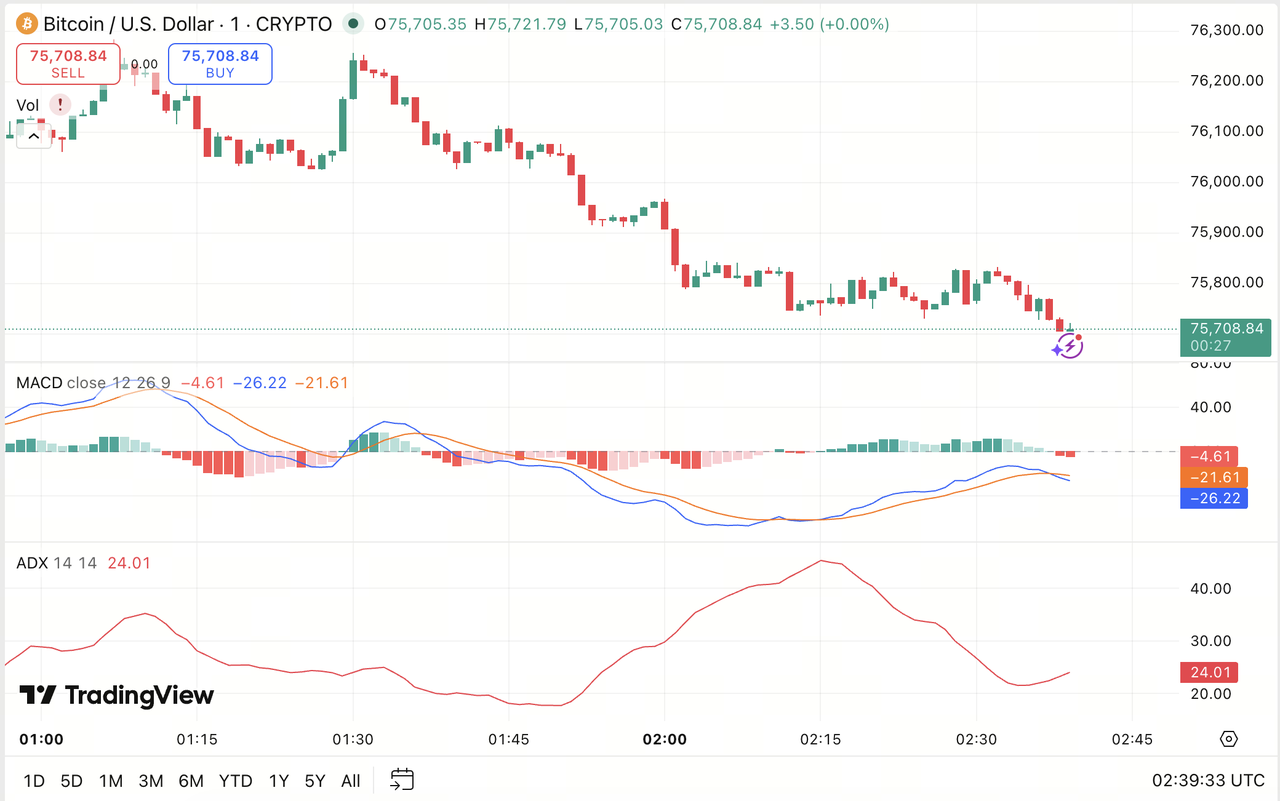
Source: TradingView
What Is MACD?
MACD, short for Moving Average Convergence Divergence, is a momentum indicator that helps traders evaluate the direction and speed of price movement. It belongs to the family of trend-following indicators, but it is mainly used to spot shifts in momentum and possible changes in trend.
In practical terms, MACD compares two moving averages and shows whether short-term price action is pulling away from or moving back toward the broader trend. When momentum improves, MACD tends to rise. When momentum fades, it tends to fall.
Traders often use MACD for three reasons. First, it helps identify whether bullish or bearish momentum is building. Second, it can show when momentum is weakening before price fully turns. Third, it provides visual signals through crossovers and histogram changes, which makes it easier for beginners to interpret.
A common way to read MACD is simple: above the centerline often suggests upward momentum, below it often suggests downward momentum, and a crossover between the MACD line and the signal line may hint at a momentum shift.
What Is ADX?
ADX, or Average Directional Index, is a trend-strength indicator used to measure how strong a market trend is. Unlike MACD, it does not primarily tell traders whether the trend is up or down. Its main job is to answer a narrower but important question: is the trend meaningful, or is the market just drifting sideways?
ADX is part of the Directional Movement System. In chart reading, traders often view it alongside the positive directional line and the negative directional line, which help suggest whether buyers or sellers are more dominant. The ADX line itself, however, is focused on strength rather than direction.
This makes ADX especially useful in crypto markets, where traders often mistake volatility for trend quality. A market can move sharply for a short period and still lack a sustained trend. ADX helps filter those situations by showing whether trend strength is expanding or fading.
A rising ADX generally suggests that a trend is becoming stronger. A falling ADX often suggests the trend is losing force or that the market is entering a more range-bound phase. That is why many traders use ADX not as a standalone entry tool, but as a filter for other signals.
What Is the Core Difference Between MACD and ADX?
The core difference is straightforward: MACD helps show trend direction and momentum, while ADX shows trend strength.
That means MACD is more useful when a trader wants to know which side currently has momentum. ADX is more useful when a trader wants to know whether the current move has enough strength to trust.
This distinction becomes clearer in practice:
| Indicator |
Main Purpose |
What It Tells You |
Best Use Case |
Common Limitation |
| MACD |
Measure momentum and directional bias |
Whether bullish or bearish momentum is increasing or weakening |
Spotting momentum shifts, crossovers, and possible reversals |
Can produce false signals in choppy markets |
| ADX |
Measure trend strength |
Whether a trend is strong, weak, strengthening, or fading |
Confirming whether trend-following strategies make sense |
Does not clearly show direction on its own |
A simple way to think about it is this: MACD answers “which way is momentum leaning?” ADX answers “does this move have real strength behind it?”
Because they answer different questions, traders often combine them. For example, a bullish MACD crossover may look more useful when ADX is also rising, because that suggests both direction and strength are lining up.
How Do Their Underlying Mechanisms Differ?
MACD and ADX also differ in how they generate signals.
MACD works by comparing faster and slower moving averages. When the shorter-term average pulls away from the longer-term one, momentum appears to be accelerating. When the gap narrows, momentum may fade. This is why MACD often reacts to shifts in price speed and can help flag possible reversals before they become obvious on the chart.
ADX works differently. Instead of tracking momentum through average comparison, it evaluates directional movement and then smooths that information into a single trend-strength reading. The result is less about turning points and more about market conditions.
In practical chart analysis, this creates a very different feel:
-
MACD is more reactive. It often responds faster to momentum changes.
-
ADX is more selective. It is less about early signals and more about trend quality.
-
MACD emphasizes timing. Traders use it to spot entries, exits, and crossovers.
-
ADX emphasizes the environment. Traders use it to judge whether trend-based signals deserve attention.
This is why MACD may turn before ADX does. A market can begin to shift direction, and MACD may reflect that early. ADX may lag because it needs enough movement to confirm that the new trend is gaining force.
That lag is not necessarily a weakness. In many cases, it is exactly what makes ADX useful. It helps traders avoid reacting too quickly to every burst of price movement.
When Should Traders Use MACD vs ADX?
Traders should use MACD when they want to read momentum, identify directional bias, or spot possible turning points. It is often helpful when the market is beginning to move out of a range or when a trader is looking for confirmation that bullish or bearish momentum is changing.
ADX is more useful when the trader wants to judge whether the market is trending strongly enough for a trend-following setup. In crypto, this matters because many breakouts fail quickly. A rising ADX can help confirm that the market is not only moving, but moving with growing strength.
A practical way to use them is to separate their roles:
For example, suppose Bitcoin breaks upward and MACD turns bullish. That may suggest improving upside momentum. But if ADX stays low or starts falling, the move may lack strength and could turn into a false breakout. On the other hand, if MACD turns bullish while ADX rises, the setup may have better structural support.
Beginners often get better results when they avoid forcing either tool to do everything. MACD is not the best pure strength filter. ADX is not the best standalone direction signal. They work better when each is used for its natural purpose.
How Do Their Limitations Compare?
Neither indicator is perfect, and both have clear limitations.
MACD can become unreliable in sideways or highly erratic markets. In those conditions, line crossovers may happen frequently without leading to sustained price movement. This creates whipsaw signals, which can frustrate beginners who expect every crossover to produce a trend.
ADX has a different limitation. Because it focuses on strength, it may confirm a trend only after a sizable move has already started. That means traders may enter later than they would with faster indicators. It can also remain elevated during strong trends even when the move is becoming overstretched, so it should not be treated as a simple buy-or-sell trigger.
Their weaknesses can be summarized this way:
-
MACD may be early, but noisy
-
ADX may be reliable, but slower
There is also a common misunderstanding with ADX: a high ADX does not automatically mean price is going up. It only means the trend, whether upward or downward, is strong. Likewise, a bullish-looking MACD signal does not guarantee that a real trend will follow. It only shows that momentum conditions have shifted.
For that reason, traders often use both indicators with price structure, support and resistance, or volume context rather than relying on either one alone.
Conclusion
MACD and ADX are not rival indicators so much as different tools for different questions. MACD is designed to help traders read momentum and likely direction. ADX is designed to show whether the market is trending with enough strength to make that direction meaningful.
In crypto trading, where false moves and sudden volatility are common, that distinction can improve chart interpretation. MACD can help a trader notice when momentum is changing. ADX can help confirm whether the move has enough force to matter. When used together, they provide a more balanced view of trend behavior: one looks at direction, the other looks at strength.
FAQs
Is MACD better than ADX?
Neither is universally better. MACD is more useful for reading momentum and possible direction changes, while ADX is more useful for measuring trend strength.
Can MACD and ADX be used together?
Yes. Many traders combine them because they measure different things. MACD can suggest directional momentum, and ADX can confirm whether the trend is strong enough to support the setup.
Does ADX show whether the market is bullish or bearish?
Not by itself. ADX mainly shows how strong a trend is. Traders usually look at the directional lines or price action to determine whether the trend is upward or downward.
Why does MACD give false signals in crypto?
Crypto markets can be highly volatile and choppy. In ranging conditions, MACD crossovers may appear often without leading to sustained moves.
Is ADX better for trending markets?
Yes. ADX is most useful when traders need to determine whether a market is actually trending rather than moving sideways with random volatility.