In crypto markets, where prices often swing sharply within short timeframes, traders use moving averages to filter out erratic price action and focus on the general direction of movement. Moving Average has become a common part of technical indicators for chart analysis because they help frame trend, momentum, and market structure in a way that is easy to read.
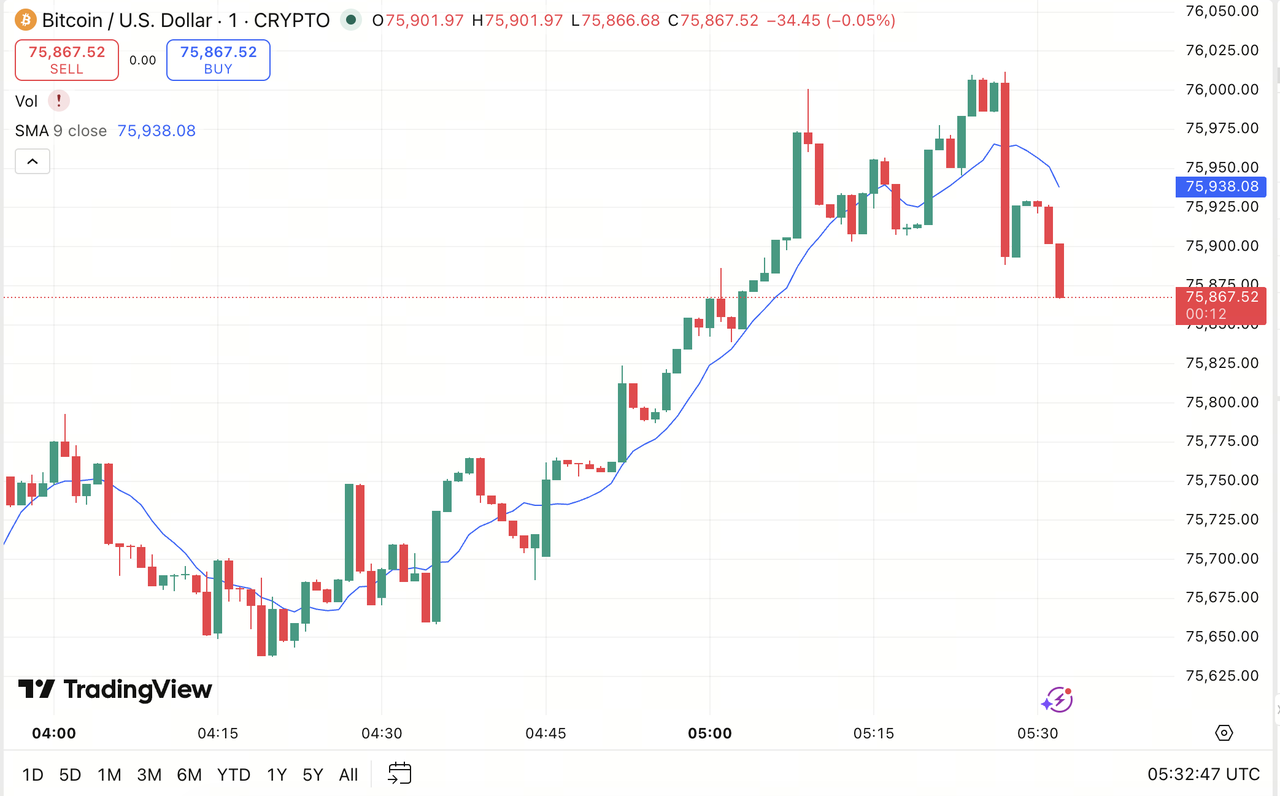
Source: TradingView
What a Moving Average Is
On a price chart, a moving average appears as a line that reflects an asset’s average price over a selected time period.
Its main purpose is simple: smooth the chart so traders can see direction more clearly. Instead of reacting to every short candle or sudden spike, a moving average creates a cleaner view of whether price is generally rising, falling, or moving sideways.
In crypto trading, this matters because market noise is constant. Bitcoin, Ether, and many altcoins can move sharply within hours, often creating false impressions of breakout or reversal. A moving average helps reduce that noise by averaging recent prices into a single flowing line.
It belongs to the broader category of trend-following indicators. That means it does not predict the future on its own. Instead, it reacts to what price has already done and helps traders interpret the current structure of the market.
A moving average can serve several practical roles:
-
showing whether the market is broadly bullish or bearish
-
acting as a visual trend guide
-
helping spot pullback areas
-
supporting confirmation when used with price action, volume, or market structure
Main Types of Moving Averages
Not all moving averages behave the same way. The main difference is how much weight they give to recent prices.
Simple Moving Average (SMA)
The Simple Moving Average takes the average closing price over a selected number of periods and gives each period equal weight. A 20-day SMA, for example, treats each of those 20 daily closes the same.
Because it uses equal weight, the SMA tends to move more slowly. Traders often use it when they want a cleaner view of the broader trend without reacting too quickly to short-term volatility.
Exponential Moving Average (EMA)
The Exponential Moving Average gives more weight to recent prices. That makes it respond faster when price changes direction.
In crypto, many short-term traders prefer the EMA because the market can shift rapidly. A faster-moving line can reflect momentum changes earlier, though that also means it may react to temporary noise more often.
Weighted Moving Average (WMA)
The Weighted Moving Average also emphasizes recent data, but it does so through a fixed weighting method rather than the exponential method used by the EMA.
It is less commonly discussed than SMA or EMA in beginner trading education, but some traders use it when they want a balance between sensitivity and structured weighting.
Smoothed or Variant Averages
Some platforms also offer smoothed averages and hybrid versions. These are designed to reduce noise even further or adapt to changing market conditions.
For most beginners, however, the practical starting point is understanding SMA and EMA, since these are the most widely used on crypto charts.
| Moving Average Type |
How It Treats Price Data |
Speed of Reaction |
Common Use in Crypto |
| SMA |
Equal weight to all periods |
Slower |
Broader trend direction |
| EMA |
More weight on recent prices |
Faster |
Short-term momentum and trend shifts |
| WMA |
Heavier recent weighting by formula |
Medium to fast |
Alternative trend reading |
| Smoothed variants |
Reduce short-term fluctuation further |
Slower |
Noise reduction in choppy charts |
How Moving Average Periods Affect Signal Sensitivity
The period setting changes how sensitive a moving average will be.
A short-period moving average such as the 9, 10, or 20-period line reacts quickly to price. It turns faster, hugs price more closely, and can signal momentum shifts earlier. This makes it useful for active traders watching short-term moves.
The trade-off is that shorter averages are more vulnerable to false signals. In crypto, where brief spikes and sharp pullbacks are common, a short moving average can change direction even when the broader trend remains intact.
A longer-period moving average such as the 50, 100, or 200-period line reacts more slowly. It filters out more noise and gives a steadier picture of the market’s larger direction.
This slower response can be useful when the goal is to avoid overreacting. At the same time, it means the signal arrives later. By the time a long moving average confirms a trend change, a sizable part of the move may already have happened.
In practice, traders often combine different periods instead of relying on one. A shorter average can track near-term momentum, while a longer one provides context about the dominant trend.
A simple way to think about it is this:
That balance between speed and reliability is one of the most important ideas behind moving averages.
Using Moving Averages to Identify Trends
Moving averages are widely used because they help organize trend analysis into something visual and repeatable.
One basic method is to look at the slope of the line. If the moving average is rising, the market may be in an uptrend. If it is falling, the market may be in a downtrend. If it is flat, the market may be consolidating.
Another common method is to compare price to the moving average itself. When price remains above a rising moving average, traders often interpret that as a sign of bullish control. When price stays below a falling moving average, it may reflect bearish pressure.
Moving averages can also act as dynamic support or resistance. In an uptrend, price may pull back toward a moving average and then continue higher. In a downtrend, rallies may stall near a moving average before price resumes lower.
This does not mean the line has magical support or resistance power. It works more as a widely watched reference point. Since many traders monitor the same levels, reactions often cluster around them.
Using multiple moving averages can deepen this analysis. For example, a shorter moving average above a longer one may suggest strong upward momentum. If the shorter line drops below the longer line, it may show weakening trend conditions.
Still, moving averages work best when combined with other tools such as:
Golden Cross and Death Cross Patterns
Two of the most recognized moving average patterns are the Golden Cross and the Death Cross.
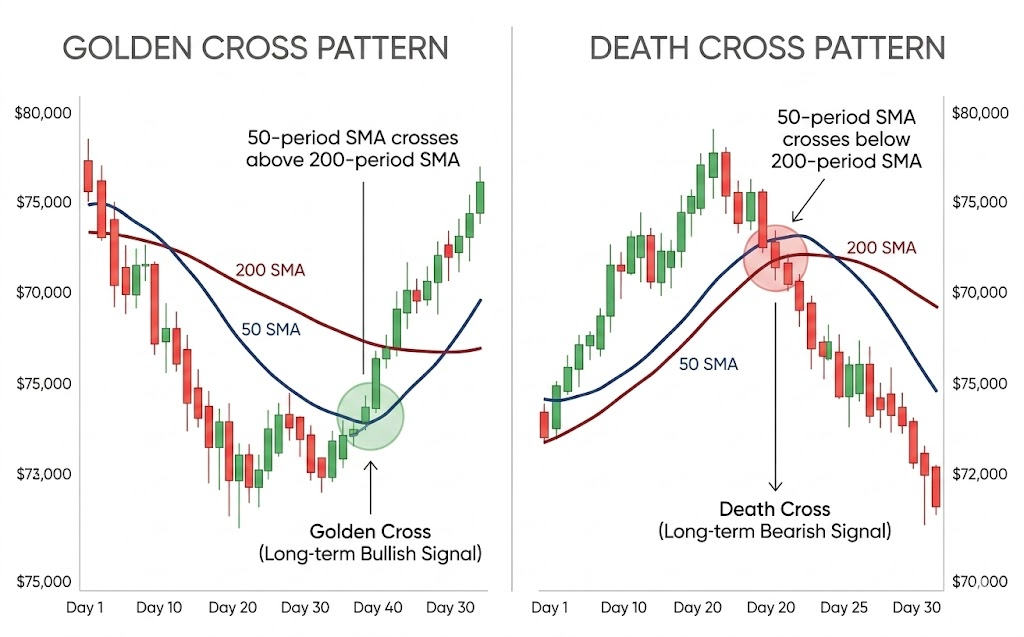
A Golden Cross happens when a shorter-term moving average crosses above a longer-term moving average. This is often interpreted as a bullish signal because it suggests recent price strength is becoming strong enough to overcome the longer-term trend.
A Death Cross is the opposite. It occurs when a shorter-term moving average crosses below a longer-term moving average, which is commonly viewed as a bearish sign.
The most famous version uses the 50-period and 200-period moving averages. On higher timeframes, many traders watch these crosses as signs of major trend transition.
In crypto, however, these patterns should be treated carefully. They can be useful for framing market shifts, but they are still lagging signals. By the time the cross appears, price may already have moved substantially.
This is especially important in fast-moving digital asset markets. A dramatic rally or sell-off can happen before the crossover becomes visible. In sideways conditions, repeated crosses can also create confusion rather than clarity.
For that reason, a Golden Cross or Death Cross is usually more useful as confirmation than as a standalone trigger. Traders often check whether the pattern aligns with breakout structure, momentum, market sentiment, or higher-timeframe trend conditions.
Limitations of Moving Averages
Moving averages are useful, but they have important weaknesses.
The first limitation is lag. A moving average is based on past prices, so it always responds after price has already moved. It can help clarify trend, but it cannot eliminate delay.
The second limitation is poor performance in sideways markets. When price ranges without clear direction, moving averages often generate repeated crosses and weak signals. This can lead to overtrading or false confidence.
Another issue is that the indicator depends heavily on the chosen period. A 20-period EMA and a 200-period SMA can tell very different stories about the same asset. That does not mean one is wrong, but it does mean interpretation depends on timeframe and objective.
There is also the risk of using moving averages too mechanically. A line crossing another line does not explain why the market is moving. News events, liquidity conditions, market sentiment, and broader macro factors can all overwhelm a technical setup.
For beginners, the most important takeaway is that a moving average is a context tool, not a complete trading system. It works best when paired with risk management and a wider view of the chart.
Conclusion
A Moving Average helps crypto traders smooth price action and understand the broader direction of the market. It is widely used because it makes trend analysis easier to read, especially in highly volatile conditions where raw price movement can appear chaotic.
The main types, especially SMA and EMA, differ in how quickly they respond to price. Shorter periods produce faster but noisier signals, while longer periods give more stable but slower readings. Traders use these lines to identify trend direction, monitor pullbacks, and watch for patterns such as the Golden Cross and Death Cross.
At the same time, moving averages are not predictive on their own. They lag, they struggle in choppy conditions, and they can create misleading signals when removed from market context. In practical chart reading, their real value comes from supporting broader analysis rather than replacing it.
FAQs
Is a moving average a leading or lagging indicator?
A moving average is a lagging indicator because it is based on past price data. It helps confirm trend direction, but it does not predict future movement by itself.
Which moving average is better for crypto, SMA or EMA?
Neither is universally better. EMA reacts faster and is often preferred for short-term crypto trading, while SMA gives a smoother view of the broader trend. The better choice depends on timeframe and trading style.
What moving average periods do crypto traders often use?
Common periods include 9, 20, 50, 100, and 200. Shorter periods are used for momentum and near-term trend, while longer periods are used for market context and major trend direction.
Can moving averages be used alone?
They can be used alone for basic chart reading, but relying on them alone is risky. Most traders combine them with price action, support and resistance, volume, and risk management.
Why do moving averages fail in sideways markets?
In ranging markets, price often moves back and forth across the average without developing a sustained trend. This can produce false crossovers and weak signals.
What does a Golden Cross mean in crypto?
A Golden Cross usually means a shorter-term moving average has crossed above a longer-term one, suggesting improving bullish momentum. It is better treated as confirmation than as a standalone buy signal.