In crypto trading, volume refers to the amount of a digital asset traded over a specific period. It is commonly shown as vertical bars below a price chart, but many traders also use specialized indicators to interpret it more clearly.
Crypto markets can move quickly because of speculation, fragmented liquidity, news events, and sudden shifts in sentiment. A price surge with strong volume may suggest broad participation, while a similar move on weak volume may be less reliable.
What Volume Means in Technical Analysis
Volume in technical analysis means the total amount of an asset traded during a selected time period. On a crypto chart, this may represent the number of coins, tokens, or contracts exchanged within one candle.
A one-hour candle, for example, may show that price rose during that hour. Volume explains how much trading activity occurred while that price move happened. This makes volume one of the most important companions to price analysis.
In simple terms, price shows where the market moved, while volume helps show how much participation supported the move.
Volume belongs to a broader category of Technical Indicators, often called Volume & Price Tools. These indicators are designed to connect market activity with price behavior, helping traders judge whether movement is supported by real demand, supply, or participation.
A rising price with increasing volume often suggests stronger buying interest. A falling price with increasing volume may suggest stronger selling pressure. However, interpretation depends on the chart context, market structure, and the asset being analyzed.
Volume is not a guaranteed signal. It is a supporting measurement that helps traders test whether price action looks convincing or fragile.
Why Volume Indicators Matter in Crypto Markets
Volume indicators matter in crypto because crypto prices can move sharply even when liquidity is uneven. Some assets have deep order books and active participation, while others may move dramatically on relatively small trades.
This makes price alone easy to misread.
A token may break above resistance, but if volume is low, the move may lack broad participation. Another asset may decline quickly, but if volume expands strongly during the drop, it may show that sellers are active and that the move deserves attention.
Volume indicators help traders answer practical questions:
-
Is a breakout supported by participation?
-
Is a trend gaining or losing strength?
-
Are buyers or sellers becoming more active?
-
Is price moving through an area where many trades previously occurred?
-
Does the market look liquid enough to support the current move?
In crypto markets, volume can also vary across exchanges. A coin may show high activity on one trading venue and lower activity elsewhere. This is why traders often compare volume across major exchanges or use aggregated data when available.
Volume can also change around major events. Listings, unlocks, protocol updates, exchange announcements, macroeconomic news, and sudden market sentiment shifts can all affect trading activity.
For this reason, volume indicators should not be treated as isolated trading signals. Their value comes from how they help interpret price behavior in real time.
Main Types of Volume-Based Indicators
Volume-based indicators organize raw trading activity into more useful forms. Some focus on trend confirmation, some show where trading activity is concentrated, and others combine price and volume to make trend direction easier to read.
The following table summarizes several common volume indicators used in crypto chart analysis.
| Indicator |
What It Measures |
Common Use in Crypto Trading |
| Volume Bars |
Trading activity during each candle |
Identifying volume spikes, quiet periods, and participation behind price moves |
| On-Balance Volume (OBV) |
Cumulative buying and selling pressure based on price direction |
Checking whether volume supports the current trend |
| Volume Weighted Moving Average (VWMA) |
Average price adjusted by trading volume |
Comparing volume-supported trend direction with a regular moving average |
| Volume Profile |
Trading activity at specific price levels |
Finding high-interest zones, support, resistance, and value areas |
| Money Flow Index (MFI) |
Price and volume together to estimate buying or selling pressure |
Spotting possible overbought, oversold, or divergence conditions |
| Chaikin-style Indicators |
Accumulation and distribution using price position and volume |
Assessing whether buyers or sellers may be more active |
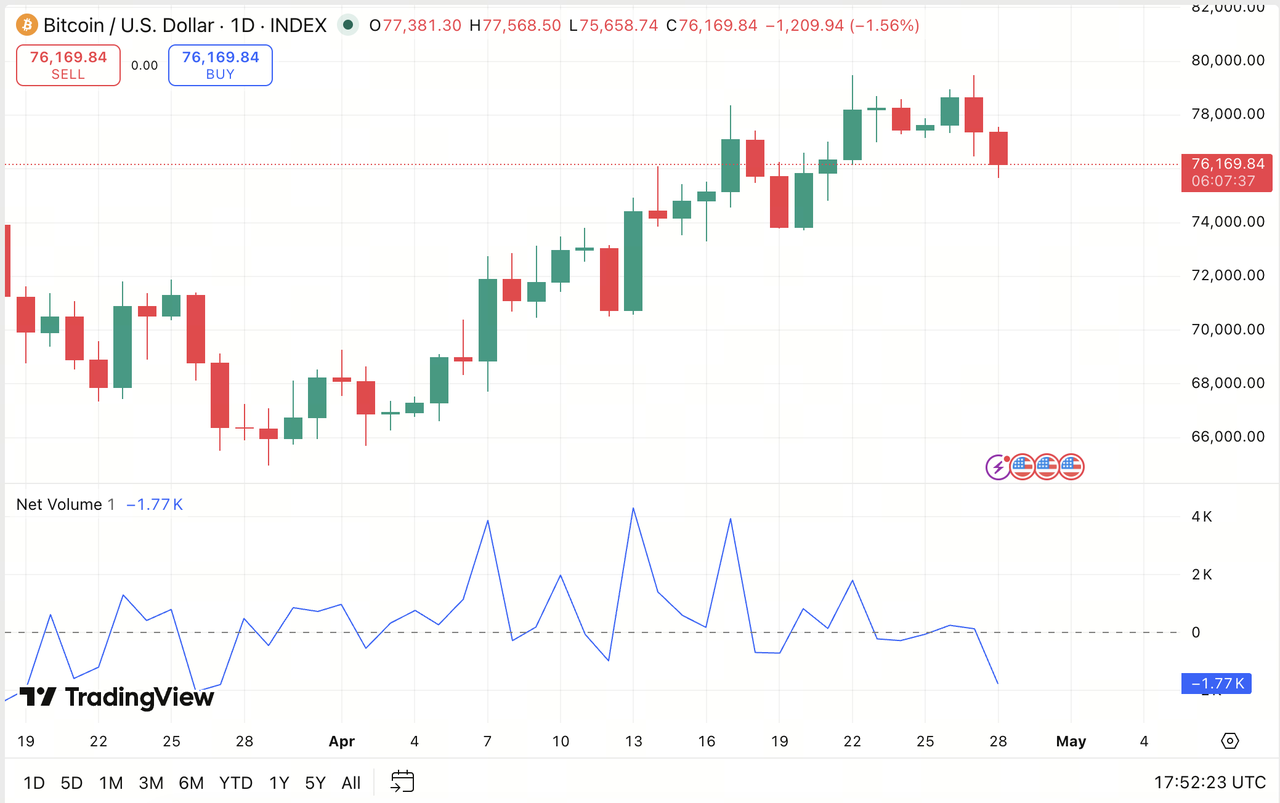
Volume Bars
Volume bars are the simplest form of volume analysis. They appear below the price chart and show how much trading occurred during each candle.
Large volume bars often appear near breakouts, breakdowns, liquidation events, or major news reactions. Small bars usually suggest lower participation or a temporary pause.
Traders often compare current volume with recent average volume rather than looking at one bar in isolation.
On-Balance Volume
On-Balance Volume, or OBV, attempts to show whether volume is generally flowing with rising prices or falling prices. If price closes higher, volume is added to the running total. If price closes lower, volume is subtracted.
The practical use of OBV is simple: traders look for agreement or disagreement between price and volume pressure. If price is rising and OBV is also rising, the trend may appear better supported.
If price rises while OBV weakens, traders may become more cautious because the move may not be supported by the same level of participation.
Volume Weighted Moving Average
The Volume Weighted Moving Average, or VWMA, is a moving average that gives more influence to price candles with higher trading volume. This makes it different from a simple moving average, where each candle is usually treated equally.
In practice, VWMA helps traders see whether the average price is being pulled by periods of heavier participation. If price trades above the VWMA and the VWMA is rising, the trend may appear more strongly supported by active buying.
Traders often compare the VWMA with a regular moving average. When the VWMA moves above a simple moving average, it may suggest that higher-volume candles are occurring at higher prices. When the VWMA moves below it, heavier volume may be occurring at lower prices.
VWMA should not be read as a standalone signal. It is most useful when combined with price structure, volume bars, support and resistance, and broader market context.
Volume Profile
Volume Profile shows how much trading occurred at different price levels rather than during different time periods. This makes it useful for identifying price zones where the market previously showed strong interest.
A high-volume area may act as a support or resistance zone because many traders previously exchanged positions there. A low-volume area may indicate a zone where price moved quickly with less trading activity.
In crypto, Volume Profile is often used to understand where price may pause, react, or accelerate.
Money Flow Index
The Money Flow Index combines price and volume to estimate buying and selling pressure. It is sometimes compared with momentum indicators because traders use it to identify possible overbought or oversold conditions.
MFI can be useful when price reaches a new high or low but volume-supported pressure does not confirm the move. This disagreement is often called divergence.
Chaikin-Style Indicators
Chaikin-style indicators attempt to measure accumulation and distribution by studying where price closes within a candle’s range and how much volume occurred. The goal is to estimate whether buying or selling pressure may be building.
These tools are not perfect, especially in volatile crypto markets, but they can help traders compare price movement with underlying participation.
How Volume Indicators Confirm or Contradict Price Signals
Volume indicators are most useful when they confirm or contradict what price is already showing. They should not replace price analysis. Instead, they help traders judge whether price action has enough participation behind it.
Confirming a Breakout
A breakout happens when price moves above a resistance level or below a support level. If the breakout occurs with rising volume, traders often view it as more meaningful because more participants appear to be involved.
For example, if Bitcoin or another major crypto asset breaks above a long-tested resistance area while volume expands, the move may suggest stronger demand. The volume does not guarantee continuation, but it strengthens the evidence behind the move.
A breakout on weak volume may be less convincing. It can still continue, but traders may treat it with more caution because participation has not clearly expanded.
Confirming a Trend
In an uptrend, healthy volume often appears during upward moves and may decrease during pullbacks. This can suggest that buyers remain more active when price advances.
In a downtrend, volume may increase during selling waves and decrease during temporary rebounds. This can suggest that sellers still dominate the broader structure.
Volume does not need to rise every candle. Markets naturally expand and contract. What matters is whether volume supports the larger pattern.
Identifying Divergence
Divergence occurs when price and volume-based indicators move in different directions.
If price makes a higher high but OBV or MFI fails to confirm, the rally may be losing strength. If price makes a lower low but volume pressure weakens, the sell-off may be losing momentum.
Divergence should not be read as an instant reversal signal. It is better understood as a warning sign that the current move may be less supported than it appears.
Evaluating Support and Resistance
Volume helps traders judge whether support and resistance levels are meaningful. A level that has attracted heavy trading activity may carry more importance than one formed during thin trading.
Volume Profile is especially useful here. It can show where the market previously spent time and where many trades occurred. These areas may influence future reactions because traders often remember levels where positions were opened, defended, or closed.
Limitations of Volume Indicators in Crypto Markets
Volume indicators are useful, but they have clear limitations. Crypto traders should understand these limits before relying on them.
First, volume data can differ across exchanges. Unlike traditional markets with centralized reporting, crypto trading is fragmented across many venues. A chart from one exchange may not show the full picture.
Second, reported volume may not always reflect genuine market interest. Some markets can be affected by wash trading, incentive programs, or artificial activity. This is more common in less liquid assets and smaller trading venues.
Third, volume spikes can be reactive rather than predictive. A large volume candle may appear after a move has already happened. Traders who treat it as an early signal may misread the timing.
Fourth, derivatives volume and spot volume can tell different stories. Futures activity may rise because of leverage, hedging, or liquidations, while spot demand may remain weaker. This difference matters when analyzing crypto assets.
Fifth, volume indicators can produce false confidence. A strong volume move may still fail if broader market conditions change, liquidity disappears, or major news shifts sentiment.
For these reasons, volume indicators should be used with price structure, trend context, support and resistance, liquidity conditions, and broader market awareness.
They are interpretation tools, not prediction machines.
Conclusion
Volume indicators help traders understand the activity behind crypto price movements. They connect price action with participation, allowing traders to judge whether a move appears strong, weak, supported, or uncertain.
In technical analysis, volume shows how much trading occurred. Volume-based Technical Indicators then organize that information into practical tools such as OBV, Volume Profile, MFI, and Chaikin-style indicators.
The main value of Volume & Price Tools is confirmation. Rising volume may strengthen a breakout or trend, while weak volume may reduce confidence in a move. Divergence between price and volume can also warn that momentum is changing.
In crypto markets, volume analysis is especially useful because liquidity can be uneven and price moves can happen quickly. Still, volume should never be used alone. It works best as part of a broader chart-reading process that includes market structure, support and resistance, trend behavior, and risk awareness.
FAQs
What is a volume indicator in crypto trading?
A volume indicator is a technical indicator that analyzes trading activity behind crypto price movements. It helps traders understand whether buyers, sellers, or broader market participation may be supporting a move.
Why is volume important in crypto trading?
Volume is important because crypto prices can move sharply in low-liquidity conditions. Strong volume can suggest wider participation, while weak volume may indicate that a price move lacks support.
Can volume indicators predict price direction?
Volume indicators do not reliably predict price direction by themselves. They are better used to confirm or question existing price signals, such as breakouts, trends, and support or resistance reactions.
What does volume level usually mean in crypto?
Volume level shows how much market participation is behind a price move. Rising volume often suggests stronger buyer or seller activity, depending on price direction, while low volume may signal thinner liquidity, weaker conviction, or quiet consolidation before activity increases again.
Should traders use volume indicators alone?
No. Volume indicators should be used with price structure, trend analysis, support and resistance, liquidity conditions, and broader market context. Volume improves interpretation but does not replace risk management.