Western Digital (WDC), Seagate, Micron, and SanDisk are all involved in data storage, but they operate in different parts of the technology stack. WDC and Seagate are more HDD-oriented, Micron focuses on DRAM and NAND, and SanDisk—spun off from Western Digital—is a Flash and SSD company.
A common mistake investors make when comparing storage stocks is treating "AI data growth," "cloud storage demand," or "memory cycles" as interchangeable variables. In reality, HDD, NAND/SSD, and DRAM each have distinct customer profiles, price cycles, capacity dynamics, and financial characteristics. Simply grouping them under the "storage" umbrella and comparing directly is misleading.
A better framework for categorizing WDC is to start with the underlying technology, then examine the customer context and cycle drivers. This approach places WDC, Seagate, Micron, and SanDisk into distinct layers, helping investors distinguish between HDD capacity-driven demand, Flash storage demand, and memory cycle exposure.
What Are the Main Types of Storage Stocks?
The storage industry can be divided into three technology categories: HDD hard drives, NAND Flash/SSD, and DRAM memory. HDD provides bulk persistent storage, NAND Flash and SSD deliver high-speed non-volatile storage, and DRAM handles fast temporary data processing.
| Category |
Representative Companies |
Primary Use |
Cycle Drivers |
| HDD |
WDC, Seagate |
Cloud data centers, enterprise archiving, consumer hard drives |
Cloud capacity demand, hard drive pricing |
| NAND / SSD |
SanDisk, Micron |
Enterprise SSD, client SSD, mobile devices |
NAND pricing, device demand |
| DRAM |
Micron |
Servers, PCs, AI training and inference memory |
Memory pricing, compute demand |
Being classified as a storage stock does not mean valuation logic is uniform. HDD and DRAM differ significantly in inventory cycles, customer structures, and product gross margin profiles.
What Type of Storage Company Is WDC?
Following the SanDisk spin-off, Western Digital is now a more HDD-focused company. Its core business is providing hard drive storage to cloud data centers, enterprise customers, OEMs, and consumers. HDDs are well-suited for storing large volumes of data that do not require frequent high-speed access—such as backups, archives, logs, video, and portions of AI datasets.
WDC's key variables include: demand for high-capacity HDDs, orders from hyperscale cloud customers, cost per unit of capacity, product yields, and HDD pricing cycles. Compared to NAND or DRAM companies, WDC has lower direct exposure to memory spot prices but is more sensitive to cloud customers' procurement plans.
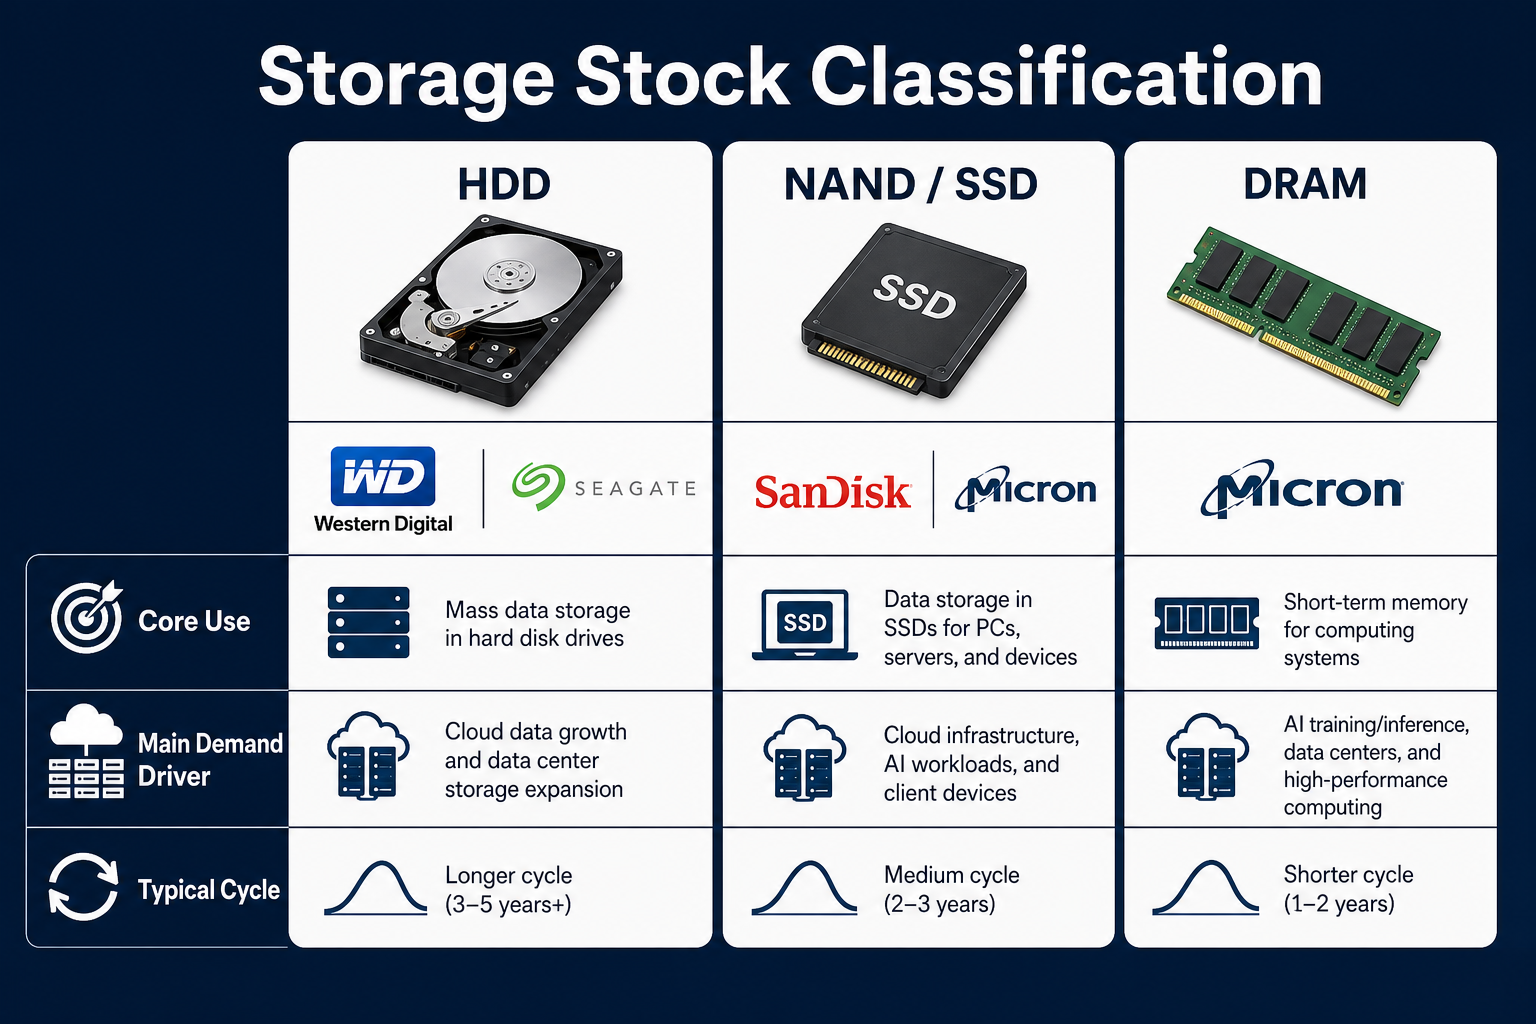 Figure 1. Storage stock classification: WDC and Seagate focus on HDD, SanDisk on NAND/SSD, and Micron covers both DRAM and NAND.
How Are Seagate and WDC Similar and Different?
Seagate and WDC are both major HDD players and benefit from cloud data centers' need for large-capacity storage. They are highly comparable in terms of customer types, product tiers, and industry cycles. When comparing WDC and Seagate, investors should focus on HDD shipment volumes, average capacity, gross margin, cloud customer orders, and capital allocation policies.
The key differences lie in their corporate structure and spin-off history. WDC's business boundaries changed significantly after the SanDisk spin-off, requiring a fresh interpretation of its historical financials. Seagate, by contrast, has maintained HDD as its primary business for much longer. Direct comparisons should go beyond short-term stock performance and examine product mix and customer composition.
Why Aren't Micron and WDC in the Same Cycle?
Micron is primarily a DRAM and NAND memory company, making it more sensitive to memory prices, wafer capacity, and demand from servers and consumer electronics. DRAM and NAND prices are highly cyclical, and inventory adjustments or supply-demand shifts can quickly impact revenue and margins.
WDC's HDD cycle also fluctuates, but the drivers are more tied to cloud capacity procurement, enterprise storage upgrades, and large customer demand timing. While AI data centers boost demand for DRAM, NAND, SSD, and HDD simultaneously, each product serves a different role. Applying Micron's memory cycle logic directly to WDC would be inaccurate.
Where Does SanDisk (SNDK) Fit in Storage Stock Classification?
After spinning off from Western Digital, SanDisk became a pure NAND Flash and SSD company. Compared to WDC's HDD focus, SNDK sits squarely in the Flash storage chain and is directly exposed to NAND pricing, SSD demand, enterprise storage upgrades, and consumer device cycles.
SNDK and Micron are comparable at the NAND level, but Micron also has a significant DRAM business. The comparability between SNDK and WDC stems more from their shared origin (the spin-off) than from overlapping business lines. This distinction is critical for ticker identification and risk analysis.
How Does the AI Data Center Affect Different Storage Companies?
AI is not a single driver for storage demand; instead, it fuels demand across a multi-layered storage stack. Training and inference require high-speed memory, SSD caching, object storage, backups, and long-term archiving. DRAM, NAND/SSD, and HDD each serve different tiers.
For WDC and Seagate, the main AI-driven theme is ongoing data growth and long-term cloud retention needs. For Micron and SanDisk, AI has a more direct impact on high-performance memory, enterprise SSDs, and NAND pricing cycles. Different classifications require different analytical metrics.
How to Avoid Cross-Cycle Comparison Errors When Analyzing Storage Stocks?
The first step is to identify which storage technology drives the majority of a company's revenue. For HDD companies, focus on cloud capacity demand, average capacity per drive, hard drive pricing, and large customer order patterns. For NAND/SSD companies, look at flash memory pricing, enterprise SSD demand, consumer electronics cycles, and fab utilization rates. For DRAM companies, the key drivers are server and PC demand, AI memory requirements, and memory pricing.
The second step is to ensure the comparison targets are in the same business layer. WDC and Seagate are best compared on the HDD dimension. WDC and Micron can only be compared in the broadest sense of "storage"—you cannot directly apply Micron's memory cycle to explain WDC's HDD demand. For WDC and SanDisk, you must first account for the spin-off relationship, then analyze HDD and NAND/SSD separately.
| Comparison Pair |
Comparability |
Key Things to Check |
| WDC vs Seagate |
High |
HDD shipments, cloud customers, gross margin, cash flow |
| WDC vs Micron |
Medium to Low |
Cycle differences between HDD and DRAM/NAND |
| WDC vs SanDisk |
Requires spin-off boundary analysis |
WDC's HDD vs SNDK's NAND/SSD |
This table breaks down the generic "storage industry" label into specific comparability levels. The lower the comparability, the more effort needed to explain differences in technology, customer profiles, and cycles before discussing revenue, profit, or risk.
The third step is to distinguish between company analysis and trading page identification. Company analysis answers "which technology chain does this company belong to," while trading page identification answers "which company corresponds to this ticker." WDC, SNDK, STX, and MU may all appear under storage-themed listings, but users searching on Gate Stocks should always confirm the ticker and then map the entity back to its correct industry classification.
This workflow is especially important for WDC after the SanDisk spin-off. Before the spin-off, Western Digital combined HDD and Flash; after the spin-off, WDC is much more HDD-focused. Using pre-spin-off aggregate metrics when comparing to Micron or SanDisk risks mixing different business cycles. Classify first, compare second, verify the ticker third—that's the most reliable analytical order.
For everyday investors, this approach also reduces search costs. Decide whether a stock belongs to HDD, NAND/SSD, or DRAM, then read the financial reports and trading pages. The information path becomes much clearer.
Summary
WDC, Seagate, Micron, and SanDisk are all part of the broader data storage value chain, but their technologies and cycles differ. WDC and Seagate are HDD-oriented, Micron covers both DRAM and NAND, and SanDisk focuses on NAND Flash and SSD. When building a comparison framework, investors should first distinguish the underlying technology, then consult WDC's trading path and WDC's metrics and risk checklist to evaluate customer structure, price cycles, AI data center exposure, and financial metrics.
FAQ
Are WDC and Seagate the same kind of company?
Both are primarily HDD companies and highly comparable, but WDC's financials after the SanDisk spin-off require careful reinterpretation.
What's the difference between Micron and WDC?
Micron is mainly DRAM and NAND; WDC, post-spin-off, is mainly HDD. Their price cycles, customer bases, and technology paths are fundamentally different.
Can SanDisk and WDC still be directly compared?
They share a spin-off origin, but their businesses are now separate. SNDK is NAND/SSD, while WDC is HDD.
Will AI data growth benefit all storage companies equally?
AI increases storage demand overall, but different products benefit in different ways. DRAM, SSD, and HDD each serve distinct storage tiers.