Plotted as dots above or below price, the Parabolic SAR indicator helps identify trend direction and potential reversal points. Swing traders primarily use it to trail exits as a trend develops. However, Parabolic SAR can switch direction frequently in sideways markets, so its signals require confirmation from price structure or another indicator.
TL;DR
-
The Parabolic SAR indicator plots dots below price during a bullish trend and above price during a bearish trend.
-
A dot moving to the opposite side of price can warn that the current trend is weakening or reversing.
-
Swing traders can use Parabolic SAR as a dynamic trailing-exit reference rather than predicting a fixed price target.
-
The indicator generally becomes more responsive as a trend extends and records new price extremes.
-
Parabolic SAR is less reliable in sideways or highly erratic markets because repeated dot flips can produce premature exits.
What Is the Parabolic SAR Indicator?
The Parabolic SAR indicator is a trend-following technical indicator developed by J. Welles Wilder Jr. in 1978 to show trend direction, possible reversal points, and dynamic stop-and-reversal levels. Parabolic SAR stands for “stop and reverse,” reflecting the indicator’s original purpose as a system that follows an existing trend and changes sides when price crosses its calculated level.
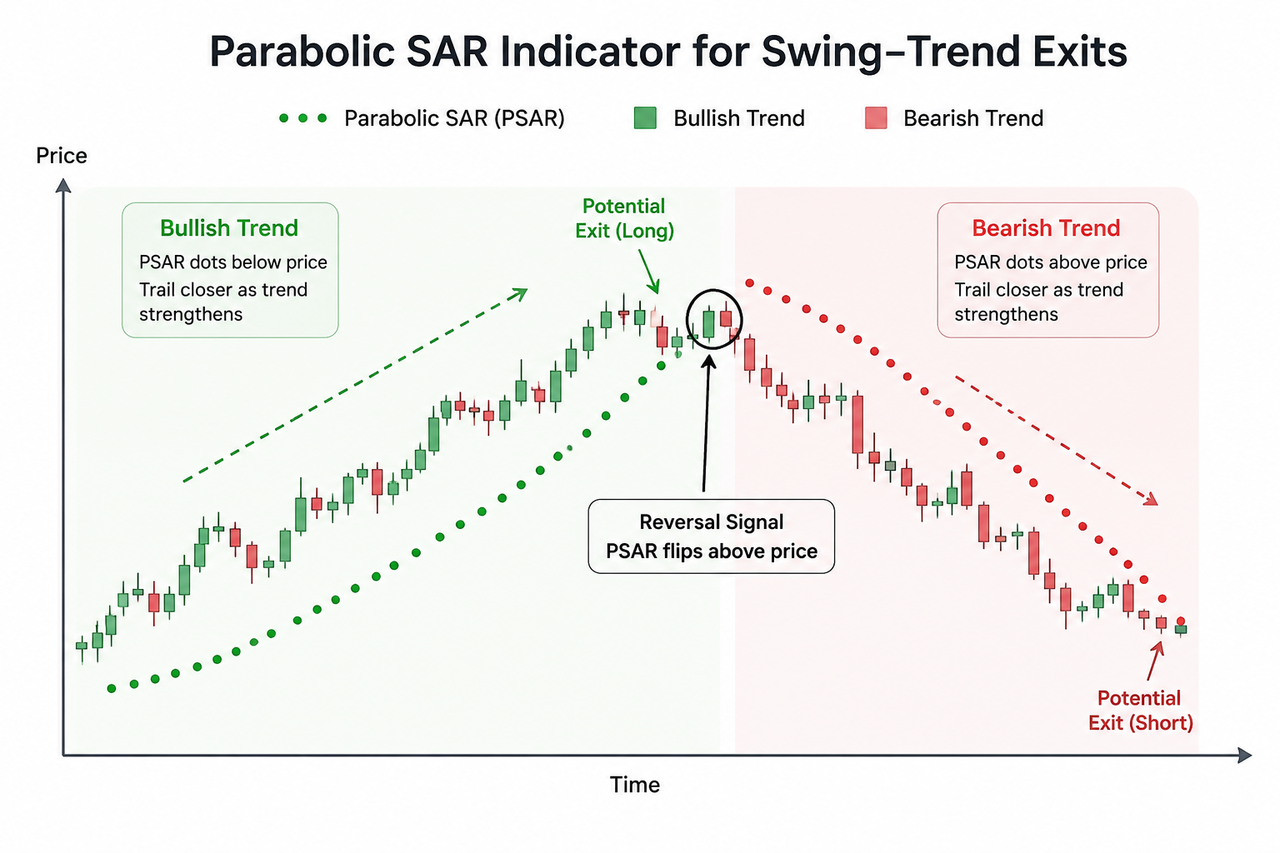
On a chart, Parabolic SAR appears as a sequence of dots:
-
Dots below price indicate a bullish trend.
-
Dots above price indicate a bearish trend.
-
A flip of the dots signals a potential trend reversal.
The dots initially remain farther from price but usually accelerate toward it when the trend continues and establishes new extremes. This behaviour creates the indicator’s curved, parabolic appearance and gives traders a quick visual read on momentum and trailing exits.
For swing traders and technical analysts trading crypto or other assets, Parabolic SAR is most useful as a visual, systematic way to track trend direction and manage trailing exits as a move develops, and it came from Wilder’s book New Concepts in Technical Trading Systems. Wilder introduced it alongside broader technical trading systems work that also shaped modern technical analysis.
This guide explains what the indicator is, how it works and is calculated, how swing traders use it for trend exits, how to read its signals, where common settings help or hurt, how it compares with SuperTrend, when to combine it with other indicators for confirmation, and where its limitations show up. Although a dot flip can be read as a reversal signal, many traders get more value from Parabolic SAR as an exit-management tool than as a standalone entry trigger. Used well, it adds structure to risk control and helps traders stay disciplined in trending markets instead of guessing when a move has ended.
How Does the Parabolic SAR Indicator Work?
The Parabolic SAR indicator follows price by adjusting its value during each chart period. This is how parabolic sar works as a trend-following indicator: it trails price from one period to the next using the current trend, the trend’s most extreme price, and an acceleration factor.
Three inputs shape the calculation:
| Component |
Meaning |
Function |
| prior SAR |
The indicator value from the preceding period |
Establishes the starting point for the next dot |
| Extreme point |
The highest high in an uptrend or lowest low in a downtrend |
Measures how far the trend has progressed |
| Acceleration factor |
A value that increases as new extremes appear |
Moves the dots closer to price as the trend extends |
During an uptrend, the standard calculation is:
Current SAR = Prior SAR + Prior AF × (Prior HP − Prior SAR) — this is the rising SAR formula and it produces the new SAR value for the next period.
During a downtrend, the calculation is:
Current SAR = Prior SAR - Prior AF × (Prior SAR – Prior LP) — this is the falling SAR formula and it produces the new value for the next period.
AF represents the acceleration factor, while EP represents the extreme point. A common default acceleration factor begins at 0.02, increases when price establishes a new trend extreme, and is capped at 0.20, which is the standard maximum acceleration or maximum value. Charting platforms also apply a final step to keep the SAR from moving too far into recent price-range boundaries, and they normally perform these calculations automatically.
The important practical effect is that the gap between price and the dots can narrow over time. This framework also supports trend research by mapping how price extremes and acceleration change over time. As a bullish move continues, the dots rise beneath price. If price falls through the projected SAR level, the dots flip above price and the indicator begins tracking a possible downtrend.
How Can Swing Traders Use Parabolic SAR for Trend Exits?
Swing traders can use Parabolic SAR within a parabolic sar trading system as a dynamic trailing stop-loss to manage exits as price moves in the trend’s direction. This approach allows a position room to develop while creating an objective condition for reconsidering the trade.
Consider a trader holding a long position during an established uptrend. Parabolic SAR dots remain below the asset's price and beneath the price bars as price forms higher highs and higher lows. Rather than choosing an arbitrary profit target, the trader monitors the rising dots. A candle moving below the SAR level and causing the dots to flip above price may indicate that bullish momentum has weakened, flag momentum shifts and an entry or exit reassessment.
For a short position, the process is reversed. The dots trail above falling price, and a move in the opposite direction above the SAR level can warn that the bearish trend is losing control.
A basic exit framework may involve:
-
Confirming that price is already trending.
-
Entering through a separate setup rather than rely solely on a SAR flip.
-
Monitoring the dots as the trend develops.
-
Tightening risk controls as the dots move closer to price.
-
Reassessing or closing the position when the dots switch sides, as this can signal potential reversals.
This framework does not guarantee execution at the plotted SAR value. Fast markets can move beyond a planned stop before an order is filled, particularly in volatile or thinly traded assets.
How Should Parabolic SAR Signals Be Interpreted?
Parabolic SAR signals should be interpreted in the context of price structure and price action rather than treated as automatic instructions. The location and stability of the dots matter more than a single isolated flip.
| Chart behaviour |
Possible interpretation of Parabolic SAR trading signals |
Swing-trading implication |
| Dots remain below rising price |
Bullish trend remains active |
Continue monitoring a long position |
| Dots remain above falling price |
Bearish trend remains active |
Continue monitoring a short position |
| Dots move closer to price |
Exit threshold is tightening |
Prepare for a possible trend change |
| Dots flip to the opposite side |
Price crossed the calculated SAR level, signaling a potential price reversal |
Review or exit the current position |
| Dots repeatedly switch sides |
Market lacks a stable trend |
Reduce reliance on SAR signals |
A dot flip confirms that price crossed the indicator’s calculated level. It can signal a potential trend reversal, but it does not confirm that a sustained reversal will follow. Price may briefly cross the dots and then resume its previous direction, and the indicator does not measure trend strength by itself.
How Can Parabolic SAR Be Combined With Other Indicators?
Many traders use the Parabolic SAR with other indicators for confirmation rather than on its own. Moving averages, momentum tools, and price structure can reduce reliance on isolated dot changes, which is common in active trading when signals need fast confirmation.
A rising EMA 20 indicator can help identify a short-term bullish swing structure. When price remains above the EMA and Parabolic SAR dots stay below price, both tools support the same directional interpretation. This combination can help confirm trend strength before traders act on a flip. A SAR flip becomes more meaningful when price also closes below the EMA or breaks a previous swing low.
Longer-term traders may use the SMA indicator to define the broader market bias. For example, bullish Parabolic SAR signals may receive greater weight when price remains above a rising long-period SMA and aligns with the longer term trend.
The MACD indicator can provide momentum context within broader technical analysis and trading strategies. A bearish SAR flip accompanied by weakening MACD momentum may offer stronger evidence that an uptrend is losing strength. This is one way active traders use the Parabolic SAR to manage short-term decisions.
Parabolic SAR also differs from the SuperTrend indicator. Both can switch sides around price, but SuperTrend uses Average True Range and a multiplier to create a volatility-adjusted trend line. Parabolic SAR accelerates according to new price extremes, which can make it tighten more aggressively during an extended move.
Parabolic SAR vs SuperTrend
Parabolic SAR and SuperTrend both help traders follow trends, but they respond to different inputs and may produce different exit timing.
| Feature |
Parabolic SAR |
SuperTrend |
| Main calculation inputs |
Extreme point and acceleration factor |
Average True Range and multiplier |
| Chart display |
Dots above or below price |
Continuous line above or below price |
| Behaviour in extended trends |
Accelerates toward price |
Adjusts according to volatility |
| Primary swing-trading use |
Trailing exits and reversal warnings |
Trend confirmation and trailing support or resistance |
| Common weakness |
Frequent flips in sideways conditions |
Delayed signals with wider settings |
Parabolic SAR may suit traders who want an increasingly tight exit reference as a trend matures. SuperTrend may suit traders who prefer an exit level that changes with measured market volatility. Neither indicator consistently identifies the exact end of a trend.
What Settings Are Commonly Used?
The standard Parabolic SAR settings are often shown as 0.02, 0.02, and 0.20, which are the common default setting values on most charting platforms. These values represent the starting acceleration factor, its incremental increase, and 0.20 as the maximum acceleration setting in the standard configuration.
Changing the settings affects sensitivity:
-
A higher acceleration factor moves the dots closer to price and produces faster exits, but it can create more false reversals.
-
A lower acceleration factor places the dots farther from price, allows trends more room, and can produce fewer reversals.
-
Shorter chart timeframes generally produce more signals and more market noise.
-
Longer timeframes tend to produce fewer but broader trend changes.
Short term traders may increase sensitivity, while longer-term users may prefer slower settings depending on market conditions.
There is no setting that works equally well across all assets, timeframes, and volatility conditions. Any adjustment should be evaluated across varied market environments rather than selected only because it performed well on one historical chart.
Limitations of the Parabolic SAR Indicator
The main limitation of Parabolic SAR is that it works best in trending markets, especially strong and sustained trends, while those conditions occur only about 30% of the time. When price moves sideways, including sideways or choppy markets, the indicator can repeatedly flip above and below the candles, producing a sequence of misleading reversal signals that can create frequent false signals for a parabolic sar stop or reversal system.
Other limitations include:
-
The indicator uses historical price data and cannot anticipate sudden news-driven moves.
-
A dot flip may occur after part of the reversal has already happened.
-
Increasing acceleration can force an early exit from a trend that later resumes.
-
The plotted value does not guarantee that a stop order will execute at that price.
-
The indicator is prone to whipsaws over 50% of the time, particularly in choppy markets.
-
Parabolic SAR does not measure trading volume, liquidity, or the fundamental cause of a price move.
Swing traders should therefore treat the indicator as one component of a broader risk-management process. Position sizing, market structure, liquidity, and predetermined loss limits remain important even when the dots appear to provide a clear exit level. Higher-risk activities such as options or margin trading may require a larger initial investment and tighter controls, and traders should review the options disclosure document, “Characteristics and Risks of Standardized Options.”
Conclusion
The Parabolic SAR indicator gives swing traders a visual method for following trend direction and managing potential exits. Dots below price support a bullish interpretation, while dots above price support a bearish interpretation. A switch to the opposite side warns that the existing move may be weakening.
Its greatest value lies in creating a disciplined trailing-exit framework rather than predicting exact market tops or bottoms. Parabolic SAR becomes more reliable when an established trend is confirmed through price structure, moving averages, momentum, or volatility-based tools. In sideways markets, repeated flips can make the indicator less dependable and increase the risk of premature exits.
Cryptocurrency trading involves substantial risk, and technical indicators cannot guarantee favourable outcomes. Parabolic SAR signals should be tested, confirmed, and used with appropriate position sizing and independent risk controls, while noting that investor protections vary by platform and jurisdiction, with U.S. brokerage examples often referencing the securities investor protection corporation.
FAQ
Is Parabolic SAR a leading or lagging indicator?
Parabolic SAR is generally considered a lagging trend-following indicator because its values are calculated from previous price data. It responds to developing price movements rather than predicting a reversal before supporting evidence appears.
Is Parabolic SAR good for swing trading?
Parabolic SAR can support swing trading when an asset is moving through a clear directional trend. It is most useful when the asset is in a current uptrend or current downtrend, not a range, because its trailing dots provide an adaptable exit reference, which is why it tends to appeal to active traders looking for responsive exits.
Can Parabolic SAR be used as a stop-loss?
Parabolic SAR can provide a reference for a trailing stop-loss, but the plotted dot is not an executed order. Traders must place and manage actual stop orders separately, and market gaps or rapid volatility may cause execution away from the intended level.
What happens when Parabolic SAR dots switch sides?
A switch from below price to above price in the Parabolic SAR’s dotted line signals that price crossed the bullish SAR level and may be entering a bearish phase. A switch from above to below suggests a possible bullish reversal and can mark a potential entry for some traders, though confirmation is still needed. Either signal requires confirmation because a brief crossing may not develop into a lasting trend.
Which indicator works well with Parabolic SAR?
Moving averages, MACD, SuperTrend, the relative strength index, and price structure can provide useful confirmation. A trader may use one tool to establish trend direction and Parabolic SAR to manage the position as that trend develops, since these confirmation tools help because Parabolic SAR does not measure trend strength on its own.







