The core distinctions among the three Bitcoin mining stocks—WULF, MARA, and RIOT—are as follows: WULF prioritizes low-cost electricity and energy efficiency per unit, MARA focuses on hashrate scale and asset allocation strategy, and RIOT emphasizes infrastructure operations and execution quality for expansion. Comparing them solely under the “mining company stock” label can easily blur the lines between cost curves, capital structures, and realization capabilities. To understand why stock elasticity diverges within the same Bitcoin cycle, all three companies must be evaluated using a unified operational framework. By first establishing the boundaries of each stock through TeraWulf (WULF) stock fundamentals, peer comparisons become more consistent and reliable.
What Is WULF Stock? What Is Its Core Business Focus?
WULF stock represents equity in TeraWulf, whose core strategy is to transform power, mining machines, and operational efficiency into sustained hashrate output. In comparative analysis, WULF is primarily tagged with “unit cost management,” maintaining mining cost competitiveness through energy sources and facility efficiency. When evaluating WULF, it is standard to first examine electricity costs, then the pace of hashrate expansion, and finally how financing constraints affect resilience during market cycles.
Based on WULF’s business model and revenue-cost structure, WULF should be assessed in the sequence: output value, electricity price, equipment efficiency, and capital limits. At the same coin price, companies with lower unit costs enjoy a broader profit buffer. Thus, WULF’s comparative value lies not in nominal hashrate scale, but in the traceability and verifiability of its cost base.
What Is MARA Stock? How Should Its Expansion Strategy Be Interpreted?
MARA stock represents equity in Marathon Digital Holdings, with its comparative focus on “scale expansion and asset allocation flexibility.” MARA is often classified as a high-elasticity mining company because its results are highly sensitive to coin price, hashrate deployment, and financial strategies. Unlike models that stress cost floors, MARA’s key evaluation points are whether its expansion pace is sustainable and whether scale growth is adequately supported by financing.
Assessing MARA requires more than just reviewing installed capacity; it’s essential to determine whether capital expenditures and cash flow align. While expansion amplifies output elasticity during bull cycles, it also increases volatility when costs rise or financing tightens. When comparing across peers, “hashrate ceiling” and “capital limits” must be distinguished: the former determines potential, while the latter determines whether that potential can be realized.
What Is RIOT Stock? What Are Its Infrastructure Characteristics?
RIOT stock represents equity in Riot Platforms, with a comparative focus on “infrastructure operations and capacity execution.” RIOT is typically evaluated based on mine construction, equipment deployment efficiency, operational stability, and the resulting certainty of output. Compared with companies that emphasize asset allocation flexibility, RIOT is more often assessed on execution quality.
RIOT’s operational differences are reflected not only in nominal hashrate, but also in the pace of capacity realization and cost control. Delays in construction, fluctuations in online rates, or operational instability can all impact unit output and cost cadence. Therefore, when analyzing RIOT, both “planned capacity” and “realized capacity” must be considered to avoid confusing announced scale with actual cash output.
How Do the Three Companies Differ in Cost Structure, Hashrate Expansion, and Cycle Elasticity?
The following table places WULF, MARA, and RIOT on the same comparative axis, providing a reusable template for stock analysis.
| Dimension |
WULF |
MARA |
RIOT |
| Cost Structure Focus |
Electricity and energy efficiency synergy, focus on unit cost floor |
Cost dilution and capital efficiency with scale expansion |
Infrastructure operating efficiency and cost execution |
| Hashrate Expansion Path |
Conservative expansion, focus on cost control |
Aggressive expansion, focus on scale and elasticity |
Balanced expansion and operations, focus on realization quality |
| Source of Cycle Elasticity |
Profit elasticity from cost curve improvement |
Performance elasticity from coin price and scale linkage |
Driven by capacity execution and cost management |
| Main Constraint Variables |
Electricity price, equipment efficiency, financing conditions |
Capital expenditures, financing window, difficulty changes |
Construction progress, operational stability, cost fluctuations |
This table clarifies that the differences among the three are not about “whether they mine,” but “how they convert mining capacity into sustainable cash flow.” Effective comparison should focus on cost, scale, and execution, while verifying whether constraint variables support expansion pace.
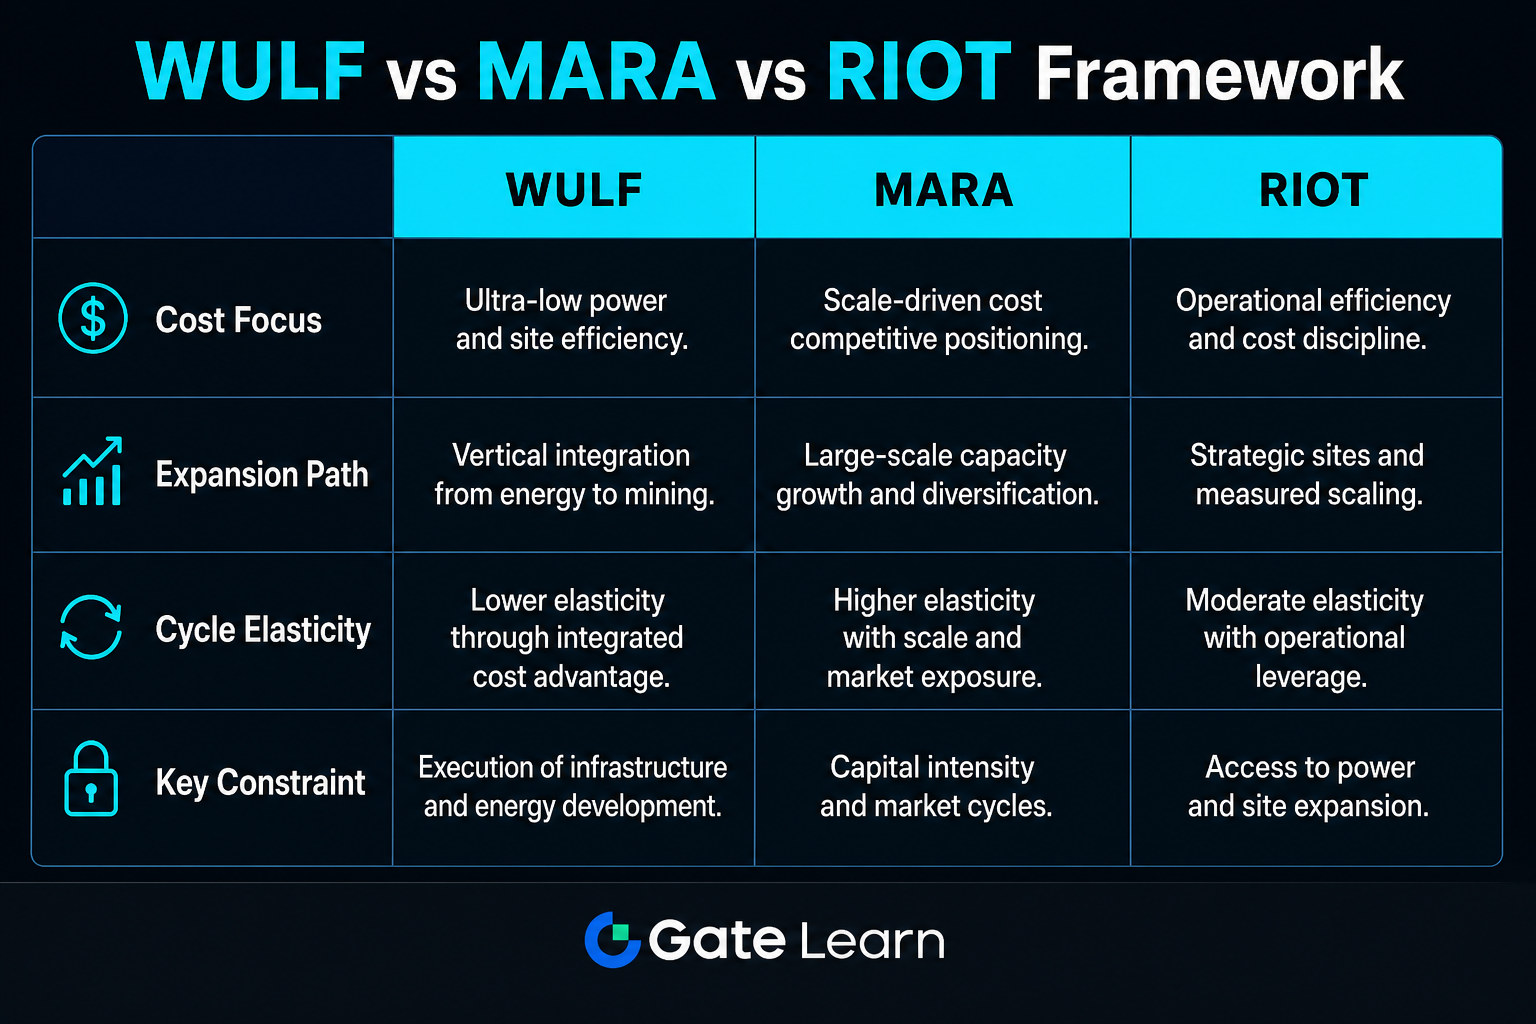
Figure 1. Comparative framework of WULF, MARA, and RIOT across cost, expansion, elasticity, and constraints.
Why Do These Three Stocks Diverge Within the Same Bitcoin Cycle?
All three stocks are influenced by Bitcoin price and network difficulty, but the transmission mechanisms differ. When Bitcoin price rises, MARA’s scale-elastic model may respond more quickly to market expectations; when the focus shifts to cost and cash flow quality, WULF’s cost control approach is more likely to be repriced; when attention turns to expansion realization and facility stability, RIOT’s execution variables gain more weight. Divergence is driven by operational model differences, not the cycle itself.
Another critical factor is the capital environment. Financing costs, debt structure, and reinvestment capacity redefine a company’s expansion limits at each stage. The same hashrate target, under different capital constraints, entails different risk exposures. During halving or difficulty increases, compressed unit rewards further magnify differences: models with a stable cost base typically withstand pressure differently than high-scale elasticity models.
| External Variable |
Main Impact Path for WULF |
Main Impact Path for MARA |
Main Impact Path for RIOT |
| Bitcoin Price |
Alters unit output value, amplifies cost advantage |
Amplifies scale-driven performance elasticity |
Changes cash recovery speed of realized capacity |
| Network Difficulty |
Tests unit energy efficiency and machine operation strategy |
Tests output dilution after expansion |
Tests online rate and operational stability |
| Financing Conditions |
Determines if low-cost expansion can continue |
Affects ability to maintain high capital expenditures |
Influences pace of new construction and upgrades |
This table illustrates mechanism pathways, not temporary conclusions. Identical external variables, when filtered through different internal operational models, result in divergent stock responses.
How Can WULF, MARA, and RIOT Be Compared Using a Unified Framework?
The comparison process can be structured into four steps: first, analyze revenue drivers; second, assess the cost base; third, evaluate expansion capital; fourth, review execution realization. Revenue drivers include coin price and difficulty; cost base includes electricity price, equipment efficiency, and operational expenses; expansion capital covers sources of capital expenditures and debt maturity; execution realization includes deployment speed, online rate, and capacity stability. With a fixed process, the comparability among the three companies is enhanced.
On the trading side, company comparison and platform execution should be kept separate. For example, in how to trade WULF stock with USDT on Gate, the focus is on verifying the ticker, order parameters, and fee rules, rather than evaluating the company’s strengths or weaknesses. Analytical frameworks and order verification should always remain parallel and distinct.
What Are the Limitations and Risks When Comparing These Three Stocks?
A comparative framework helps reduce label confusion but cannot eliminate the inherent constraints shared by mining companies. All three face Bitcoin cycles, network difficulty, electricity costs, and changing financing conditions. The framework clarifies sources of differentiation but does not guarantee that any one attribute will always be superior. Mistaking elasticity potential for certainty is a common analytical error.
Other limitations include inconsistent data standards: if hashrate, online rate, or electricity cost metrics are not comparable, table-based conclusions may be distorted. On the risk side, price shocks, rising network difficulty, construction delays, and tightened financing should be evaluated separately, as these factors impact stock volatility through profit margins and valuation expectations. Advantages, limitations, and risks should be presented side by side, without blending with buy/sell recommendations.
Summary
The essence of comparing WULF, MARA, and RIOT stocks is not “which is best,” but “which variables drive operational elasticity.” WULF is more cost-efficiency-oriented, MARA is more scale-elasticity-driven, and RIOT is more focused on execution quality. Placing all three companies in the same cost–expansion–cycle framework, and verifying constraint variables and data standards, helps reduce conceptual confusion and enables a more robust comparative approach.
FAQ
What Is the Fundamental Difference Among WULF, MARA, and RIOT Stocks?
All three are Bitcoin mining-related stocks, but each has a different operational focus. WULF emphasizes unit cost control, MARA emphasizes scale expansion elasticity, and RIOT emphasizes infrastructure execution quality. The differences are rooted in operational strategy, not industry classification.
Why Isn’t Hashrate Scale Alone Sufficient to Compare These Stocks?
Hashrate scale represents potential capacity, not ultimate profitability. Electricity price, equipment efficiency, financing costs, and operational stability collectively determine cash flow performance. Focusing solely on scale ignores the nuances of cost structure and capital constraints.
Why Do These Three Stocks Exhibit Different Volatility Patterns Within the Same Bitcoin Cycle?
Because changes in Bitcoin price are transmitted through different business models. Scale-driven, cost-driven, and execution-driven approaches each have varying sensitivities to the same external factors. As market focus shifts at different stages, stock elasticity diverges accordingly.
What Does RIOT’s Infrastructure Attribute Mean in Peer Comparisons?
It means that when comparing RIOT, one must consider not only nominal hashrate but also deployment realization and operational stability. Infrastructure execution quality directly impacts unit output and cost control, shaping profitability expectations. This dimension explains RIOT’s differentiation from other mining companies.
What Should Be Verified First Before Trading WULF Stock with USDT?
First, confirm the consistency between the stock ticker and the trading target, then check order parameters and fee rules. Fund status, order conditions, and risk disclosures should all be reviewed before placing an order. Operational verification and company analysis should be kept separate to prevent information confusion.