The first five lessons addressed the three fundamental questions of perpetual markets: how prices are anchored, how deviations are priced, and how stress erupts. The final lesson’s goal is not to add new concepts, but to assemble these components into a process that remains stable even under high-pressure conditions: using a unified language to interpret both crypto perpetuals and TradFi leveraged products, thereby reducing cognitive blind spots from “different terms, same risks” when allocating or hedging across markets.
1. The “Closed-Loop Formula” of Perpetual Microstructure
The course’s main line can be structurally summarized in one sentence:
Index anchoring (benchmark) × Mark price constraint (risk measurement) × Basis (deviation) × Funding (correction cash flow) × OI (size) × Order book depth (execution) × Liquidation rules (enforcement) ⇒ Price path
Within this closed loop, Funding’s role is very clear: it converts “deviation” into an observable, payable, and accumulable cost signal. When analyzing Funding, the key is not to ask about “the next move,” but to focus on three types of questions:
- Is the deviation persistent? (Basis level and rate of change)
- Is size building up in sync? (OI and cooperation signals)
- Is execution becoming fragile? (Spread, depth, volatility regime)
When all three worsen together, the market’s nonlinear tail risk rises significantly—independent of directional judgment.
2. Weekly Operating System (OS): Four Panels + One Event Axis
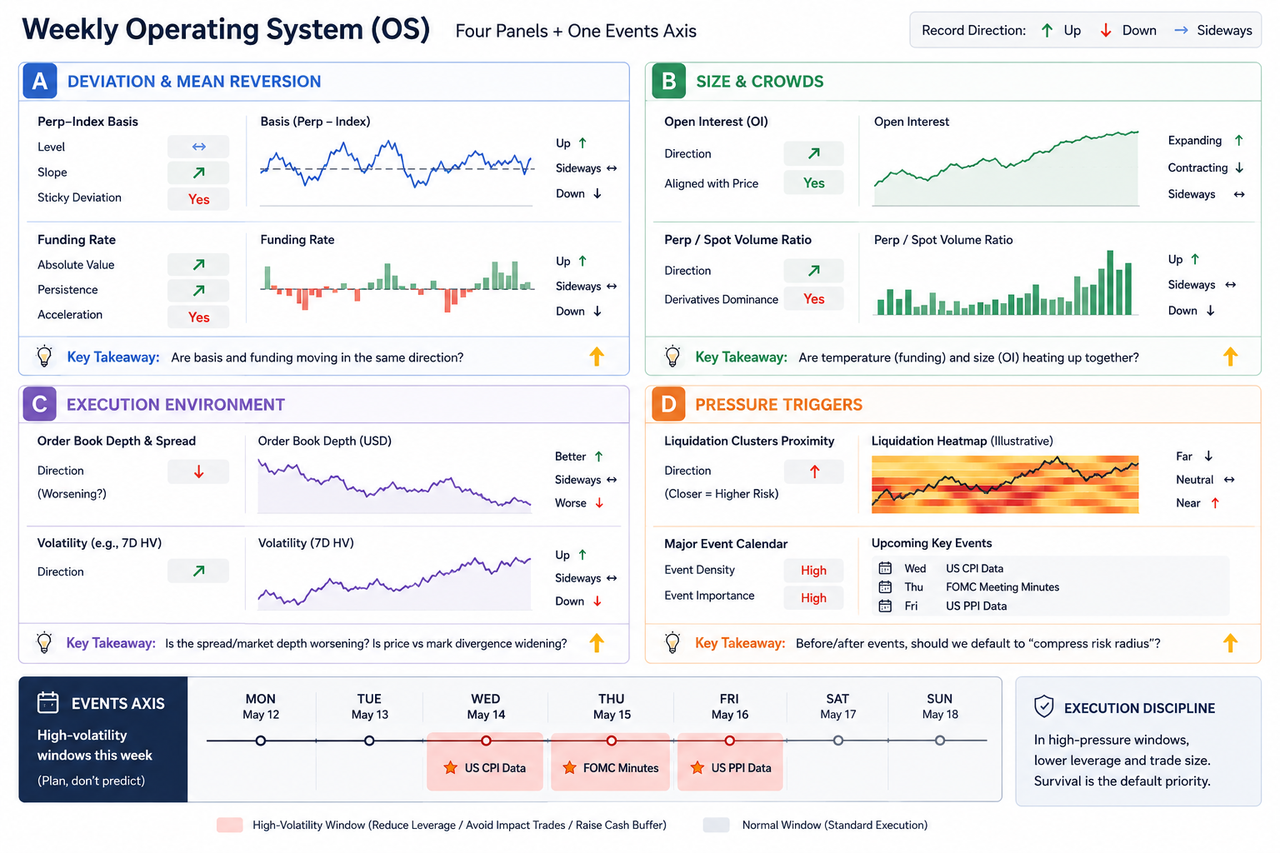
It’s recommended to use the “four panels” to compress information into a recordable weekly snapshot (just record direction: up / down / range), avoiding repeated worldview shifts due to intraday noise.
Panel A: Deviation and Correction
- Perpetual-to-index basis: level, slope, presence of “sticky large deviations”
- Funding: absolute value, persistence, acceleration
- Key observation: Do basis and funding reinforce each other (correction pressure rising)?
Panel B: Size and Crowding
- OI: Is expansion/contraction consistent with price trend?
- Perpetual vs. spot volume ratio: Are derivatives leading?
- Key observation: Are temperature (funding) and size (OI) heating up together?
Panel C: Execution Environment
- Order book depth and spread: Any systematic deterioration?
- Volatility: Entering an elevated phase?
- Key observation: Is divergence between last price and mark price widening?
Panel D: Stress Triggers
- Proximity to liquidation clusters (if visualized by tools)
- Major event calendar (macro data and policy meetings)
- Key observation: Should the default strategy be “narrow risk radius” before/after events?
Event Axis
Mark this week’s high-volatility windows—not to predict outcomes, but to standardize execution discipline: during high-pressure windows, reduce leverage and aggressive orders, making “survival” the default priority.
3. Proper Use of the Funding Thermometer: From “Contrarian Signal” to “Risk Management Trigger”
Treating funding as a thermometer means trading strategies should be written as “temperature threshold—action mapping,” not “temperature threshold—long/short mapping.” Usable mapping paradigms (illustrative, not fixed thresholds):
- Temperate zone: Structure stable; use normal strategy parameters and position granularity.
- Warming up: Rate rising notably but not extreme—prioritize reducing same-direction leverage frequency; check OI.
- High temperature: Extreme rate stagnation + OI expansion—default to vulnerability management: lower leverage multiples, reduce order size, avoid chasing.
- Sudden change: Rapid rate reversal with worsening depth—prioritize execution risk and nonlinear gaps; postpone “precise bottom/top catching.”
Core principle: The thermometer signals whether the system is enforcing correction; vulnerability determines whether forced unwinding occurs.
4. Gate TradFi Comparison Module: Homomorphic ≠ Homonymous Funding
On the TradFi (traditional finance) side, leveraged tools (such as CFD systems) commonly discuss spread, overnight interest/financing cost, margin, and forced liquidation rules. The difference from crypto perpetuals is in how cost items are expressed. Crypto perpetuals tend to make deviation costs “high-frequency explicit” as funding; TradFi CFDs more commonly express holding costs through financing/overnight rate mechanisms.
Users can trade traditional assets covered by Gate TradFi and settle in USDT to connect trading routes across asset classes; product coverage includes forex, precious metals, equity indices, US stock CFDs (single-stock contracts), energy commodities, etc., enabling configuration with crypto assets within the same platform system (see platform page and rules for details).
Four Levels of Comparative Study
- Anchoring & Deviation: Perpetuals use index + funding to constrain relative deviation; TradFi CFDs emphasize tracking relevant underlyings (indices/rates/spot quotes) and execution costs (spread, etc.).
- Holding Cost: Funding is crypto’s most explicit “holding cost signal”; on TradFi side, overnight financing/interest must be included in total position ledger.
- Leverage & Enforcement: Both face margin rules and forced action paths under high leverage; differences lie in product terms, trading hours, gap risk, and liquidity rhythm.
- Extreme Market States: Perpetuals often see liquidation chains and order book gaps; TradFi CFDs more often see overnight gaps, event-period spread widening, and layered liquidity.
The value of this comparison is in reframing “directional discussion” as a discussion of “cost structure + constraint structure”: different terms but highly similar risk sources.
5. Three Common Mistakes in Cross-Market Allocation
- Treating funding as a global indicator: Funding only applies to perpetual structures; forcing it onto TradFi products leads to incorrect narratives.
- Focusing only on direction, not total cost: The true cost list must include: fees, spread, slippage, financing cost/rate, migration and execution costs.
- Using regular position models during high-pressure windows: When volatility regimes shift, the same position parameters can imply completely different tail risks.
6. Three-Step Recap for Turning Lessons into Replicable Processes
Each week, wrap up with three questions to turn experience into rules:
- Was this week dominated by deviation, size, or execution environment?
- Was excessive leverage density maintained even in high-temperature zones?
- Were both TradFi and crypto-side cost items included in net value curve—not just price direction?
Summary
The final lesson repositions funding within the closed loop: it is both the cost readout of the correction mechanism and a thermometer for leverage crowding—but only gains stability when interpreted alongside basis, OI, order book depth, liquidation pressure, and event windows. Through Gate TradFi comparisons, overnight financing costs, spreads, and margin constraints of traditional leveraged products can be translated into the language of crypto perpetuals’ funding—moving cross-market trading from “chasing hot spots” toward “total accounting, constraint management, tail control.” This forms a long-term reusable path for the course: first identify whether the environment has entered a nonlinear state; then decide risk radius; finally select tools and direction.