#ShareYourUSStocksWinNvidia
#NVDAX
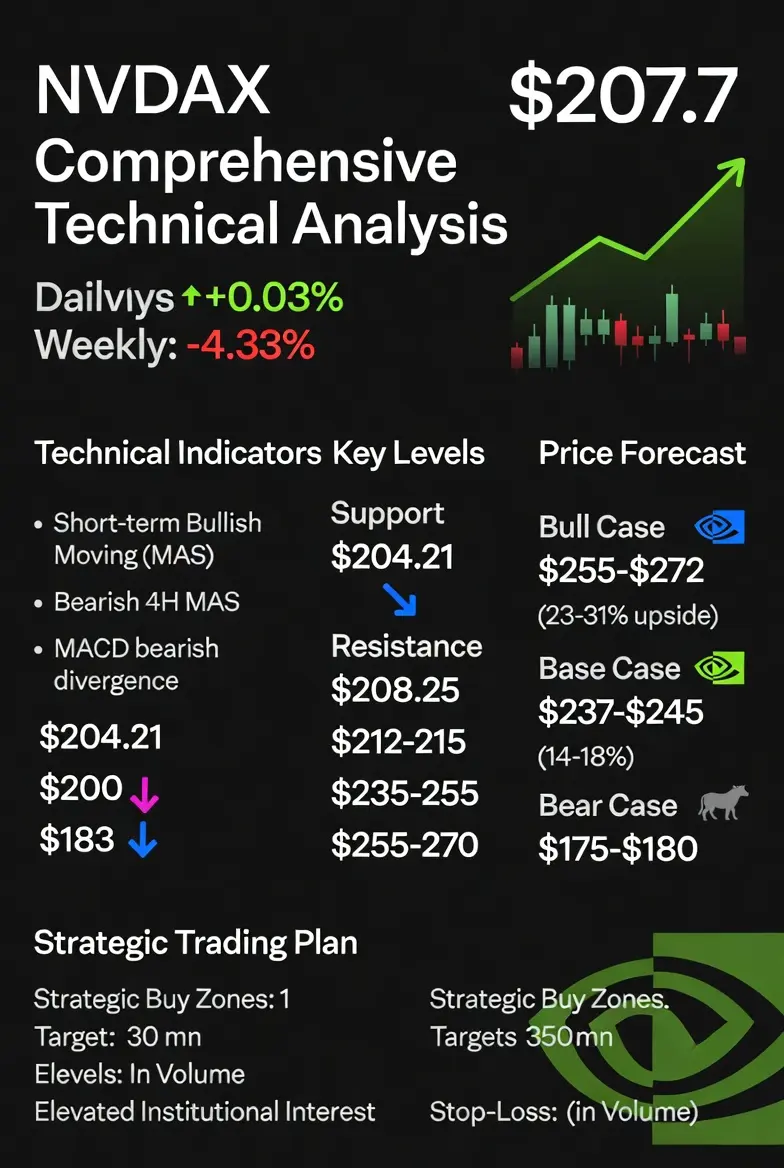
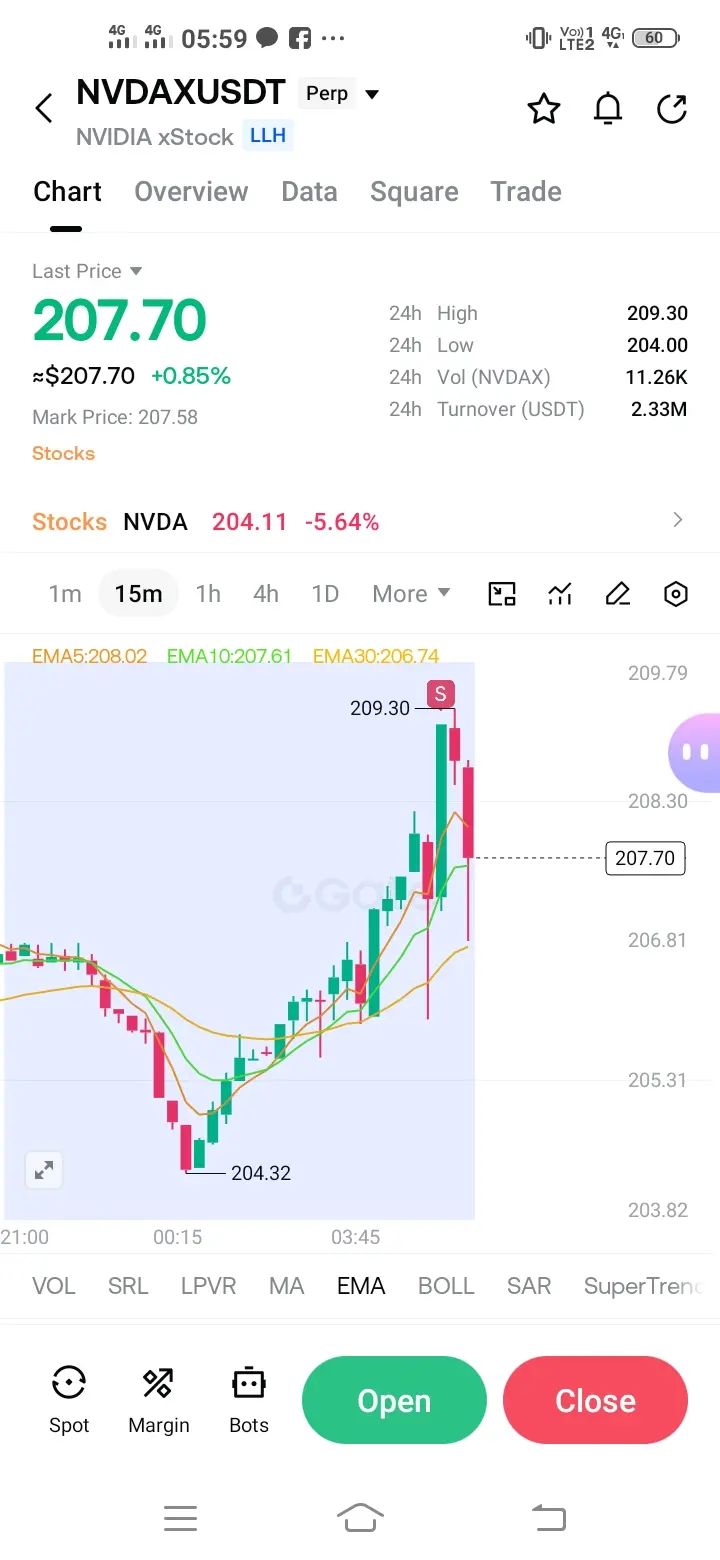
NVDAX is currently trading at $207.7, showing resilience after fluctuating between $204.21 and $208.25 over the past 24 hours. The stock has registered a modest gain of 0.03% in the daily timeframe while experiencing a pullback of 4.33% over the past week. Trading volume has seen significant expansion alongside price movements, indicating heightened institutional participation and stronger capital flows into the asset.
Technical Analysis Across Multiple Timeframes
On the 15-minute chart, NVDAX displays a bullish moving average alignment with MA7 positioned above MA30 and MA120, suggesting short-term upward momentum. However, both the CCI and Williams Percentage Range indicators have entered overbought territory, signaling potential exhaustion in buying pressure and the possibility of a near-term correction. Traders should exercise caution as these oscillators approach extreme levels.
The 4-hour timeframe presents a contrasting picture with a bearish moving average configuration where MA7 sits below MA30 and MA120, indicating a clear downtrend in the medium-term perspective. This divergence between short-term and medium-term signals suggests consolidation or range-bound behavior may persist in the immediate future.
Daily timeframe analysis reveals a concerning MACD bearish divergence pattern where price has achieved new highs while the DIF line failed to confirm this movement. This classic technical signal often precedes short-term pullbacks and warrants defensive positioning for risk-averse traders.
Critical Support and Resistance Levels
Immediate support is established at approximately $204.21, representing the recent 24-hour low and a key demand zone where buyers have previously stepped in. A secondary support level exists around $200, which aligns with psychological round-number support and previous consolidation areas. The major support floor is located at $183, based on medium-term trend analysis, where substantial buying interest would be expected to emerge.
On the resistance side, immediate resistance stands at $208.25, marking the recent 24-hour high. A decisive break above this level could open the path toward $212-$215, representing the next congestion zone. The significant resistance cluster exists between $235 and $255, where prior price rejection and profit-taking activities have been observed. Analyst price targets from major institutions cluster around $255-$270, with some bullish projections extending toward $272 based on fundamental catalysts.
Price Forecast and Scenario Analysis
The bull case for NVDAX remains compelling despite recent consolidation. Fundamental drivers include the ongoing Blackwell architecture ramp, accelerating agentic AI demand, and full-stack platform stickiness that increases customer switching costs. Meta Platforms has committed to millions of Blackwell and Rubin GPUs, while OpenAI is building more than 10 gigawatts of NVIDIA systems. CEO Jensen Huang has indicated the company sees at least $1 trillion in orders for Blackwell and Vera Rubin through 2027. Under this optimistic scenario, price targets of $255-$272 appear achievable over the next 12 months, representing upside potential of approximately 23-31% from current levels.
The base case scenario assumes continued execution on revenue guidance of approximately $78 billion for Q1 FY2027, stable gross margins around 75%, and gradual recovery in China Data Center contributions. This outlook supports a price target of $237-$245, consistent with consensus analyst estimates and representing 14-18% upside potential.
The bear case centers on geopolitical risks, particularly the complete exclusion of China Data Center compute contribution from guidance, estimated at approximately $50 billion in addressable market. Concentration risk from hyperscalers representing 50% of Data Center revenue presents additional vulnerability. Should these headwinds materialize alongside broader tech sector weakness, support at $183 becomes critical, with potential downside extending toward $175-$180 in a risk-off environment.
Strategic Trading Plan
For active traders, the current price action suggests a range-bound approach between $204 support and $208 resistance. Consider initiating long positions on confirmed breaks above $208.25 with targets at $212, $215, and eventually $235. Stop-loss orders should be placed below $203 to protect against false breakouts.
Swing traders might accumulate positions near the $204-$205 support zone with a medium-term horizon targeting $235-$255. Risk management remains paramount given the bearish MACD divergence on the daily chart, suggesting position sizing should reflect elevated volatility expectations.
Investors with longer time horizons can view current levels as accumulation opportunities, particularly on any weakness toward $200 or the $183 support level. The structural AI infrastructure demand narrative remains intact, and valuation compression from previous highs has improved the risk-reward profile for patient capital.
Volume analysis confirms institutional interest remains robust, with 24-hour trading activity significantly elevated. This liquidity environment supports efficient execution for both entry and exit strategies. Monitor earnings announcements, guidance updates, and geopolitical developments closely as these catalysts will likely determine the next directional move.
Risk management protocols should include strict stop-loss discipline, position sizing appropriate for account risk tolerance, and awareness of the 4-hour bearish trend alignment that may produce headwinds for bullish positions in the near term.@Gate_Square #Web3SecurityGuide #GMTokenLaunchAndPromotion #CryptoSurvivalGuide
#NVDAX
NVDAX is currently trading at $207.7, showing resilience after fluctuating between $204.21 and $208.25 over the past 24 hours. The stock has registered a modest gain of 0.03% in the daily timeframe while experiencing a pullback of 4.33% over the past week. Trading volume has seen significant expansion alongside price movements, indicating heightened institutional participation and stronger capital flows into the asset.
Technical Analysis Across Multiple Timeframes
On the 15-minute chart, NVDAX displays a bullish moving average alignment with MA7 positioned above MA30 and MA120, suggesting short-term upward momentum. However, both the CCI and Williams Percentage Range indicators have entered overbought territory, signaling potential exhaustion in buying pressure and the possibility of a near-term correction. Traders should exercise caution as these oscillators approach extreme levels.
The 4-hour timeframe presents a contrasting picture with a bearish moving average configuration where MA7 sits below MA30 and MA120, indicating a clear downtrend in the medium-term perspective. This divergence between short-term and medium-term signals suggests consolidation or range-bound behavior may persist in the immediate future.
Daily timeframe analysis reveals a concerning MACD bearish divergence pattern where price has achieved new highs while the DIF line failed to confirm this movement. This classic technical signal often precedes short-term pullbacks and warrants defensive positioning for risk-averse traders.
Critical Support and Resistance Levels
Immediate support is established at approximately $204.21, representing the recent 24-hour low and a key demand zone where buyers have previously stepped in. A secondary support level exists around $200, which aligns with psychological round-number support and previous consolidation areas. The major support floor is located at $183, based on medium-term trend analysis, where substantial buying interest would be expected to emerge.
On the resistance side, immediate resistance stands at $208.25, marking the recent 24-hour high. A decisive break above this level could open the path toward $212-$215, representing the next congestion zone. The significant resistance cluster exists between $235 and $255, where prior price rejection and profit-taking activities have been observed. Analyst price targets from major institutions cluster around $255-$270, with some bullish projections extending toward $272 based on fundamental catalysts.
Price Forecast and Scenario Analysis
The bull case for NVDAX remains compelling despite recent consolidation. Fundamental drivers include the ongoing Blackwell architecture ramp, accelerating agentic AI demand, and full-stack platform stickiness that increases customer switching costs. Meta Platforms has committed to millions of Blackwell and Rubin GPUs, while OpenAI is building more than 10 gigawatts of NVIDIA systems. CEO Jensen Huang has indicated the company sees at least $1 trillion in orders for Blackwell and Vera Rubin through 2027. Under this optimistic scenario, price targets of $255-$272 appear achievable over the next 12 months, representing upside potential of approximately 23-31% from current levels.
The base case scenario assumes continued execution on revenue guidance of approximately $78 billion for Q1 FY2027, stable gross margins around 75%, and gradual recovery in China Data Center contributions. This outlook supports a price target of $237-$245, consistent with consensus analyst estimates and representing 14-18% upside potential.
The bear case centers on geopolitical risks, particularly the complete exclusion of China Data Center compute contribution from guidance, estimated at approximately $50 billion in addressable market. Concentration risk from hyperscalers representing 50% of Data Center revenue presents additional vulnerability. Should these headwinds materialize alongside broader tech sector weakness, support at $183 becomes critical, with potential downside extending toward $175-$180 in a risk-off environment.
Strategic Trading Plan
For active traders, the current price action suggests a range-bound approach between $204 support and $208 resistance. Consider initiating long positions on confirmed breaks above $208.25 with targets at $212, $215, and eventually $235. Stop-loss orders should be placed below $203 to protect against false breakouts.
Swing traders might accumulate positions near the $204-$205 support zone with a medium-term horizon targeting $235-$255. Risk management remains paramount given the bearish MACD divergence on the daily chart, suggesting position sizing should reflect elevated volatility expectations.
Investors with longer time horizons can view current levels as accumulation opportunities, particularly on any weakness toward $200 or the $183 support level. The structural AI infrastructure demand narrative remains intact, and valuation compression from previous highs has improved the risk-reward profile for patient capital.
Volume analysis confirms institutional interest remains robust, with 24-hour trading activity significantly elevated. This liquidity environment supports efficient execution for both entry and exit strategies. Monitor earnings announcements, guidance updates, and geopolitical developments closely as these catalysts will likely determine the next directional move.
Risk management protocols should include strict stop-loss discipline, position sizing appropriate for account risk tolerance, and awareness of the 4-hour bearish trend alignment that may produce headwinds for bullish positions in the near term.@Gate_Square #Web3SecurityGuide #GMTokenLaunchAndPromotion #CryptoSurvivalGuide