大牛加密论
用户暂无简介
以太日线回踩企稳蓄势待发,多头重拾升势,下周剑指2500!
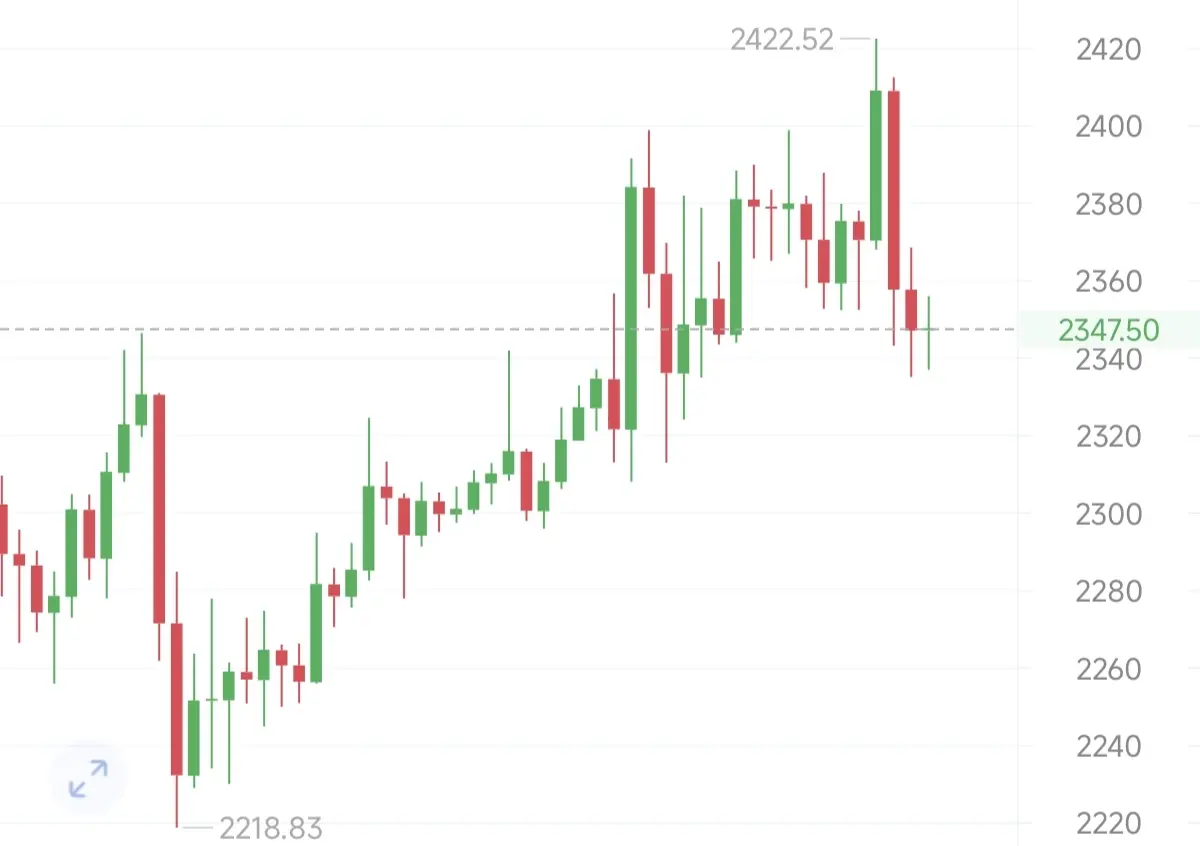
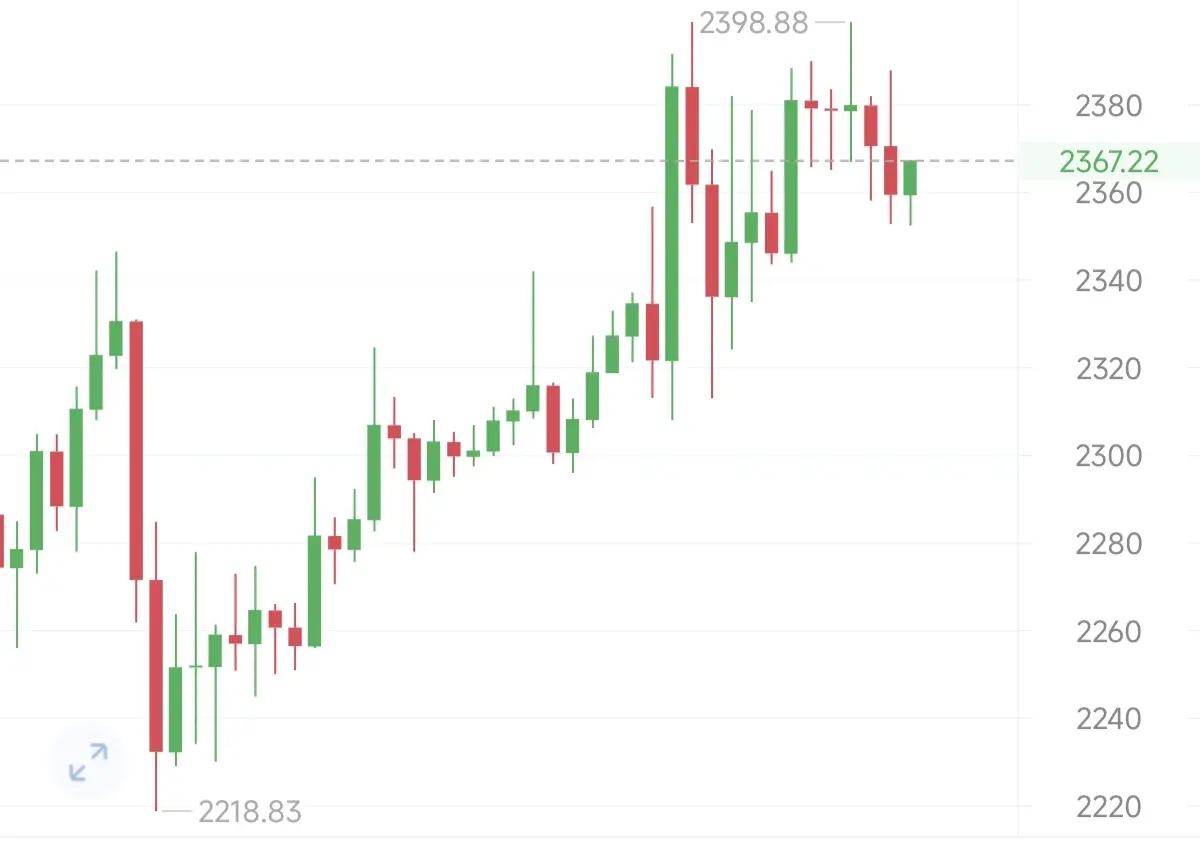
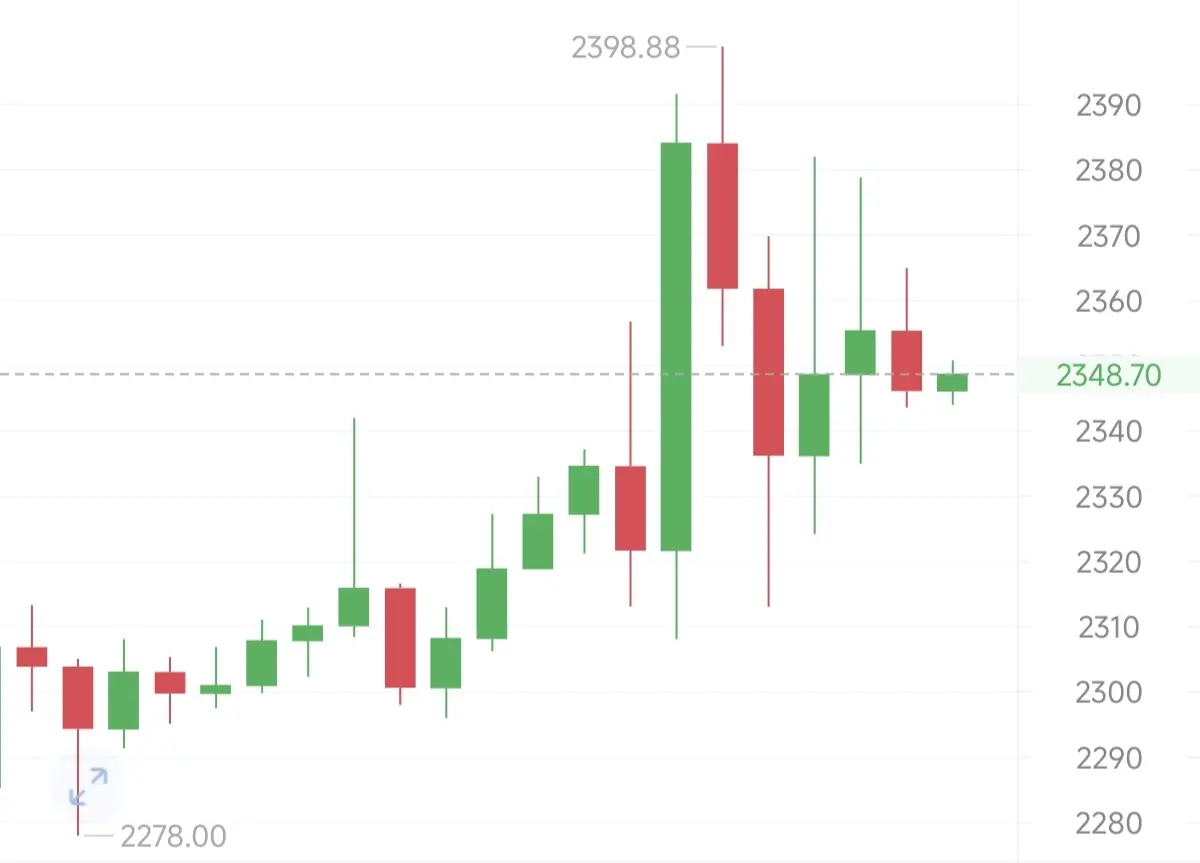
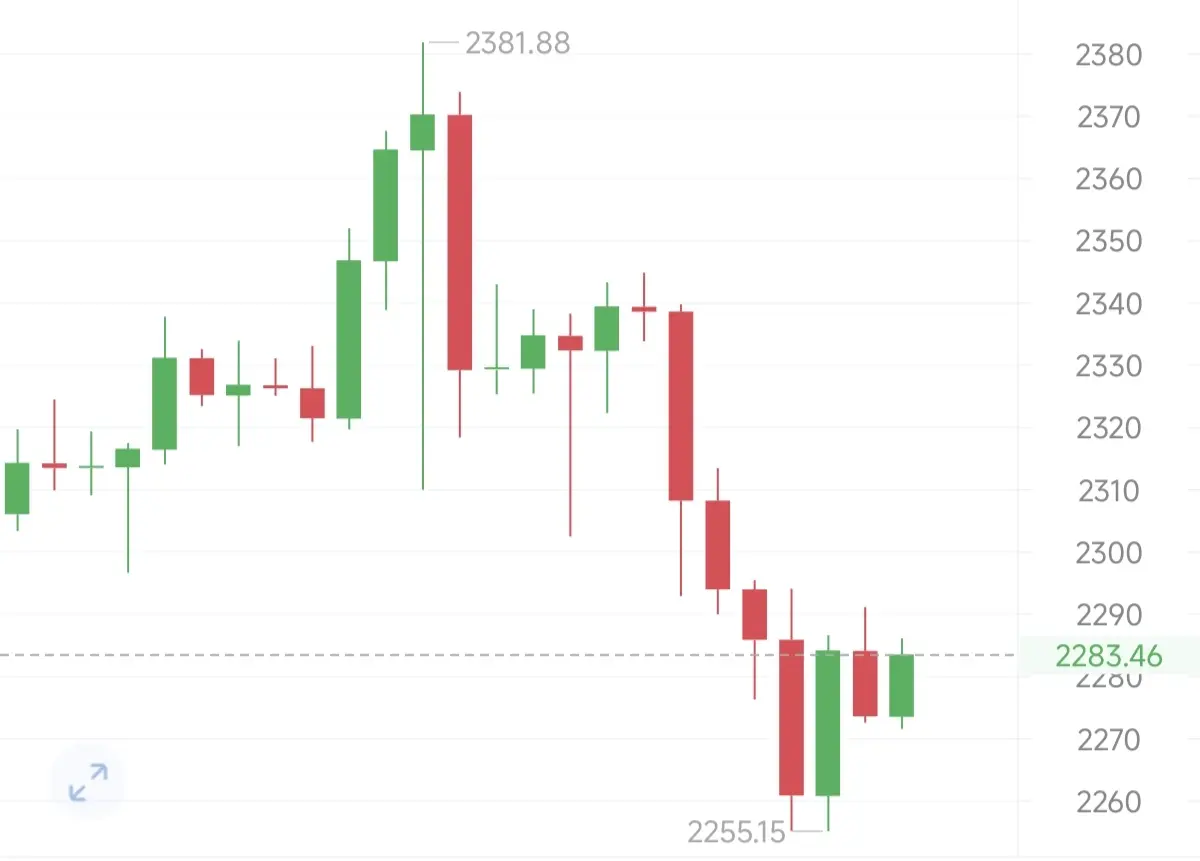
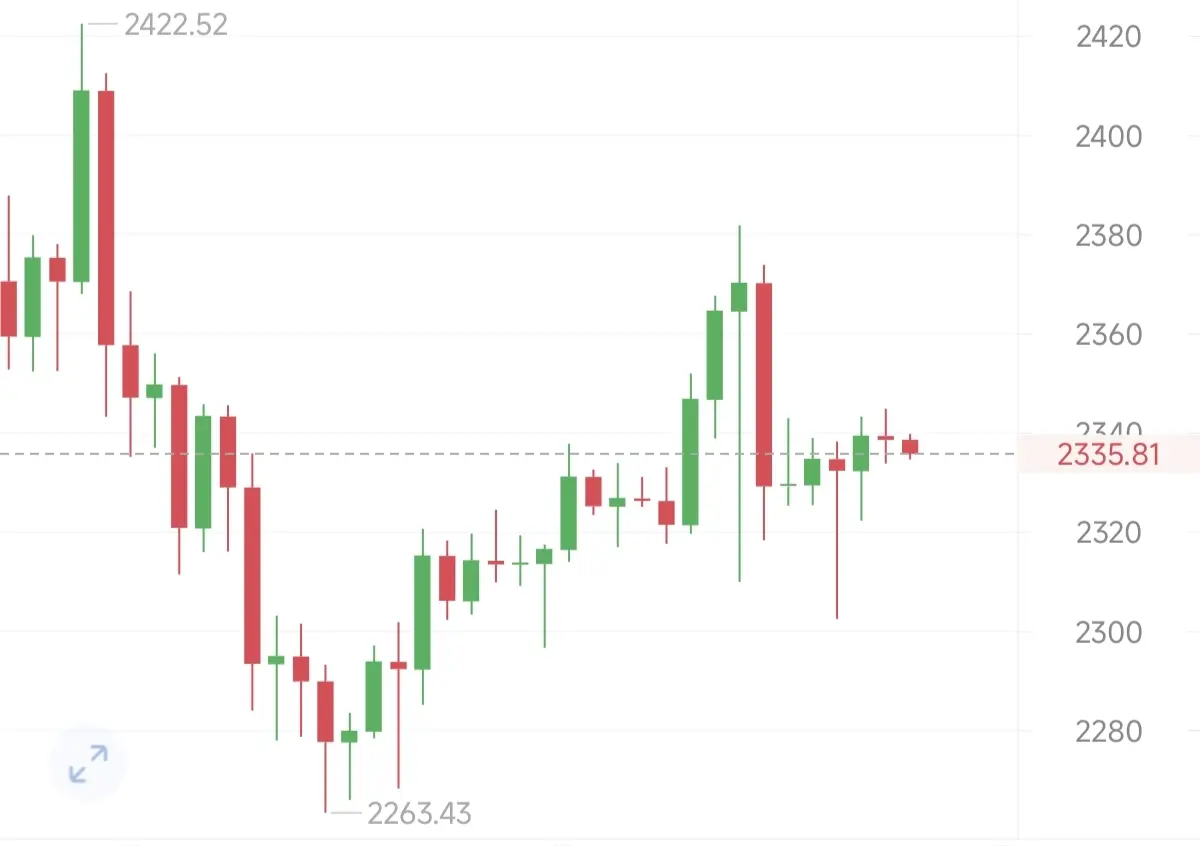
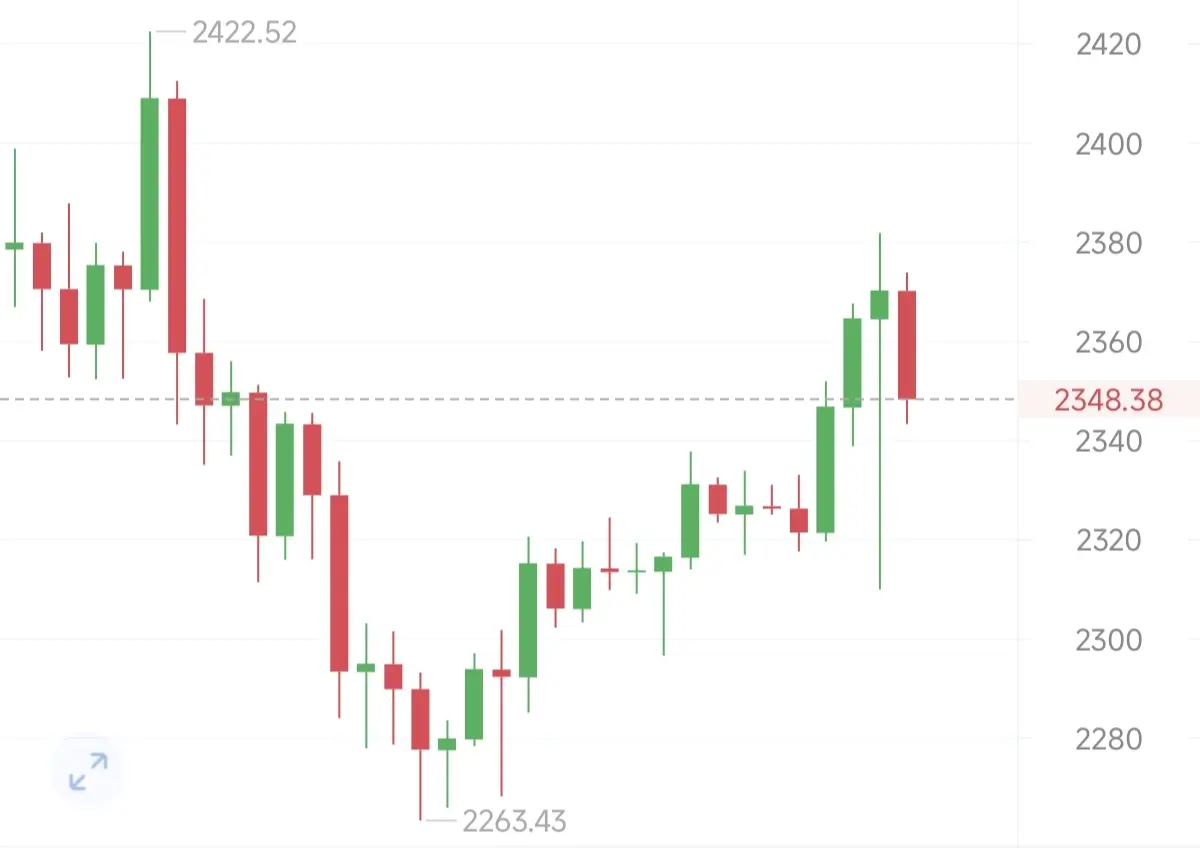
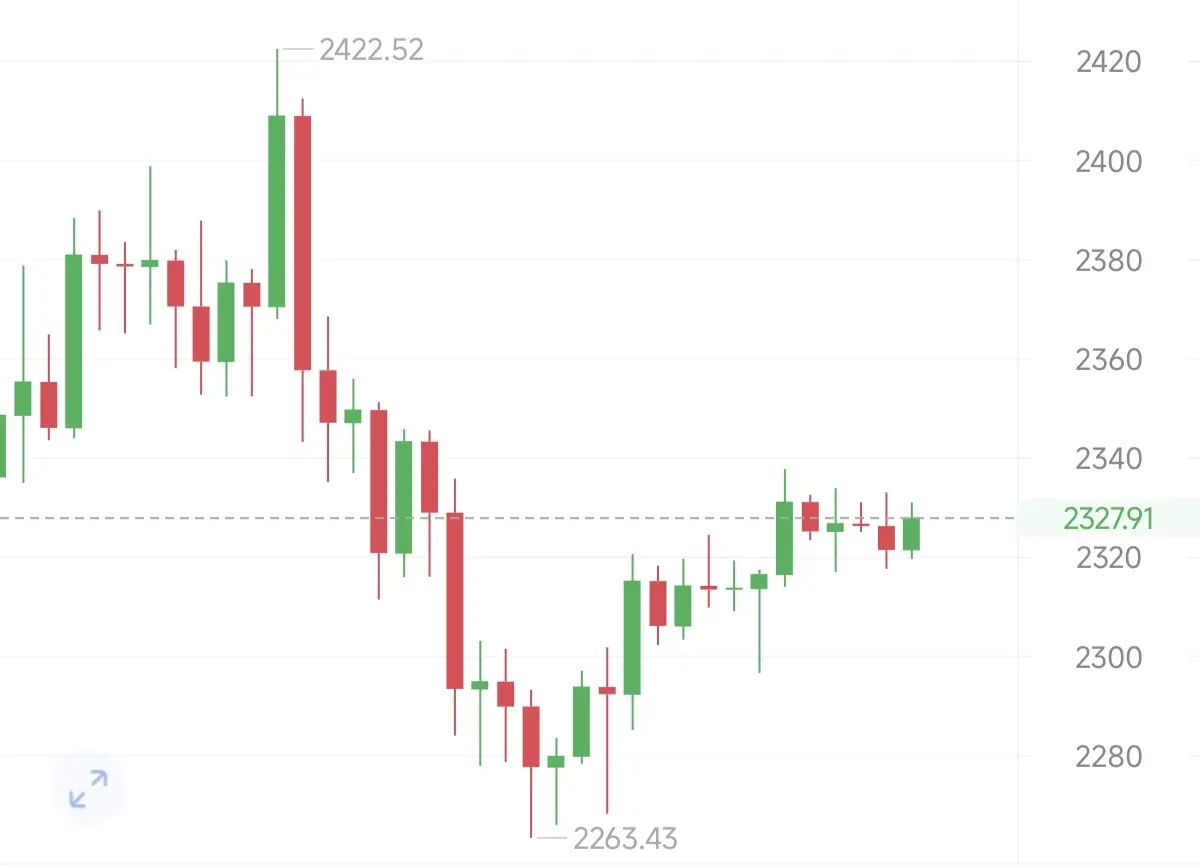
本周以太整体呈现探底回升的震荡修复格局。周初价格在2300上方运行,随后在周三触及2422高点后遇阻回落,周四周五砸盘,最低下探至2263附近,完成了一次深度洗盘。好在周五及周末价格迅速探底回升,收出下影线的阳线,目前价格已重回2327附近。全周虽然经历了剧烈波动,但最终收盘价守住了关键支撑位,确立了短期的底部,为多头反击奠定了基础。
综合来看,以太在经历了一波深幅回调后,已经成功在2250-2260强支撑区企稳,多头资金开始重新入场。下周重点关注上方2380-2400的压力区间,一旦有效突破并站稳,将彻底打开上行空间,直击前期高点甚至更高。
2300附近直接多,目标先看2430,破位上看2500。
$BTC $ETH
- 赞赏
- 点赞
- 评论
- 转发
- 分享
大饼日线连阳震荡蓄势,多头趋势未改,下周剑指85000!
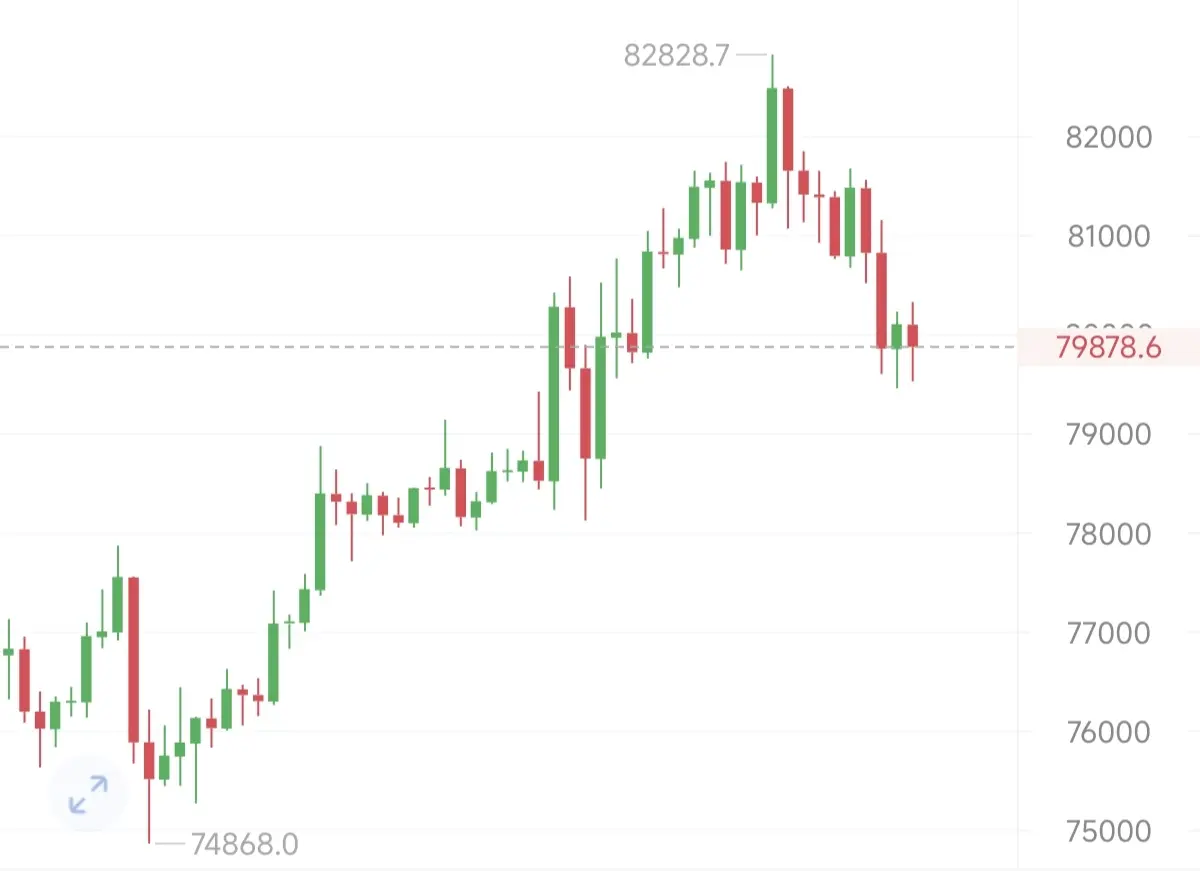
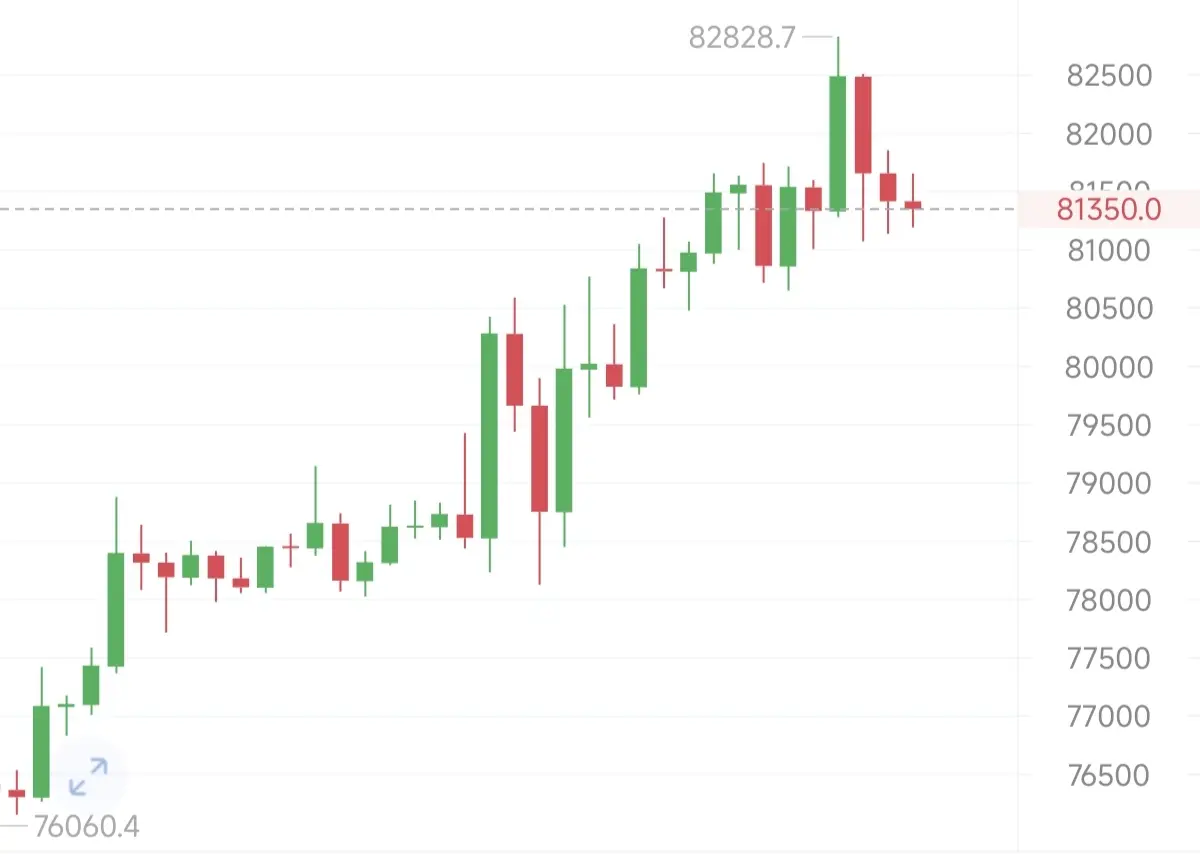
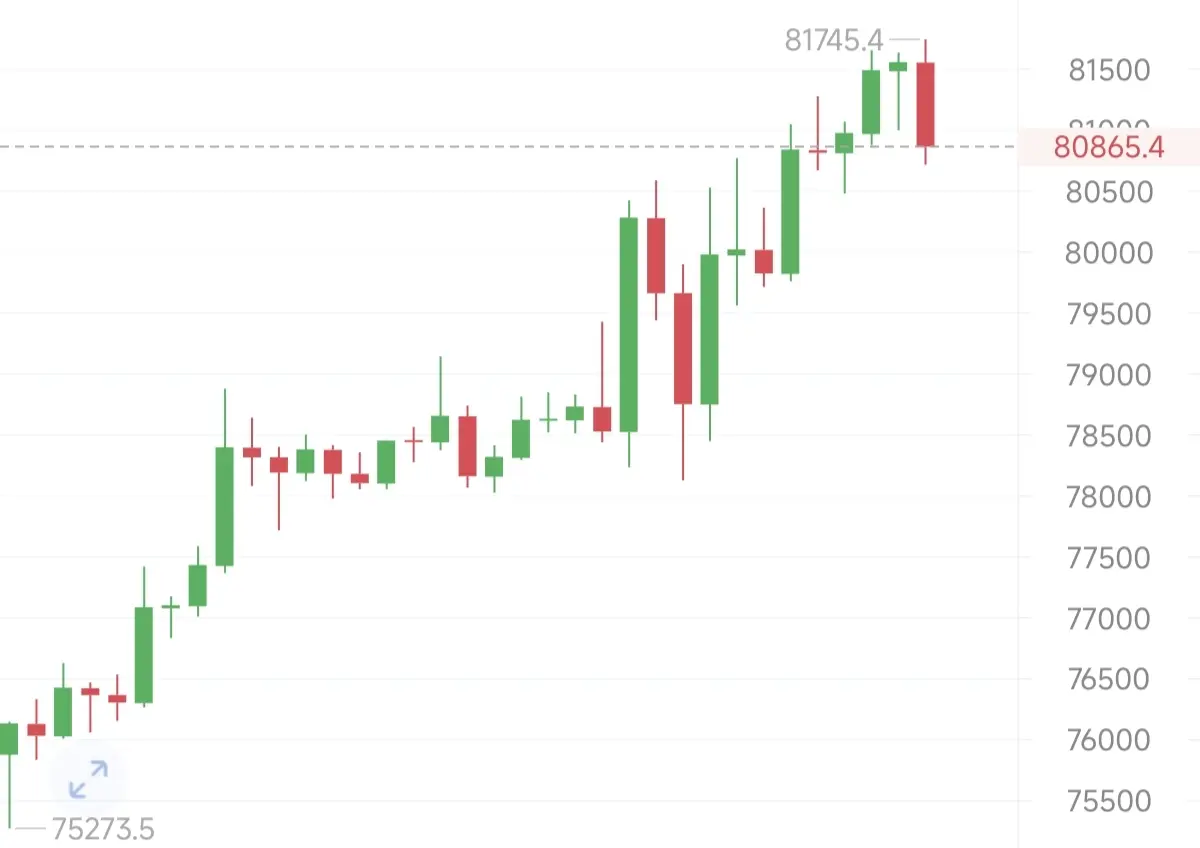
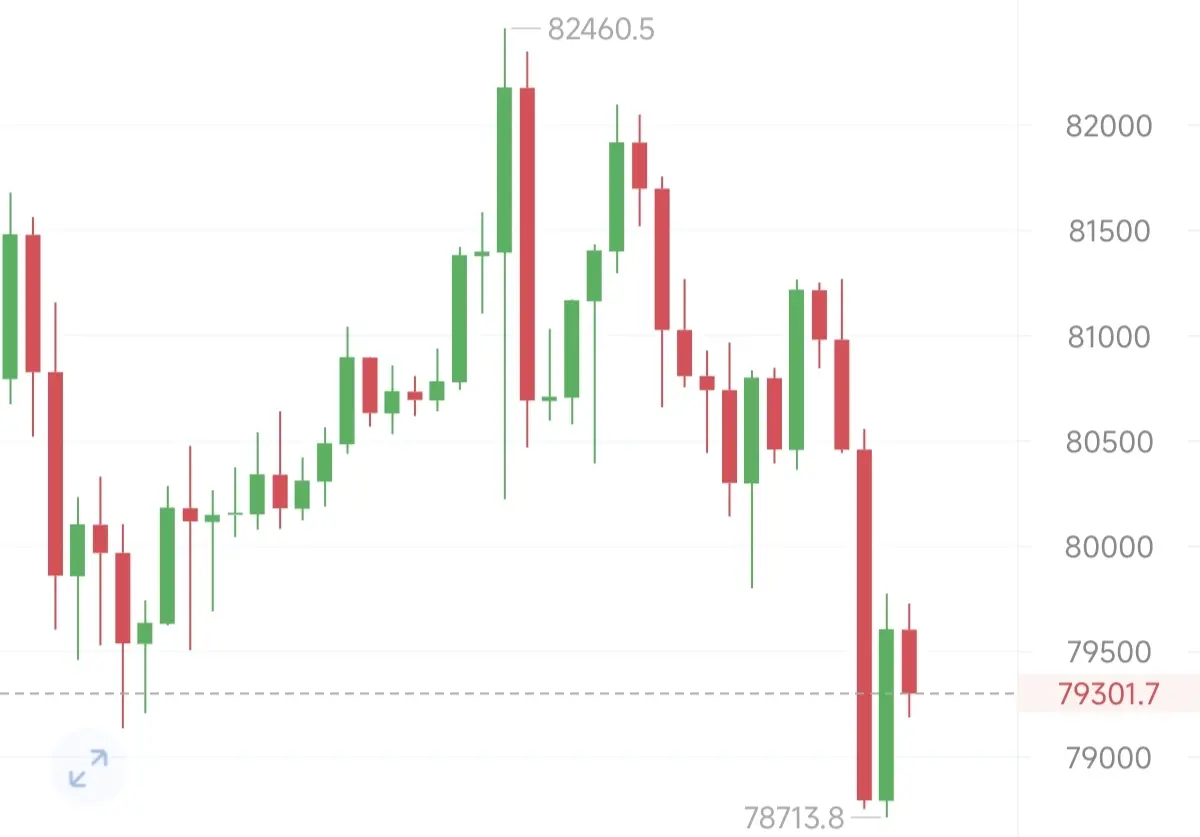
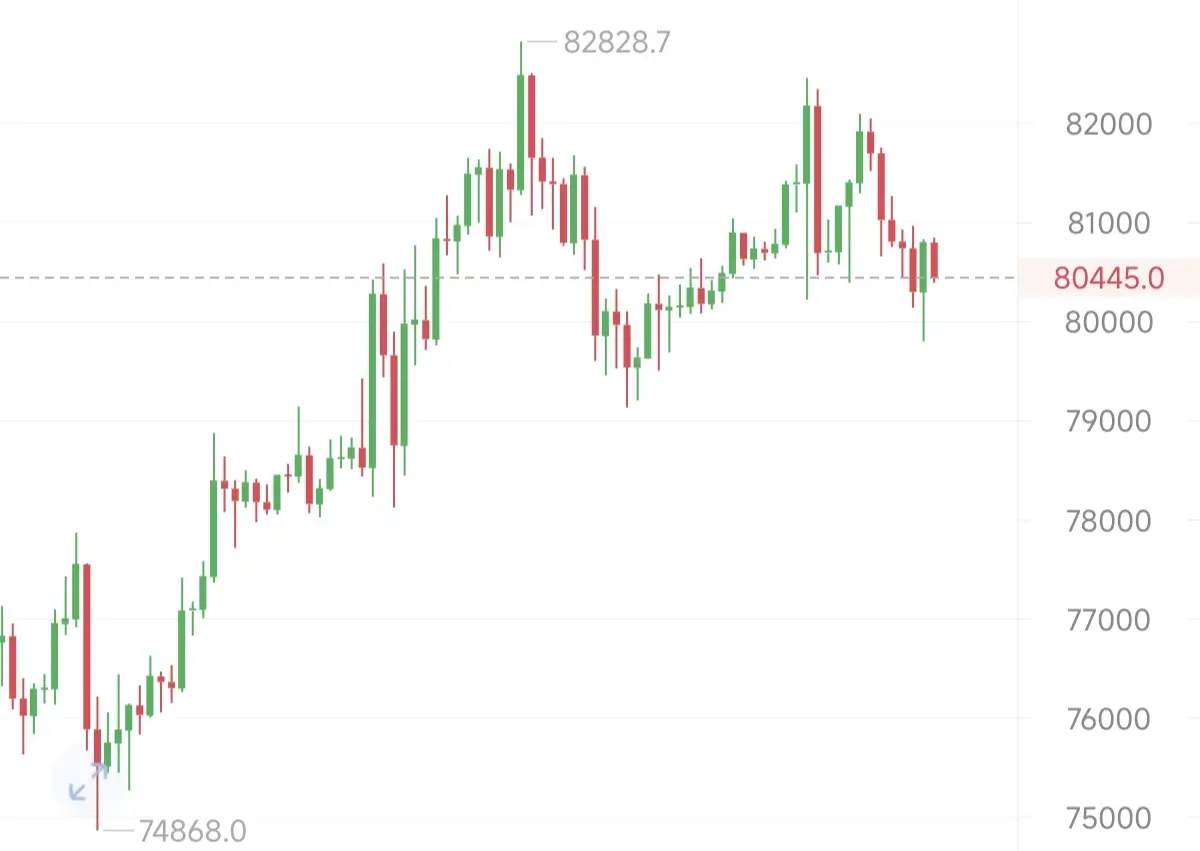
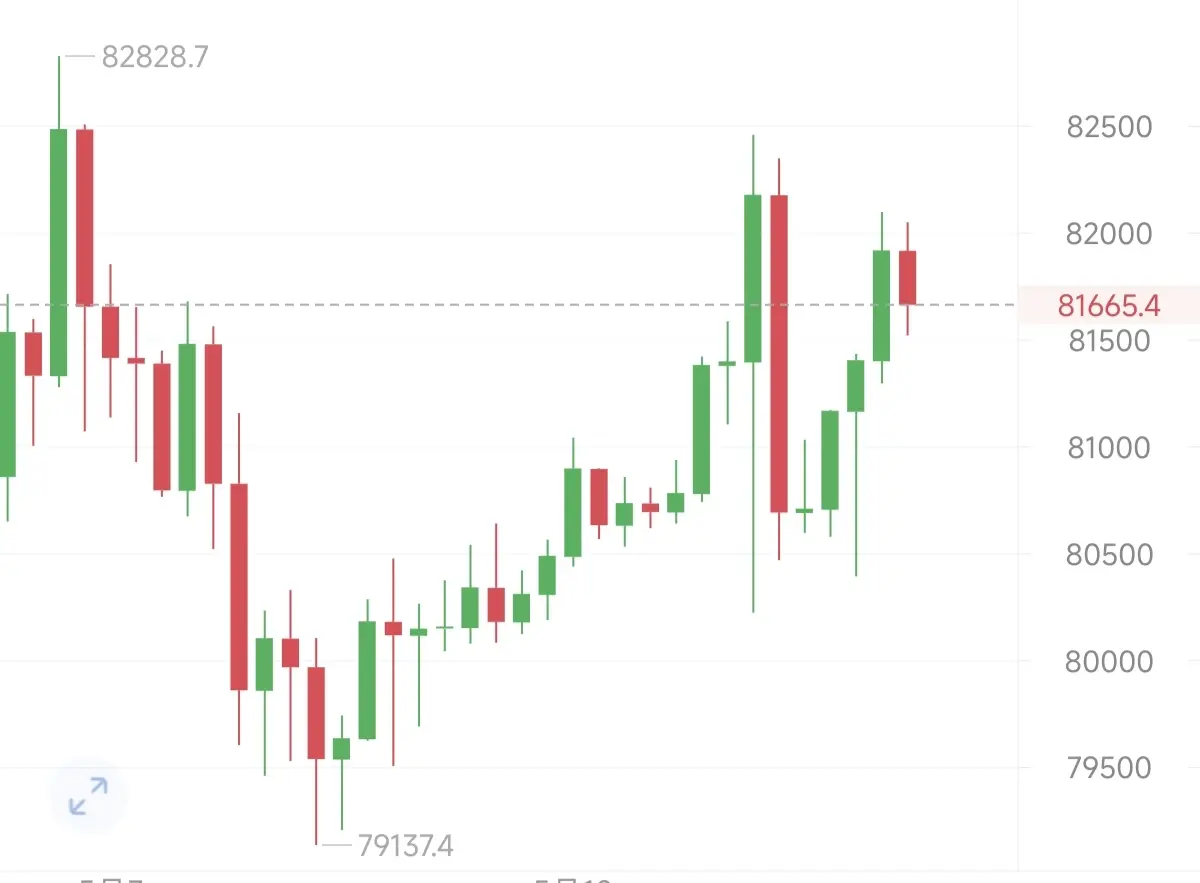
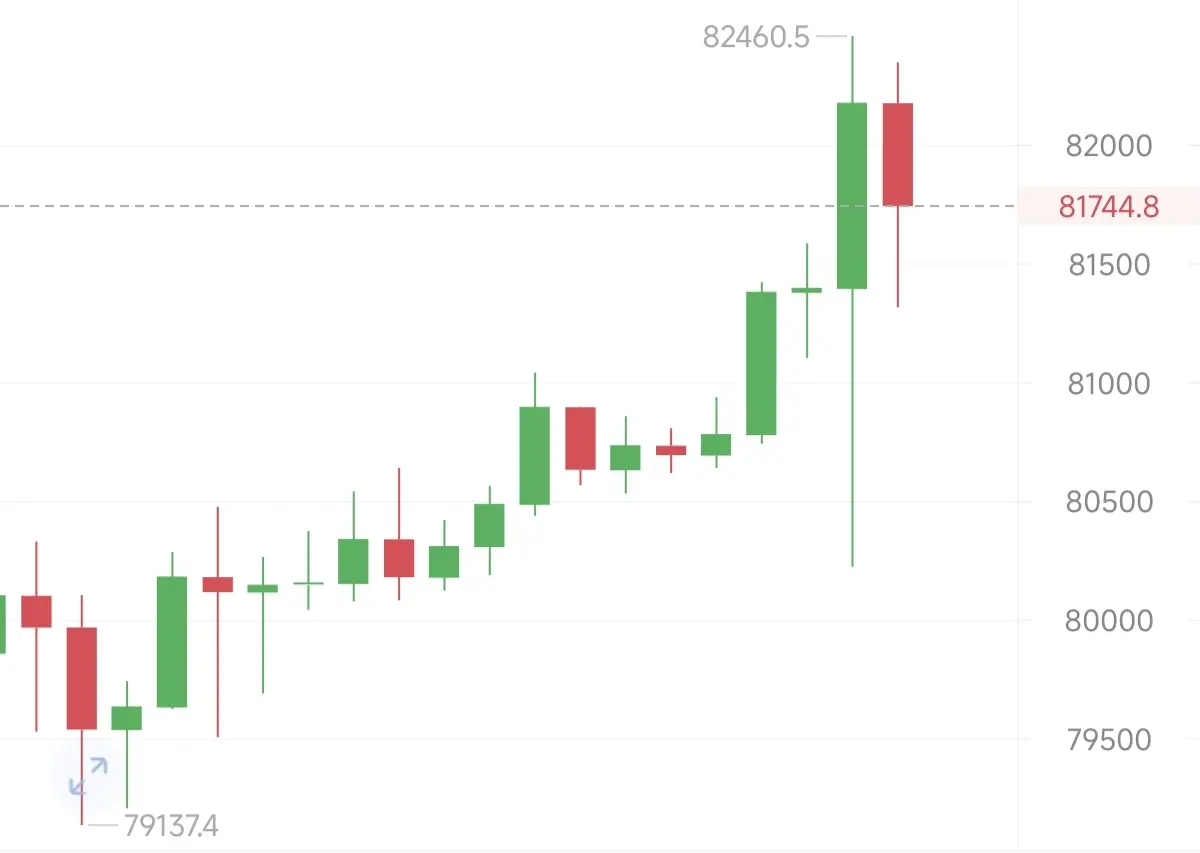
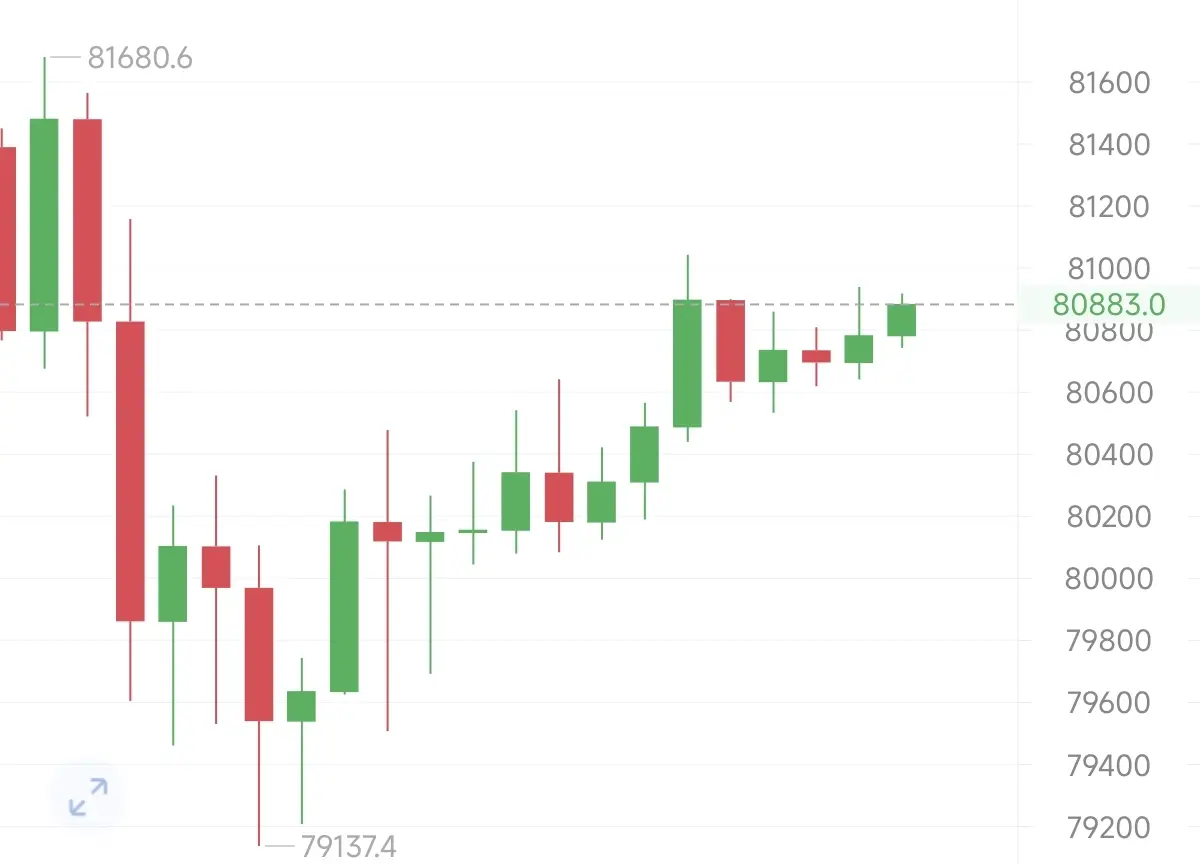
本周大饼整体呈现强势震荡整理格局。周初价格在78000附近企稳后,依托下方支撑展开反弹,于周一周二连续收出实体饱满的阳线,一度冲高测试82800上方压力区间。虽然周四周五在高位遭遇一定抛压,出现小幅回调。多头格局保持完好,为下周蓄势。
综合来看,大饼目前处于上涨中继的震荡洗盘阶段。主力在测试前高后主动回撤,目的是消化获利盘并蓄力。下周重点关注下方80000及中轨78500支撑,只要不破此区域,多头趋势将不可逆转。一旦有效站稳81000并突破前高82800,价格将打开新的上行空间,直击83500甚至85000一线。
79500附近直接多,目标先看82900,破位上看85000。
$BTC $ETH #BTC重返8万
- 赞赏
- 点赞
- 评论
- 转发
- 分享