币圈参谋长
用户暂无简介
币圈参谋长
📣5/7以太坊趋势详细解析及稳健操作建议分享:
昨日以太坊空单2350-2370再次获利出局,以太坊4小时级别从高点2422.52快速回落,完成冲高回落走跌,前期反弹趋势终结,转入短期回调下跌行情。
四小时以太坊指标信号解读:
BOLL布林带
中轨2359.86、上轨2401.10、下轨2318.62
价格跌破布林中轨,运行在中轨与下轨之间,短期弱势空头格局,价格逼近布林下轨支撑2318附近,短期存在超跌反弹需求。
MACD
DIF=3.59,DEA=11.10,DIF下穿DEA形成死叉
MACD绿柱持续放大,空头动能正在增强,双线持续向下发散,中期上涨趋势被破坏,下跌趋势延续。
KDJ
K=21.42,D=29.62,J=5.00
J值进入超卖区间,短期下行空间被大幅压缩,K、D双线低位向下发散,短期反弹信号尚未确认,仍有探底惯性。
关键支撑/压力:
强支撑:2311-2318区间(日内低点+布林下轨),跌破则打开更深下跌空间
第一压力:2360附近(布林中轨),站稳这里才能修复弱势格局
强压力:2400-2422前期高点
以太坊操作建议:
空单思路:建议以太坊2330-2350区间继续空单进场,目标点位:2300-2260,盈利空间自行把控,止损2400!
策略具有时效性,实施策略以免费指导为
ETH0.72%

- 赞赏
- 点赞
- 评论
- 转发
- 分享
📣5/7以太坊趋势详细解析及稳健操作建议分享:
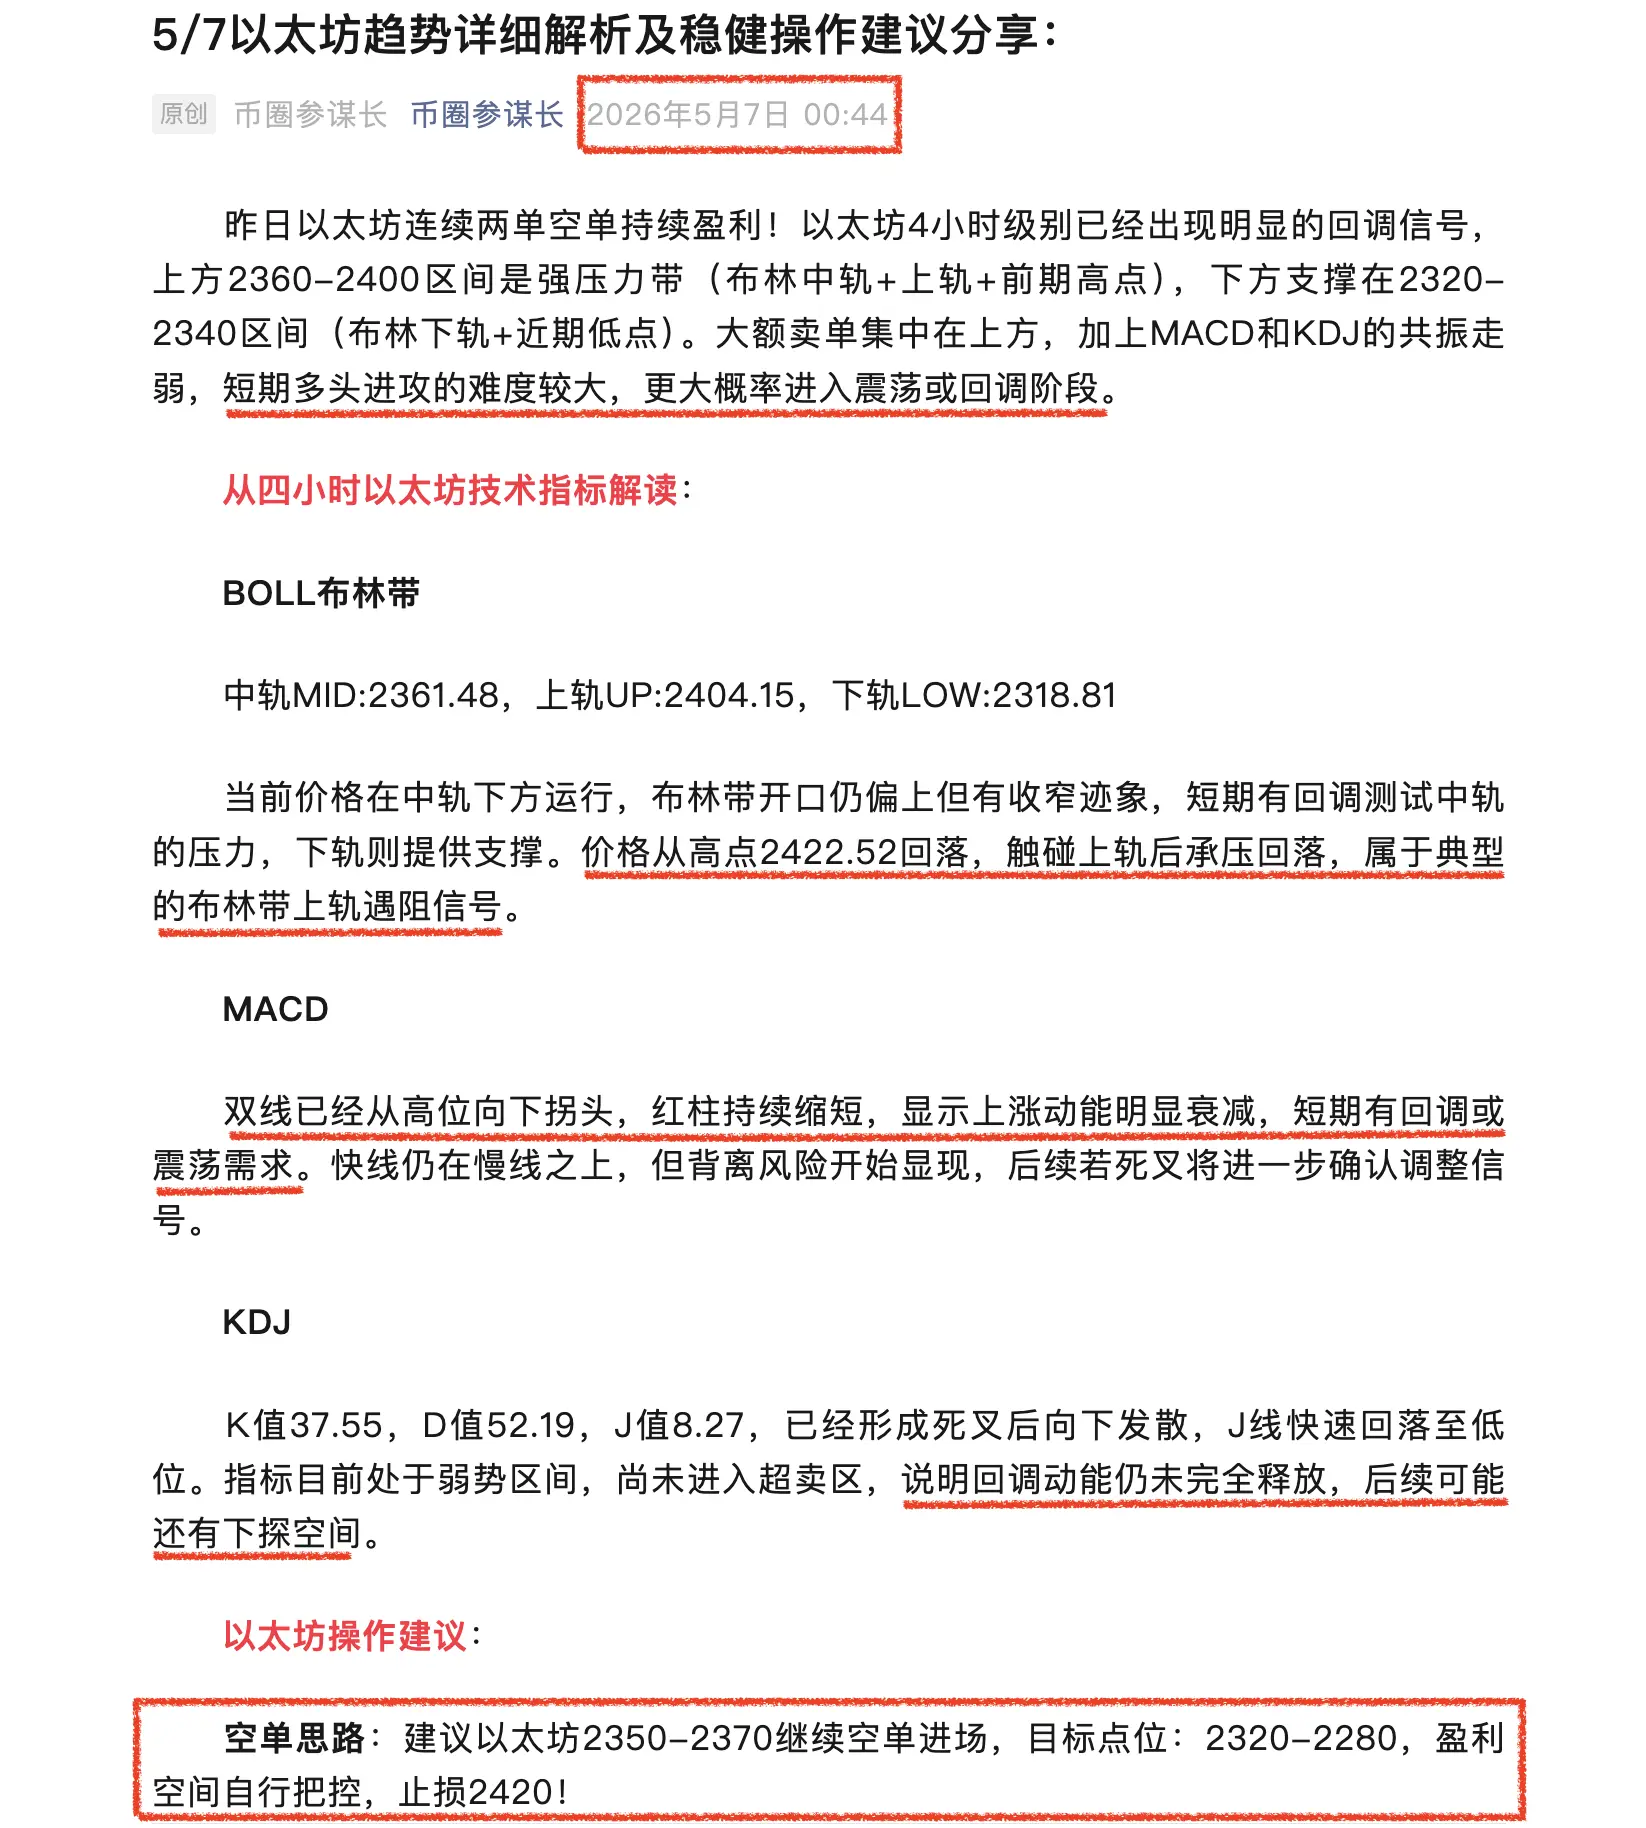
昨日以太坊连续两单空单持续盈利!以太坊4小时级别已经出现明显的回调信号,上方2360-2400区间是强压力带(布林中轨+上轨+前期高点),下方支撑在2320-2340区间(布林下轨+近期低点)。大额卖单集中在上方,加上MACD和KDJ的共振走弱,短期多头进攻的难度较大,更大概率进入震荡或回调阶段。
从四小时以太坊技术指标解读:
BOLL布林带
中轨MID:2361.48,上轨UP:2404.15,下轨LOW:2318.81
当前价格在中轨下方运行,布林带开口仍偏上但有收窄迹象,短期有回调测试中轨的压力,下轨则提供支撑。价格从高点2422.52回落,触碰上轨后承压回落,属于典型的布林带上轨遇阻信号。
MACD
双线已经从高位向下拐头,红柱持续缩短,显示上涨动能明显衰减,短期有回调或震荡需求。快线仍在慢线之上,但背离风险开始显现,后续若死叉将进一步确认调整信号。
KDJ
K值37.55,D值52.19,J值8.27,已经形成死叉后向下发散,J线快速回落至低位。指标目前处于弱势区间,尚未进入超卖区,说明回调动能仍未完全释放,后续可能还有下探空间。
以太坊操作建议:
空单思路:建议以太坊2350-2370继续空单进场,目标点位:2320-2280,盈利空间自行把控,止损2420!
策略具有时效
ETH0.72%

- 赞赏
- 点赞
- 评论
- 转发
- 分享
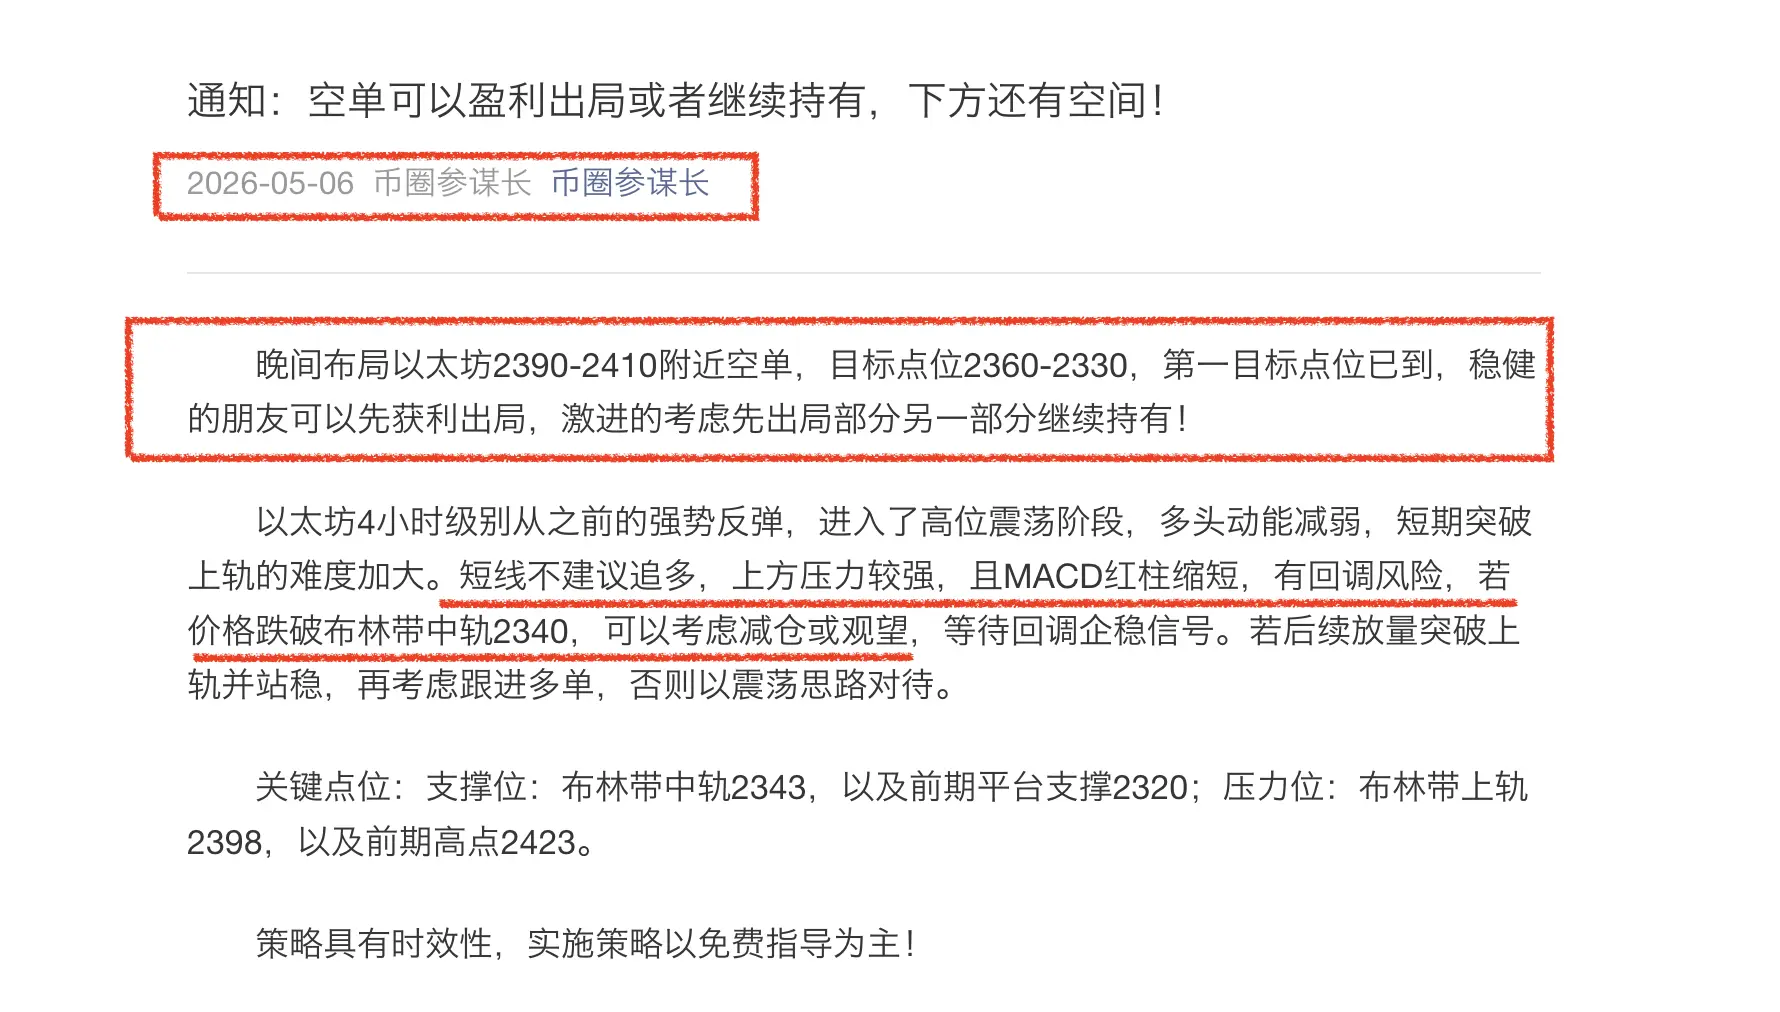
📣通知:空单可以盈利出局或者继续持有,下方还有空间!
晚间布局以太坊2390-2410附近空单,目标点位2960-2930,第一目标点位已到,稳健的朋友可以先获利出局,激进的考虑先出局部分另一部分继续持有!
以太坊4小时级别从之前的强势反弹,进入了高位震荡阶段,多头动能减弱,短期突破上轨的难度加大。短线不建议追多,上方压力较强,且MACD红柱缩短,有回调风险,若价格跌破布林带中轨2340,可以考虑减仓或观望,等待回调企稳信号。若后续放量突破上轨并站稳,再考虑跟进多单,否则以震荡思路对待。
关键点位:支撑位:布林带中轨2343,以及前期平台支撑2320;压力位:布林带上轨2398,以及前期高点2423。
策略具有时效性,实施策略以免费指导为主!$BTC $ETH #美国寻求战略比特币储备 #比特币ETF期权持仓限额增4倍 #DeFi4月安全事件损失超6亿美元
ETH0.72%

- 赞赏
- 点赞
- 评论
- 转发
- 分享
📣5/5以太坊趋势详细解析及稳健操作建议分享:
上周以太坊收益单已经连续很久,跟上操作的投资者都知道!以太坊4小时周期内,价格站稳布林中轨,MACD多头排列,整体偏多头趋势,短期上方压力在布林上轨2398附近,强压力可看前高2463.86。第一支撑布林中轨2340,第二支撑2300整数关口,跌破则可能重回震荡区间。
四小时以太坊技术指标解读:
BOLL
中轨MID:2340.19,上轨UP:2398.91,下轨LOW:2281.48
解读:价格已经站上布林带中轨,且向上轨靠近,说明短期趋势偏多;上轨附近(约2400)是强压力位,若不能放量突破,大概率会遇阻回落。
MACD
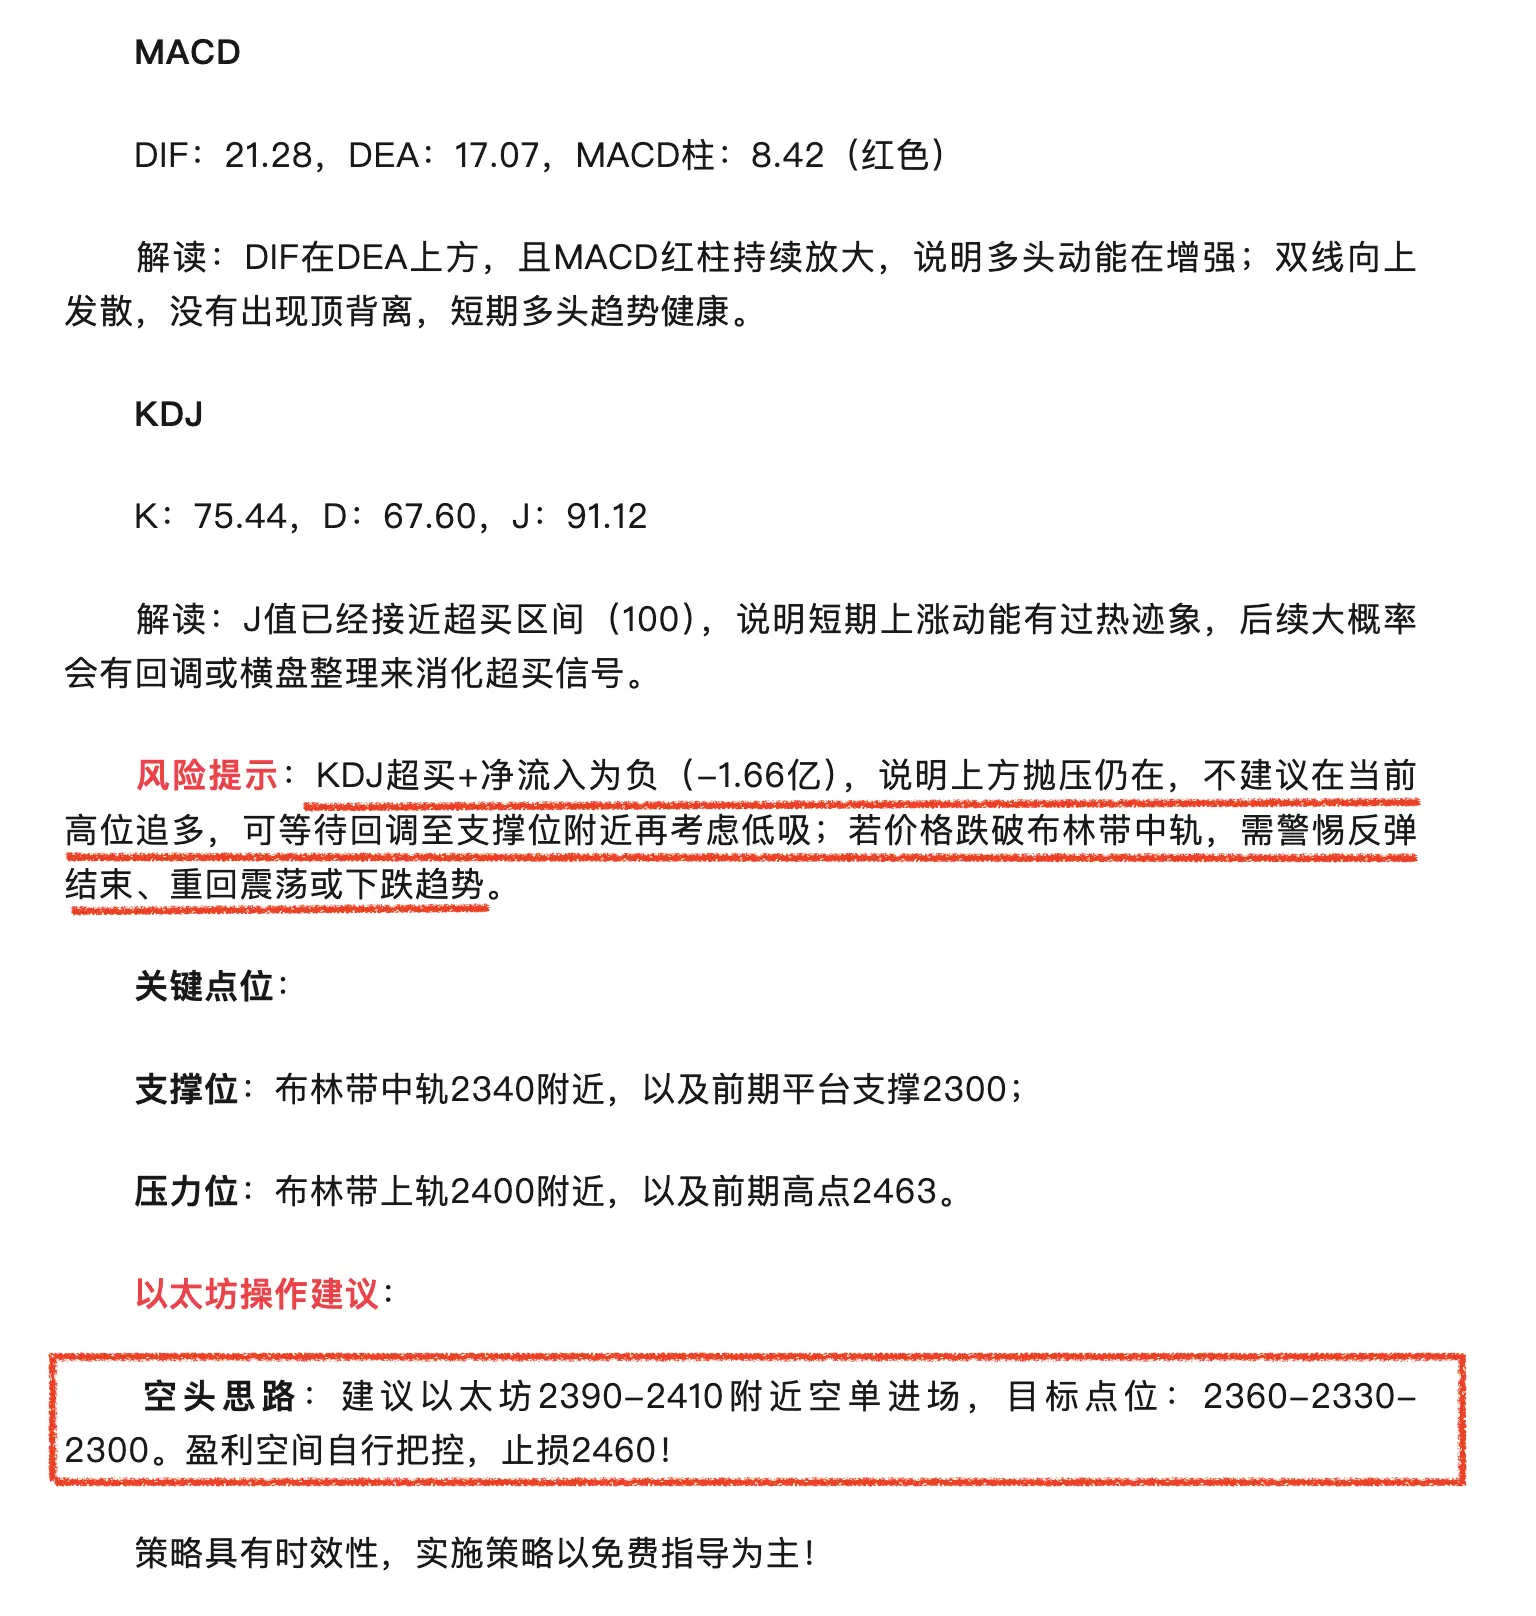
DIF:21.28,DEA:17.07,MACD柱:8.42(红色)
解读:DIF在DEA上方,且MACD红柱持续放大,说明多头动能在增强;双线向上发散,没有出现顶背离,短期多头趋势健康。
KDJ
K:75.44,D:67.60,J:91.12
解读:J值已经接近超买区间(100),说明短期上涨动能有过热迹象,后续大概率会有回调或横盘整理来消化超买信号。
风险提示:KDJ超买+净流入为负(-1.66亿),说明上方抛压仍在,不建议在当前高位追多,可等待回调至支撑位附近再考虑低吸;若价格跌破布林带中轨,需警惕反弹结束、重回震荡或下跌趋势。
关键点位:
支撑位:
上周以太坊收益单已经连续很久,跟上操作的投资者都知道!以太坊4小时周期内,价格站稳布林中轨,MACD多头排列,整体偏多头趋势,短期上方压力在布林上轨2398附近,强压力可看前高2463.86。第一支撑布林中轨2340,第二支撑2300整数关口,跌破则可能重回震荡区间。
四小时以太坊技术指标解读:
BOLL
中轨MID:2340.19,上轨UP:2398.91,下轨LOW:2281.48
解读:价格已经站上布林带中轨,且向上轨靠近,说明短期趋势偏多;上轨附近(约2400)是强压力位,若不能放量突破,大概率会遇阻回落。
MACD
DIF:21.28,DEA:17.07,MACD柱:8.42(红色)
解读:DIF在DEA上方,且MACD红柱持续放大,说明多头动能在增强;双线向上发散,没有出现顶背离,短期多头趋势健康。
KDJ
K:75.44,D:67.60,J:91.12
解读:J值已经接近超买区间(100),说明短期上涨动能有过热迹象,后续大概率会有回调或横盘整理来消化超买信号。
风险提示:KDJ超买+净流入为负(-1.66亿),说明上方抛压仍在,不建议在当前高位追多,可等待回调至支撑位附近再考虑低吸;若价格跌破布林带中轨,需警惕反弹结束、重回震荡或下跌趋势。
关键点位:
支撑位:
ETH0.72%

- 赞赏
- 点赞
- 评论
- 转发
- 分享
📣5/2以太坊趋势详细解析及稳健操作建议分享:
以太坊趋势布局接连获利,是实力还是运气?目前以太坊短期趋势4小时级别处于震荡偏强格局,价格在布林带中轨上方运行,整体未破关键支撑。MACD和KDJ都显示上涨动能减弱,追多需谨慎,避免在高位盲目加仓。
四小时以太坊技术指标解读:
BOLL布林带(20,2.0)
中轨(MID):2279.75,上轨(UP):2329.05,下轨(LOW):2230.45
当前价格位于中轨与上轨之间,说明短期处于偏强震荡区间,上轨附近是强压力位,中轨是短期支撑位。
MACD(12,26,9)
DIF:6.03,DEA:3.27,MACD值:-5.52
DIF线在DEA线上方,但柱状图为绿柱且未明显缩短,说明多头动能有所衰减,存在短期回调的可能。
KDJ(9,3,3)
K:66.24,D:67.01,J:64.69
三线都处于50以上的偏强区间,但J线略低于K、D线,说明上涨动能放缓,有高位钝化后回落的风险,尚未进入超买区(>80),但已接近偏高水平。
关键价位:
压力位:2329(布林带上轨)、2400整数关口
支撑位:2280-2279(布林带中轨/近期低点)、2220附近
以太坊操作建议:
空单思路:建议以太坊2320-2340附近空单进场,目标点位:2300-2270-2230,盈利空
ETH0.72%

- 赞赏
- 点赞
- 评论
- 转发
- 分享
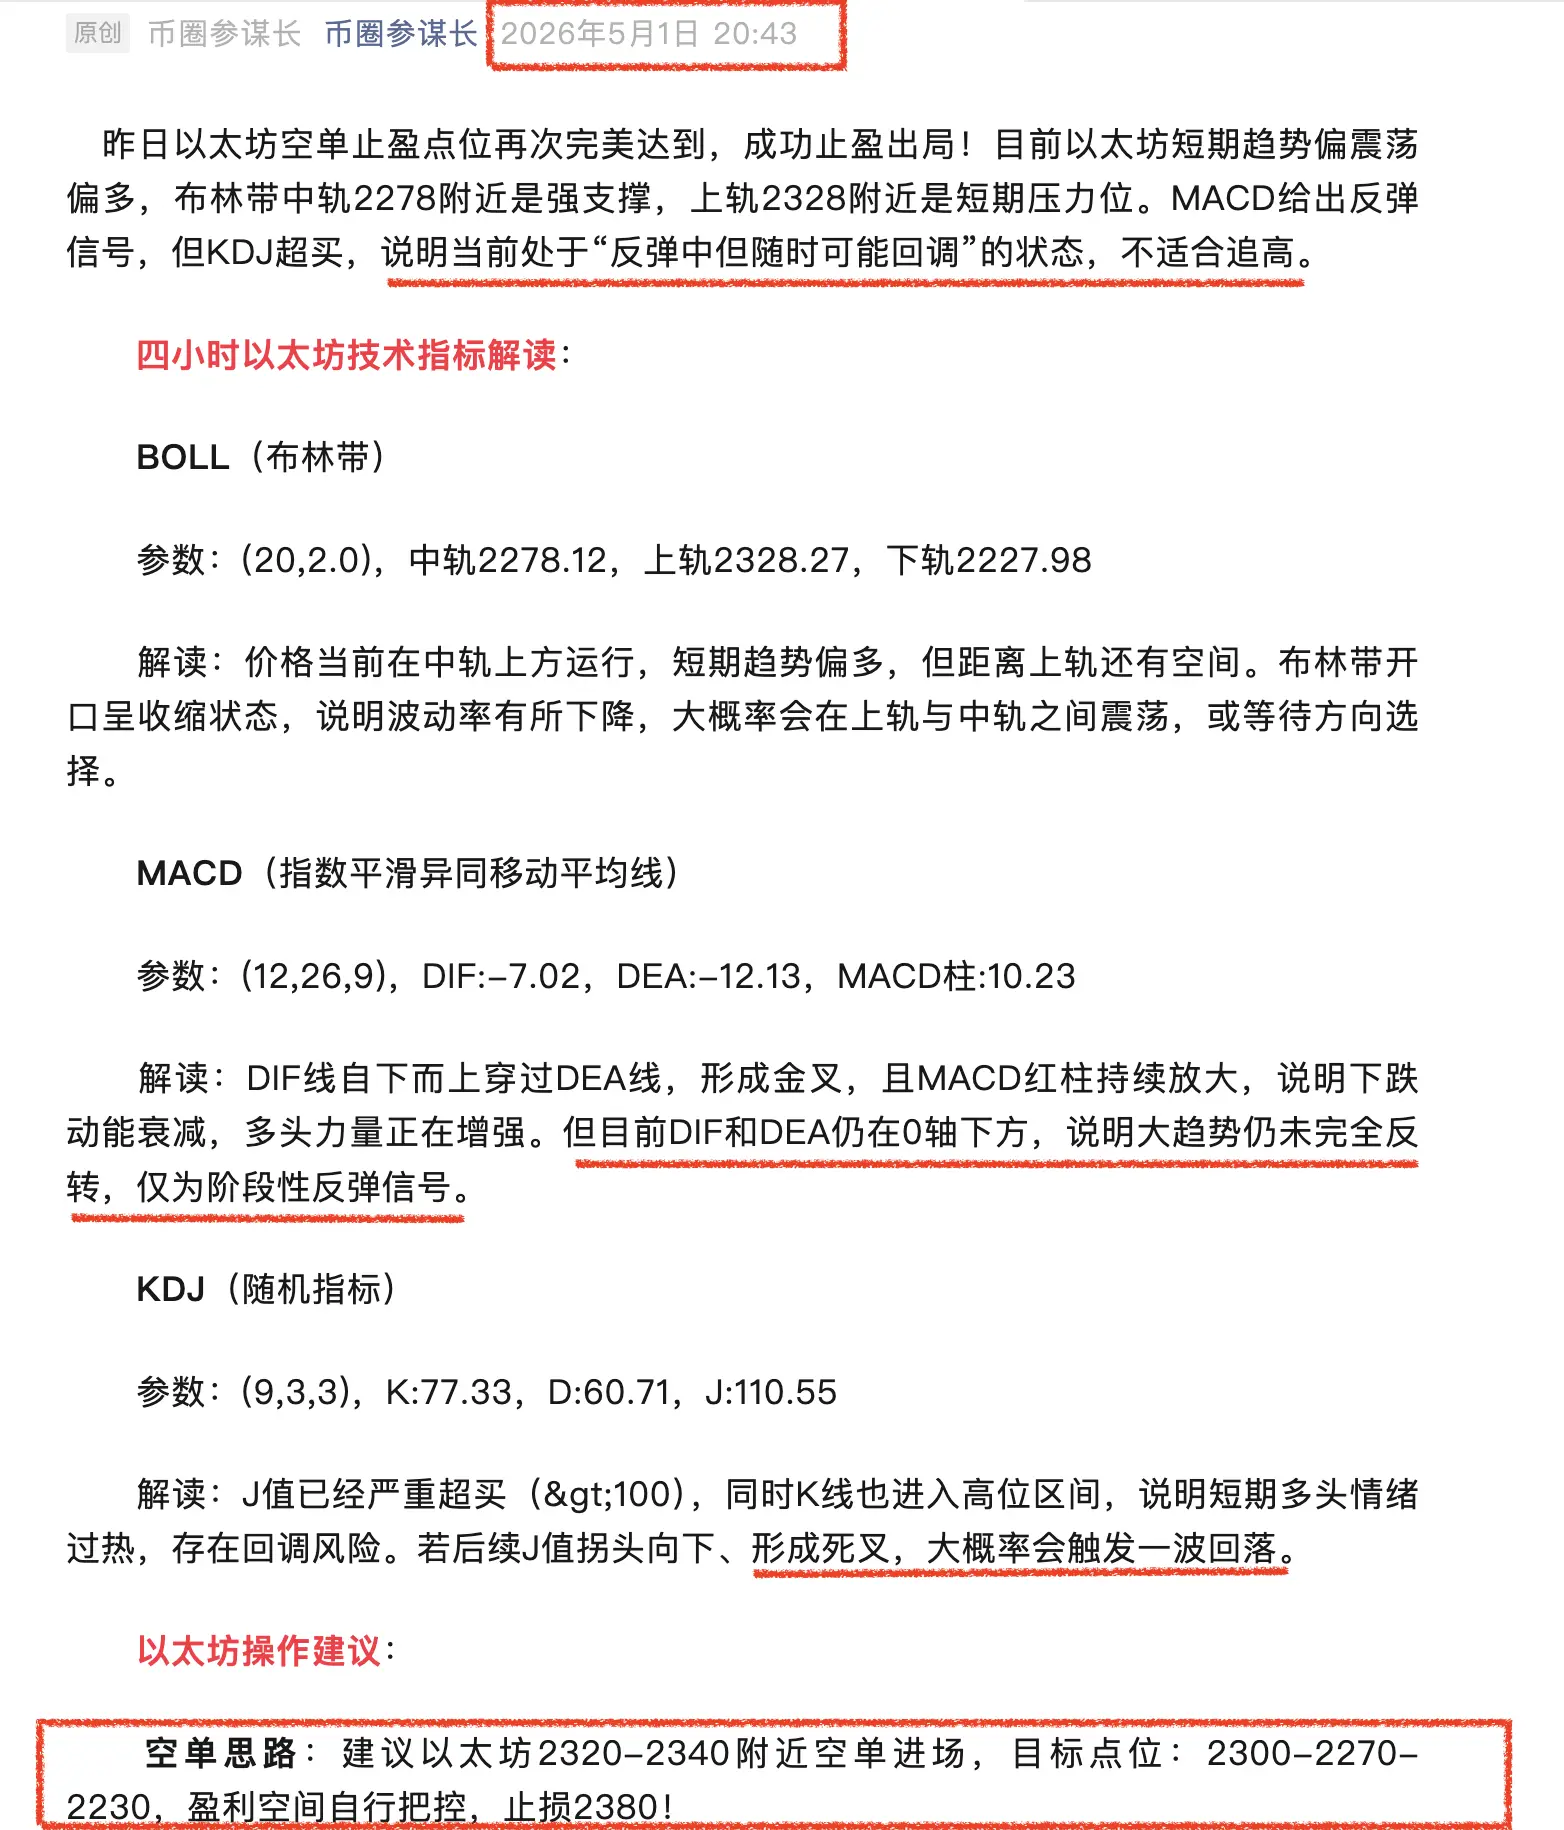
📣5/1以太坊趋势详细解析及稳健操作建议分享:
昨日以太坊空单止盈点位再次完美达到,成功止盈出局!目前以太坊短期趋势偏震荡偏多,布林带中轨2278附近是强支撑,上轨2328附近是短期压力位。MACD给出反弹信号,但KDJ超买,说明当前处于“反弹中但随时可能回调”的状态,不适合追高。
四小时以太坊技术指标解读:
BOLL(布林带)
参数:(20,2.0),中轨2278.12,上轨2328.27,下轨2227.98
解读:价格当前在中轨上方运行,短期趋势偏多,但距离上轨还有空间。布林带开口呈收缩状态,说明波动率有所下降,大概率会在上轨与中轨之间震荡,或等待方向选择。
MACD(指数平滑异同移动平均线)
参数:(12,26,9),DIF:-7.02,DEA:-12.13,MACD柱:10.23
解读:DIF线自下而上穿过DEA线,形成金叉,且MACD红柱持续放大,说明下跌动能衰减,多头力量正在增强。但目前DIF和DEA仍在0轴下方,说明大趋势仍未完全反转,仅为阶段性反弹信号。
KDJ(随机指标)
参数:(9,3,3),K:77.33,D:60.71,J:110.55
解读:J值已经严重超买(>100),同时K线也进入高位区间,说明短期多头情绪过热,存在回调风险。若后续J值拐头向下、形成死叉,大概率会触发一波回落。
以太坊操作建议:
空单
ETH0.72%

- 赞赏
- 点赞
- 评论
- 转发
- 分享
4/30以太坊趋势详细解析及稳健操作建议分享:
4小时级别上,价格已经跌破布林带中轨和近期震荡平台下沿,MACD红柱缩短、KDJ死叉向下,短期空头力量占优,大概率会继续测试布林带下轨2230附近的支撑。如果2230支撑有效,可能会进入小幅反弹修复;如果跌破2230,下一个支撑在2173-2200区间。
从四小时以太坊指标解析:
BOLL布林带指标
中轨(MID):2282.23,上轨(UP):2334.09,下轨(LOW):2230.37
解读:价格已经跌破布林带中轨,且正在靠近下轨,说明短期趋势偏弱,布林带开口略有收缩,震荡偏下行的概率较高。
MACD指标
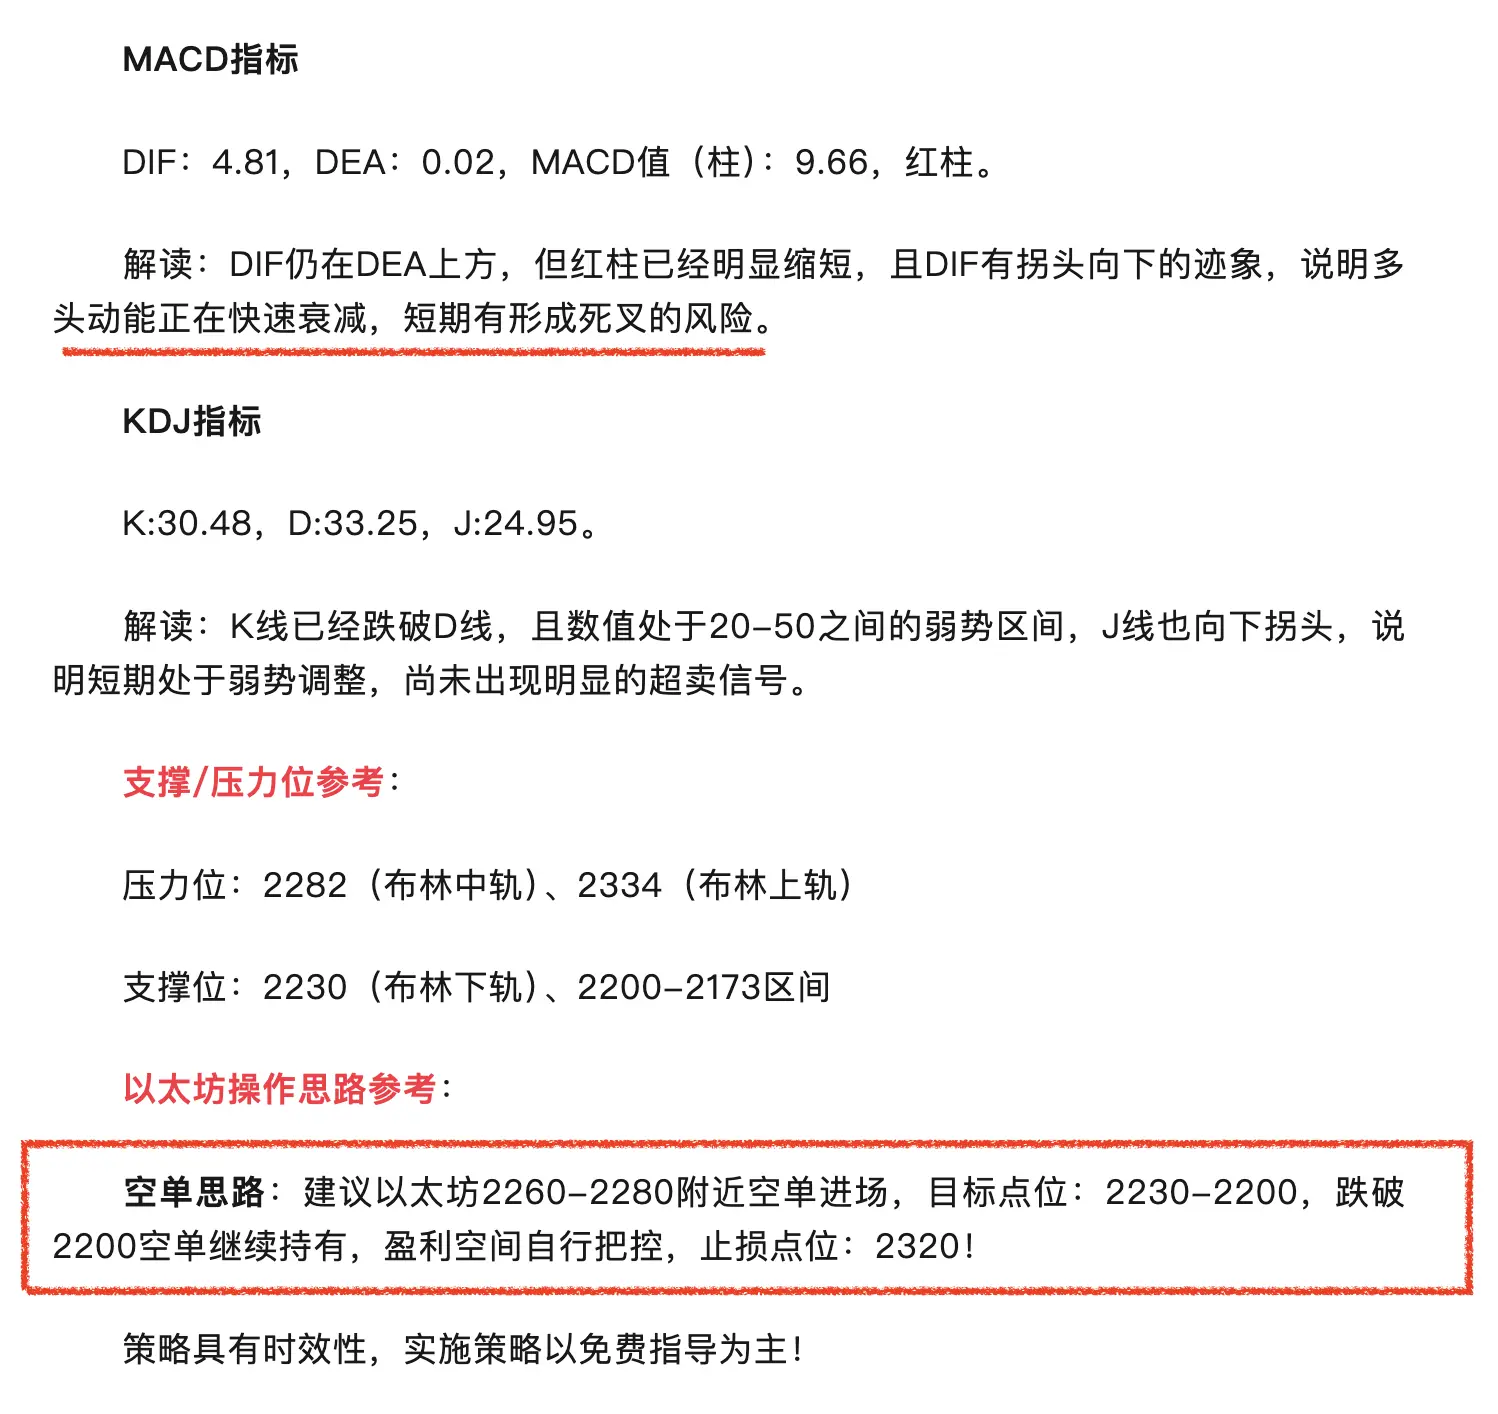
DIF:4.81,DEA:0.02,MACD值(柱):9.66,红柱。
解读:DIF仍在DEA上方,但红柱已经明显缩短,且DIF有拐头向下的迹象,说明多头动能正在快速衰减,短期有形成死叉的风险。
KDJ指标
K:30.48,D:33.25,J:24.95。
解读:K线已经跌破D线,且数值处于20-50之间的弱势区间,J线也向下拐头,说明短期处于弱势调整,尚未出现明显的超卖信号。
支撑/压力位参考:
压力位:2282(布林中轨)、2334(布林上轨)
支撑位:2230(布林下轨)、2200-2173区间
以太坊操作思路参考:
空单思路:建议以太坊2260-2280附
4小时级别上,价格已经跌破布林带中轨和近期震荡平台下沿,MACD红柱缩短、KDJ死叉向下,短期空头力量占优,大概率会继续测试布林带下轨2230附近的支撑。如果2230支撑有效,可能会进入小幅反弹修复;如果跌破2230,下一个支撑在2173-2200区间。
从四小时以太坊指标解析:
BOLL布林带指标
中轨(MID):2282.23,上轨(UP):2334.09,下轨(LOW):2230.37
解读:价格已经跌破布林带中轨,且正在靠近下轨,说明短期趋势偏弱,布林带开口略有收缩,震荡偏下行的概率较高。
MACD指标
DIF:4.81,DEA:0.02,MACD值(柱):9.66,红柱。
解读:DIF仍在DEA上方,但红柱已经明显缩短,且DIF有拐头向下的迹象,说明多头动能正在快速衰减,短期有形成死叉的风险。
KDJ指标
K:30.48,D:33.25,J:24.95。
解读:K线已经跌破D线,且数值处于20-50之间的弱势区间,J线也向下拐头,说明短期处于弱势调整,尚未出现明显的超卖信号。
支撑/压力位参考:
压力位:2282(布林中轨)、2334(布林上轨)
支撑位:2230(布林下轨)、2200-2173区间
以太坊操作思路参考:
空单思路:建议以太坊2260-2280附


- 赞赏
- 点赞
- 评论
- 转发
- 分享
📣4/29以太坊趋势详细解析及稳健操作建议分享:
4小时级别短期偏弱,价格跌破布林中轨,MACD空头信号,但未出现极端放量杀跌。
从四小时以太技术指标解读:
BOLL布林带
中轨MID:2314.40,上轨UP:2380.03,下轨LOW:2248.77,当前价格跌破中轨,运行在中轨与下轨之间,说明短期趋势偏弱,布林带开口有收敛迹象,震荡概率上升。
MACD
DIF:-12.15,DEA:8.75,MACD柱:-6.79,DIF在DEA下方且MACD为绿柱,属于空头信号,但绿柱没有明显放大,下跌动能暂时不算极强。
KDJ
K:34.58,D:28.48,J:46.77,K、D均在50以下的弱势区间,J线向上拐头,显示短期有反弹修复需求,但尚未形成金叉,反弹持续性存疑。
关键支撑/压力:
支撑:2256附近(日内低点)、2248附近(布林下轨)
压力:2314附近(布林中轨)、2380附近(布林上轨)
以太坊操作建议:
空单思路:建议以太坊2290-2300附近空单进场,目标点位:2260-2230,盈利区间自行把控!止损2340。
策略具有时效性,实施策略以免费指导为主!$BTC $ETH #加密市场小幅下跌 #Polymarket每日热点 #Solana发布量子路线图
ETH0.72%


- 赞赏
- 点赞
- 评论
- 转发
- 分享
📣4/24以太坊趋势详细解析及稳健操作建议分享:
昨日以太坊空单再次完美止盈出局,以太坊当前价格2328.53 USDT,日内涨幅仅+0.02%,整体处于窄幅震荡状态。4小时级别处于窄幅震荡+方向选择前的蓄势阶段,布林带收窄、资金流出、MACD动能衰减,多空双方暂时都没有足够的力量打破平衡。
四小时以太坊指标解读:
BOLL
中轨(MID):2341.47,当前价格在中轨下方,说明短期处于偏弱的震荡格局。上轨(UP):2406.70,下轨(LOW):2276.25,布林带开口收窄,预示着震荡区间正在压缩,后续大概率会迎来方向选择,价格近期两次测试上轨附近(最高2463.86)后回落,说明上方压力较强。
MACD
DIF:3.75,DEA:0.13,MACD值:-7.75(绿色柱),DIF虽然还在DEA上方,但柱状线为负且处于缩短/走弱状态,说明多头动能正在衰减,短期有拐头向下的风险,前期红柱冲高后快速回落,目前处于绿柱阶段,属于弱势修正的信号。
KDJ
K:41.45,D:35.37,J:53.62,三线处于50附近的中性区间。J线从低位拐头向上,短期有小幅反弹的动能,但尚未突破50,整体趋势性不强,属于震荡市中的弱修复信号。
关键区间参考:
上方压力:2340-2350(布林中轨+近期平台压力),突破后才有望挑战2400+的高点。
ETH0.72%

- 赞赏
- 1
- 评论
- 转发
- 分享
📣4/23以太坊趋势详细解析及稳健操作建议思路分享:
以太坊短期强烈看空。价格跌破关键支撑,主力大单砸盘,技术面全面走坏。目前处于下跌趋势中,切勿盲目“接飞刀”。若持仓被套,需关注2300支撑强度,破位建议止损或严格风控;空仓者建议观望,等待止跌信号(如K线出现长下影线或MACD动能柱缩短)出现后再尝试低多。
四小时以太坊技术指标分析:
BOLL(布林带)
形态:K线价格有效跌破中轨(MID,2338.03),目前价格在中轨下方运行。
趋势:布林带上轨(UP)向下拐头,下轨(LOW)加速发散,意味着短线下跌动能增强,且跌破了关键的2400心理关口。
MACD(指数平滑异同移动平均线)
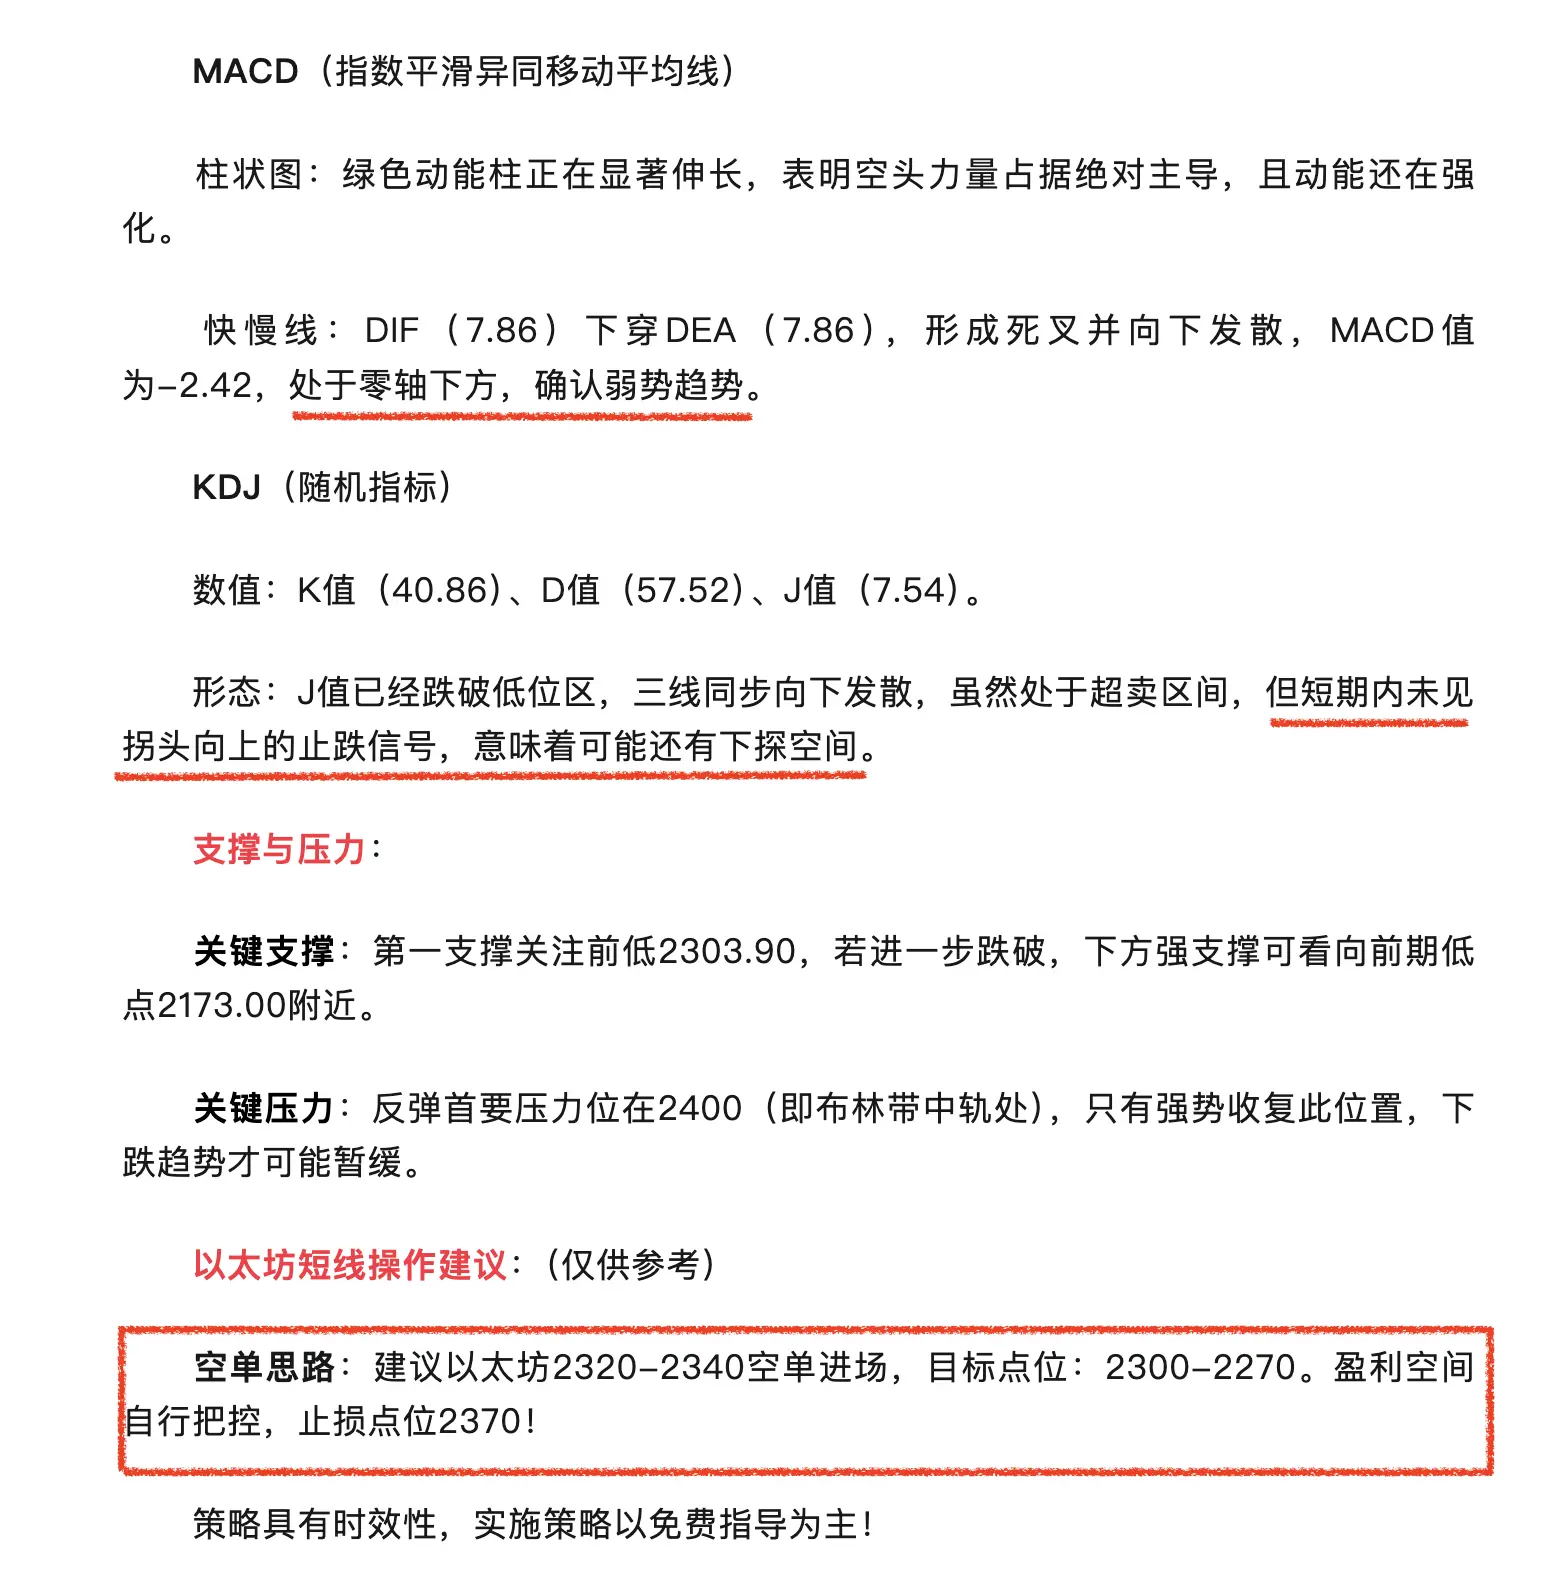
柱状图:绿色动能柱正在显著伸长,表明空头力量占据绝对主导,且动能还在强化。
快慢线:DIF(7.86)下穿DEA(7.86),形成死叉并向下发散,MACD值为-2.42,处于零轴下方,确认弱势趋势。
KDJ(随机指标)
数值:K值(40.86)、D值(57.52)、J值(7.54)。
形态:J值已经跌破低位区,三线同步向下发散,虽然处于超卖区间,但短期内未见拐头向上的止跌信号,意味着可能还有下探空间。
支撑与压力:
关键支撑:第一支撑关注前低2303.90,若进一步跌破,下方强支撑可看向前期低点2173.00附近。
关键压力:反弹首要压力位在2
以太坊短期强烈看空。价格跌破关键支撑,主力大单砸盘,技术面全面走坏。目前处于下跌趋势中,切勿盲目“接飞刀”。若持仓被套,需关注2300支撑强度,破位建议止损或严格风控;空仓者建议观望,等待止跌信号(如K线出现长下影线或MACD动能柱缩短)出现后再尝试低多。
四小时以太坊技术指标分析:
BOLL(布林带)
形态:K线价格有效跌破中轨(MID,2338.03),目前价格在中轨下方运行。
趋势:布林带上轨(UP)向下拐头,下轨(LOW)加速发散,意味着短线下跌动能增强,且跌破了关键的2400心理关口。
MACD(指数平滑异同移动平均线)
柱状图:绿色动能柱正在显著伸长,表明空头力量占据绝对主导,且动能还在强化。
快慢线:DIF(7.86)下穿DEA(7.86),形成死叉并向下发散,MACD值为-2.42,处于零轴下方,确认弱势趋势。
KDJ(随机指标)
数值:K值(40.86)、D值(57.52)、J值(7.54)。
形态:J值已经跌破低位区,三线同步向下发散,虽然处于超卖区间,但短期内未见拐头向上的止跌信号,意味着可能还有下探空间。
支撑与压力:
关键支撑:第一支撑关注前低2303.90,若进一步跌破,下方强支撑可看向前期低点2173.00附近。
关键压力:反弹首要压力位在2
ETH0.72%


- 赞赏
- 点赞
- 评论
- 转发
- 分享
📣以太坊多单止盈出局及后市趋势解析!
晚间以太坊2380-2390多单,目标2420上方,再次止盈出局!
当前趋势判断4小时级别,价格突破布林带上轨,MACD金叉+红柱放大,整体多头趋势明确,短期偏强势。但KDJ指标已经进入超买区间,且上方存在大额卖单抛压,不建议盲目追高。
上方2414-2463区间是前期高点压力位,叠加大额卖单,有回调风险。布林带上轨附近如果无法持续站稳,可能会回踩上轨2381附近,甚至测试中轨2320附近支撑。
策略具有时效性,实施策略以免费指导为主!#Gate13周年现场直击 #WCTC交易赛瓜分800万USDT #比特币反弹 #跟单金牌星探 #MAGA市值突破2000万美元 $BTC $ETH
晚间以太坊2380-2390多单,目标2420上方,再次止盈出局!
当前趋势判断4小时级别,价格突破布林带上轨,MACD金叉+红柱放大,整体多头趋势明确,短期偏强势。但KDJ指标已经进入超买区间,且上方存在大额卖单抛压,不建议盲目追高。
上方2414-2463区间是前期高点压力位,叠加大额卖单,有回调风险。布林带上轨附近如果无法持续站稳,可能会回踩上轨2381附近,甚至测试中轨2320附近支撑。
策略具有时效性,实施策略以免费指导为主!#Gate13周年现场直击 #WCTC交易赛瓜分800万USDT #比特币反弹 #跟单金牌星探 #MAGA市值突破2000万美元 $BTC $ETH

- 赞赏
- 点赞
- 评论
- 转发
- 分享
📣4/22以太坊趋势详细解析及稳健操作建议分享:
昨日以太坊短线空单再次拿下!从以太坊4小时级别,价格处于上涨趋势中,布林带开口、MACD金叉红柱放大,都支持多头行情。但KDJ超买+上方大额卖单,提示短期不宜盲目追高。
从四小时以太坊指标分析:
BOLL布林带
中轨(MID):2319.94,上轨(UP):2381.02,下轨(LOW):2258.86。
解读:价格已经突破上轨,说明短期上涨动能较强,但也处于布林带的超买区间。布林带开口扩张,说明波动在放大,行情正在走出区间。
MACD
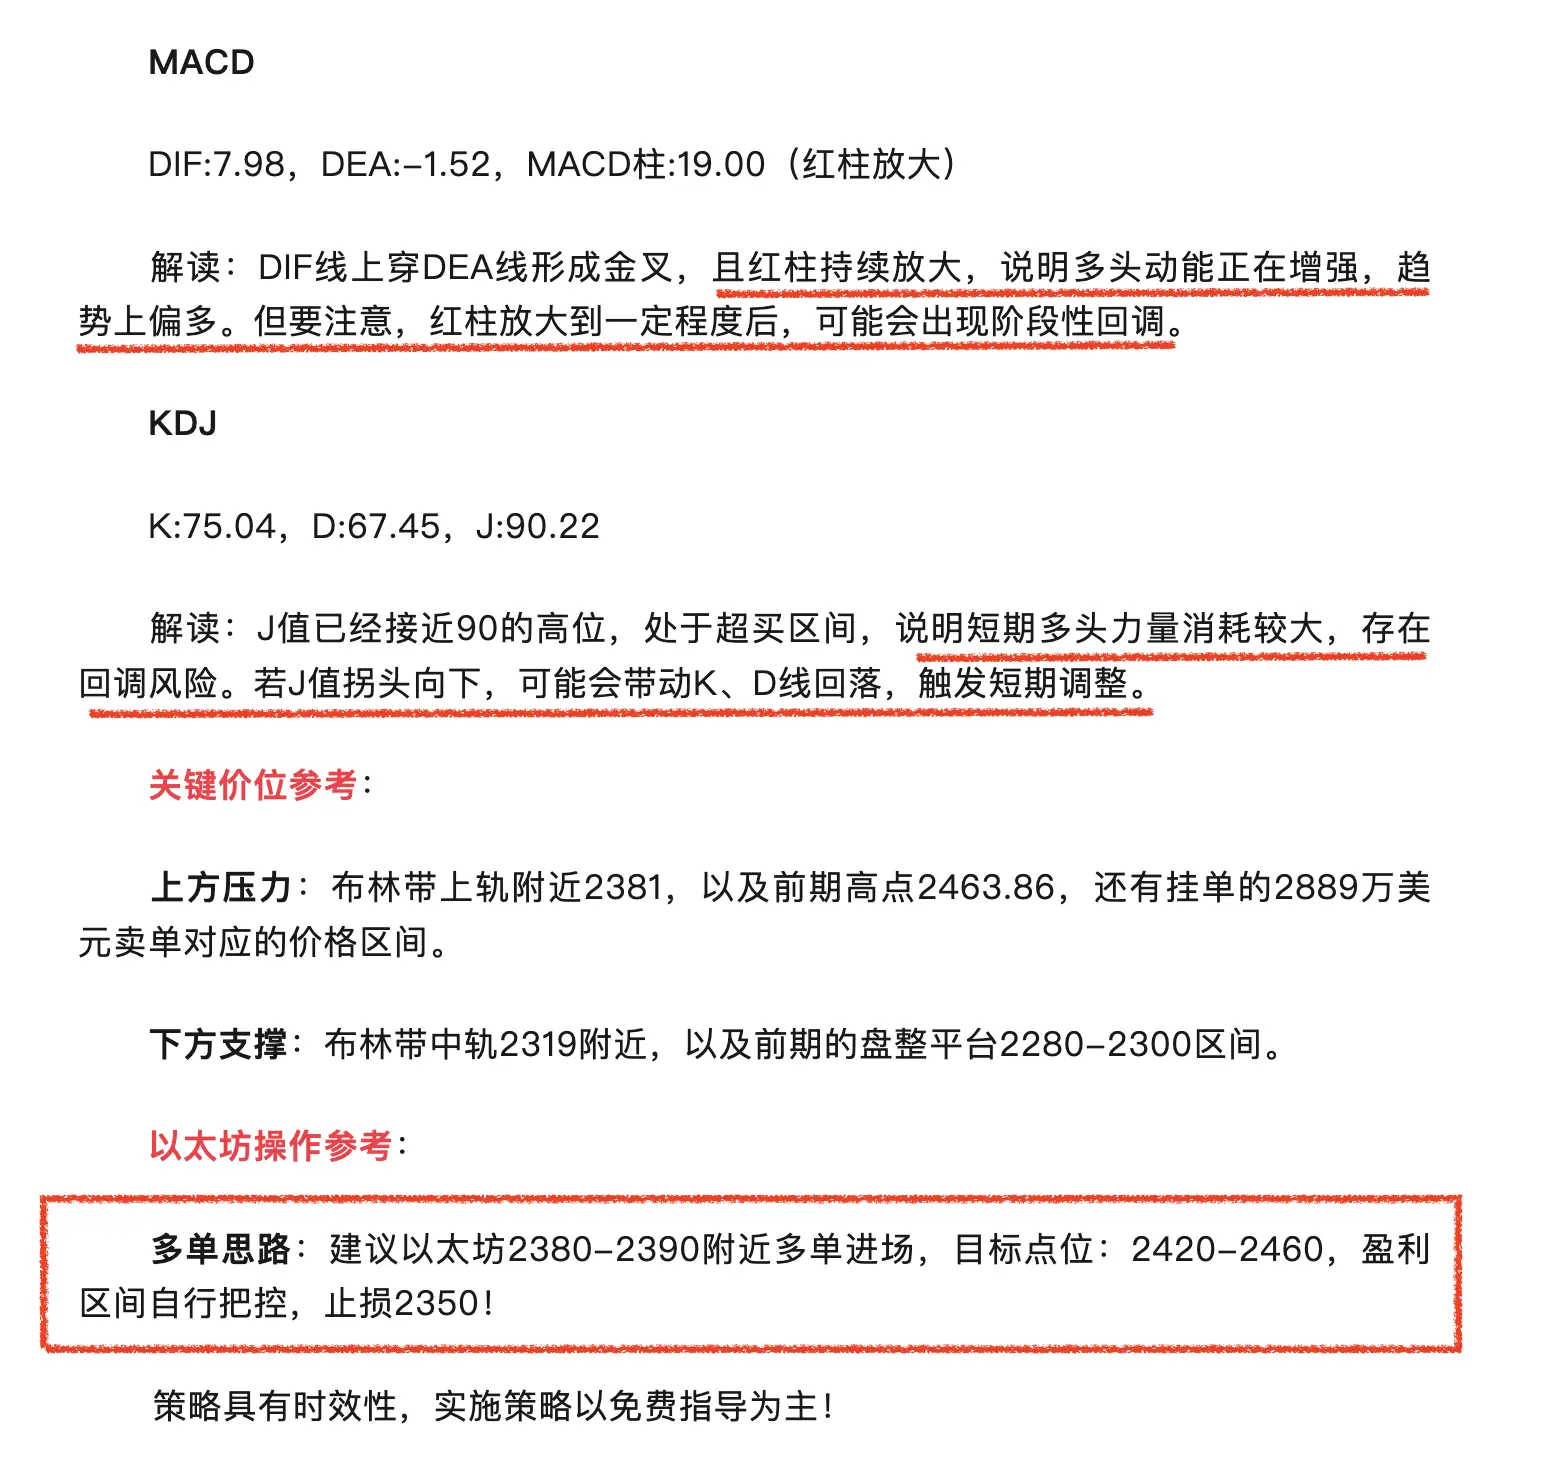
DIF:7.98,DEA:-1.52,MACD柱:19.00(红柱放大)
解读:DIF线上穿DEA线形成金叉,且红柱持续放大,说明多头动能正在增强,趋势上偏多。但要注意,红柱放大到一定程度后,可能会出现阶段性回调。
KDJ
K:75.04,D:67.45,J:90.22
解读:J值已经接近90的高位,处于超买区间,说明短期多头力量消耗较大,存在回调风险。若J值拐头向下,可能会带动K、D线回落,触发短期调整。
关键价位参考:
上方压力:布林带上轨附近2381,以及前期高点2463.86,还有挂单的2889万美元卖单对应的价格区间。
下方支撑:布林带中轨2319附近,以及前期的盘整平台2280-2300区间。
以太坊操作参考:
多单
昨日以太坊短线空单再次拿下!从以太坊4小时级别,价格处于上涨趋势中,布林带开口、MACD金叉红柱放大,都支持多头行情。但KDJ超买+上方大额卖单,提示短期不宜盲目追高。
从四小时以太坊指标分析:
BOLL布林带
中轨(MID):2319.94,上轨(UP):2381.02,下轨(LOW):2258.86。
解读:价格已经突破上轨,说明短期上涨动能较强,但也处于布林带的超买区间。布林带开口扩张,说明波动在放大,行情正在走出区间。
MACD
DIF:7.98,DEA:-1.52,MACD柱:19.00(红柱放大)
解读:DIF线上穿DEA线形成金叉,且红柱持续放大,说明多头动能正在增强,趋势上偏多。但要注意,红柱放大到一定程度后,可能会出现阶段性回调。
KDJ
K:75.04,D:67.45,J:90.22
解读:J值已经接近90的高位,处于超买区间,说明短期多头力量消耗较大,存在回调风险。若J值拐头向下,可能会带动K、D线回落,触发短期调整。
关键价位参考:
上方压力:布林带上轨附近2381,以及前期高点2463.86,还有挂单的2889万美元卖单对应的价格区间。
下方支撑:布林带中轨2319附近,以及前期的盘整平台2280-2300区间。
以太坊操作参考:
多单
ETH0.72%


- 赞赏
- 点赞
- 评论
- 转发
- 分享
📣4/21以太坊趋势详细解析及稳健操作建议分享:
4小时周期处于下跌后的反弹修复阶段,价格从2058.01的低点反弹,目前在2300附近震荡,上方2350-2400区间压力明显。
四小时以太坊技术指标解读:
BOLL布林带(20,2)
中轨:2327.76,上轨:2396.41,下轨:2259.11,价格目前在中轨下方偏上的位置,处于布林带中轨与下轨之间的区间震荡状态,上轨是短期强压力位,下轨是支撑位。
MACD(12,26,9)
DIF:7.96,DEA:-6.29,MACD柱:3.34(红柱),DIF已上穿DEA,MACD由绿转红,多头动能正在初步释放,但红柱长度较短,上涨动能还不算特别强劲,属于弱势修复阶段。
KDJ(9,3,3)
K:61.91,D:55.01,J:75.70,KDJ三线均已从低位向上拐头,J值已接近80的高位区间,短期有超买的苗头,后续如果继续冲高,可能会有回调需求。
支撑/压力:
短期支撑:布林带下轨2259附近,以及近期低点2262
短期压力:布林带中轨2327,上轨2396,前期高点2463
以太坊操作建议:
空单思路:建议以太坊2320-2330附近空单进场,目标点位:2290-2260,盈里区间自行把控。止损2360!
策略具有时效性,实施策略以免费指导为主!#Gate13周年现场直击 #比


- 赞赏
- 点赞
- 评论
- 转发
- 分享
📣4/19以太坊趋势详细解析及稳健操作建议分享:
4小时K线为小实体十字星,伴随上影线较长,显示当前价格在2340附近多空双方力量均衡,市场处于犹豫状态。前一根K线为阳线,但再前一根为带长下影线的阴线,且成交量放大,表明在2300附近有较强买盘支撑。
1日周期出现巨量“暴涨”阳线,随后04月18日出现巨量“暴跌”阴线,形成剧烈震荡。04月19日K线为带长下影线的小实体K线,显示在日线级别上,价格在2300附近获得支撑,但整体仍处于回调后的盘整阶段。
技术指标:
MACD:4小时周期DIF线(4)和DEA线(14)均在零轴下方,且DIF线在DEA线下方运行,MACD柱状图为负值(-20),表明短期趋势偏空。但MACD柱状图负值绝对值有所收敛(从-22到-20),显示空头动能有所减弱。
RSI:4小时周期RSI数值为49,处于中性区域,未进入超买或超卖区,表明市场目前没有明显的单边动能。
EMA:4小时周期价格(2340)位于EMA7(2342)和EMA30(2341)下方,EMA7和EMA30粘合且略高于价格,构成短期阻力。EMA120(2238)远低于当前价格,指示长期趋势仍为多头。
成交量:
4小时周期:04月19日12:00的下跌K线伴随长下影线和高成交量(206950),表明在该时段低点2295附近有大量买盘介入,2300整数点位支撑作


- 赞赏
- 点赞
- 评论
- 转发
- 分享
📣4/17以太坊趋势详细解析及稳健操作建议分享:
K线4小时图显示,最新K线为带长上影线的阳线,收盘价高于开盘价,但未能站稳高位,表明上方存在抛压。前几根K线多空争夺激烈,尤其在04月17日00:00出现放量阳线后,市场进入震荡整理。
日线图显示,近期价格经历大幅波动,04月13日和04月15日出现放量上涨,随后04月14日和04月16日出现放量下跌。最新日K线为带长上影线的阳线,成交量萎缩,显示上涨动能减弱。
从四小时以太坊技术指标:
MACD:4小时图MACD指标DIF线已下穿DEA线,且DIF和DEA均在零轴下方运行,MACD柱状图为负值并持续放大,表明短期市场处于空头趋势或回调阶段,动能偏弱。
RSI:4小时图RSI数值为57.94,处于中性区域,未显示超买或超卖信号。此前RSI曾进入超买区后出现回调,符合回调预期。
EMA:4小时图价格位于EMA7、EMA30和EMA120上方,且EMA7(2343.23)位于EMA30(2313.21)上方,EMA30位于EMA120(2207.29)上方,均线呈多头排列,指示中长期趋势仍偏向上行。EMA7和EMA30可能提供动态支撑。
成交量:
4小时图最新K线成交量中等,较前几根高量K线有所下降,未能有效支撑价格突破前高。
日线图最新K线成交量较前几个交易日大幅萎缩,结合带长上影线的K线形态,
ETH0.72%


- 赞赏
- 点赞
- 评论
- 转发
- 分享
📣通知:空单全部止盈出局,耐心等待下一单布局!
晚间以太坊2350-2360空单再次止盈出局,收益相信大家有目共睹。以太坊短期趋势:上涨后的回调阶段,价格跌破布林带中轨,MACD死叉确认,短期偏空,支撑位参考布林带下轨附近(约2220-2230区间),压力位则是布林带中轨(约2325)和前高2416附近。$BTC $ETH #Gate13周年现场直击 #美伊局势和谈与增兵博弈 #加密市场回升 #Gate13周年 #美股创下历史新高
晚间以太坊2350-2360空单再次止盈出局,收益相信大家有目共睹。以太坊短期趋势:上涨后的回调阶段,价格跌破布林带中轨,MACD死叉确认,短期偏空,支撑位参考布林带下轨附近(约2220-2230区间),压力位则是布林带中轨(约2325)和前高2416附近。$BTC $ETH #Gate13周年现场直击 #美伊局势和谈与增兵博弈 #加密市场回升 #Gate13周年 #美股创下历史新高
ETH0.72%

- 赞赏
- 1
- 1
- 转发
- 分享
元究:
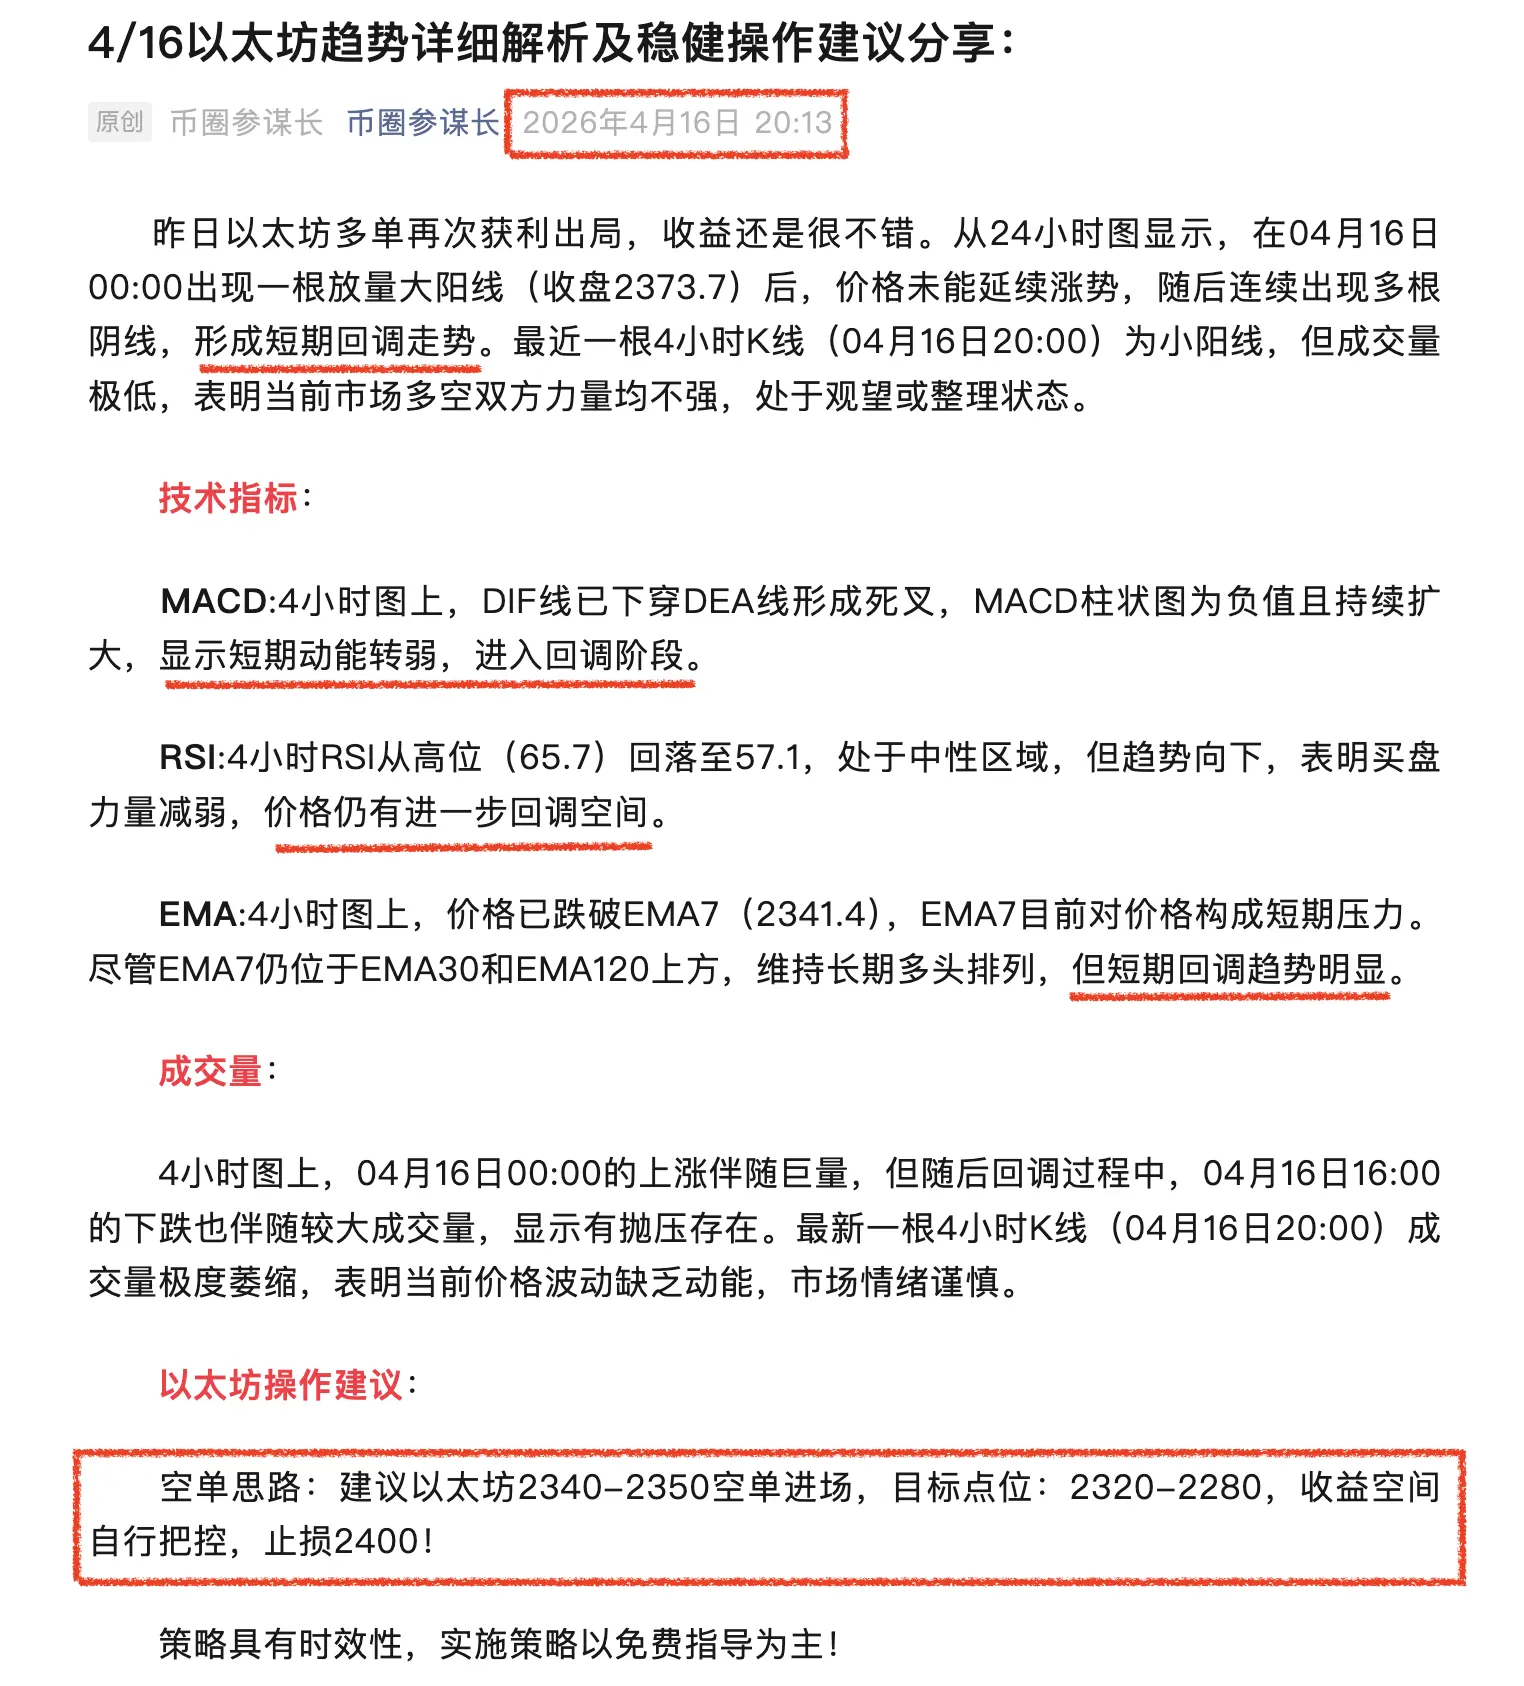
冲就完了 👊📣4/16以太坊趋势详细解析及稳健操作建议分享:
昨日以太坊多单再次获利出局,收益还是很不错。从24小时图显示,在04月16日00:00出现一根放量大阳线(收盘2373.7)后,价格未能延续涨势,随后连续出现多根阴线,形成短期回调走势。最近一根4小时K线(04月16日20:00)为小阳线,但成交量极低,表明当前市场多空双方力量均不强,处于观望或整理状态。
技术指标:
MACD:4小时图上,DIF线已下穿DEA线形成死叉,MACD柱状图为负值且持续扩大,显示短期动能转弱,进入回调阶段。
RSI:4小时RSI从高位(65.7)回落至57.1,处于中性区域,但趋势向下,表明买盘力量减弱,价格仍有进一步回调空间。
EMA:4小时图上,价格已跌破EMA7(2341.4),EMA7目前对价格构成短期压力。尽管EMA7仍位于EMA30和EMA120上方,维持长期多头排列,但短期回调趋势明显。
成交量:
4小时图上,04月16日00:00的上涨伴随巨量,但随后回调过程中,04月16日16:00的下跌也伴随较大成交量,显示有抛压存在。最新一根4小时K线(04月16日20:00)成交量极度萎缩,表明当前价格波动缺乏动能,市场情绪谨慎。
以太坊操作建议:
空单思路:建议以太坊2340-2350空单进场,目标点位:2320-2280,收益空间自行把控,止损2400!

- 赞赏
- 点赞
- 评论
- 转发
- 分享
📣4/15以太坊趋势详细解析及稳健操作建议分享:
目前以太坊金哥2315.59 USDT,日内下跌2.38%(-56.54 USDT)日内波动最高2416.40 USDT,最低2301.60 USDT,4小时K线,覆盖3月下旬至4月中旬行情,目前大趋势形成深“V”反转。
四小时以太坊技术指标分析:
布林带(BOLL(20,2,0))
当前参数:中轨MID=2268.20,上轨UP=2418.20,下轨LOW=2118.19
信号解读:价格当前位于中轨上方、上轨下方,属于布林带上轨附近的强势区间,说明中期趋势偏多,布林带开口整体呈扩张状态,伴随价格冲高,短期波动加剧,中轨2268是关键支撑位,若有效跌破,将下探2200-2150区间;上轨2418是强阻力,突破则打开新一轮上涨空间。
MACD(12,26,9)
当前参数:DIF=34.63,DEA=32.18,MACD=4.91(红柱)
信号解读:DIF与DEA均在零轴上方运行,且DIF在DEA之上,金叉后多头趋势延续,红柱持续存在,说明多头动能仍在释放,但红柱高度有限,短期上涨动能有所衰减,零轴上方运行确认中期多头格局,未出现死叉前,趋势性回调风险较低。
KDJ(9,3,3)
当前参数:K=57.19,D=64.97,J=41.63
信号解读:K、D、J三线均在50以上的多头区域,但K线
ETH0.72%


- 赞赏
- 点赞
- 评论
- 转发
- 分享
📣4/12以太坊趋势详细解析及稳健操作建议分享:
K线4小时周期04月12日00:00在2314.95附近形成高点后,市场出现连续大阴线,尤其04月12日08:00和20:00的K线实体较大,伴随价格快速下挫,显示出强烈的抛售压力,价格重心明显下移。1日周期:04月12日形成一根实体较大的阴线,其收盘价远低于开盘价,且几乎吞没了04月11日的阳线,构成看跌吞没形态,表明多头力量衰竭,空头占据主导地位。
技术指标:
MACD(4小时):DIF线已下穿DEA线,MACD柱状图在零轴下方持续放大,显示空头动能强劲,短期趋势偏空。
RSI(4小时):RSI从04月12日00:00的高位73.12迅速回落至44.65,已跌破50中线,表明市场由强势转为弱势,但尚未进入超卖区。
EMA(4小时):最新价2180.21已跌破短期均线EMA7(2219.35)和中期均线EMA30(2205.26),这两条均线目前构成上方阻力。虽然EMA7仍高于EMA30,但价格的快速下穿表明短期上涨动能已衰竭,转为下跌。价格正向长期均线EMA120(2137.25)靠近,该位置可能提供支撑。
成交量:
4小时周期:04月12日00:00高点伴随巨量拉升,随后04月12日08:00和20:00的下跌也伴随较大成交量,显示多空双方在高位争夺激烈,最终空头胜出,下跌趋势得到量能确认。1日周
ETH0.72%


- 赞赏
- 点赞
- 评论
- 转发
- 分享
📣通知:晚间以太坊多单止盈出局,耐心等待下一单布局!
晚间以太坊短线多单再次成功止盈出局,目前以太坊价格2244.99 USDT,日涨1.22%,资金净流入8875万,量能维持高位。
布林带:价格沿上轨运行,中轨2192.56为强支撑,上轨2288.90为压力。MACD:DIF死叉DEA,绿柱初现,多头动能衰减,短期有回调需求。KDJ:J值83.84进入超买区,K/D向上,警惕冲高回落。
关键位:支撑2190/2173,压力2273/2289,不追高,回踩企稳再做多,严格止损。
策略具有时效性,实施策略以免费指导为主!$BTC $ETH #原油小幅上涨 #加密市场回升 #Gate广场四月发帖挑战
晚间以太坊短线多单再次成功止盈出局,目前以太坊价格2244.99 USDT,日涨1.22%,资金净流入8875万,量能维持高位。
布林带:价格沿上轨运行,中轨2192.56为强支撑,上轨2288.90为压力。MACD:DIF死叉DEA,绿柱初现,多头动能衰减,短期有回调需求。KDJ:J值83.84进入超买区,K/D向上,警惕冲高回落。
关键位:支撑2190/2173,压力2273/2289,不追高,回踩企稳再做多,严格止损。
策略具有时效性,实施策略以免费指导为主!$BTC $ETH #原油小幅上涨 #加密市场回升 #Gate广场四月发帖挑战
ETH0.72%

- 赞赏
- 2
- 评论
- 转发
- 分享