BrotherBinWealthCard
現在、コンテンツはありません
BrotherBinWealthCard
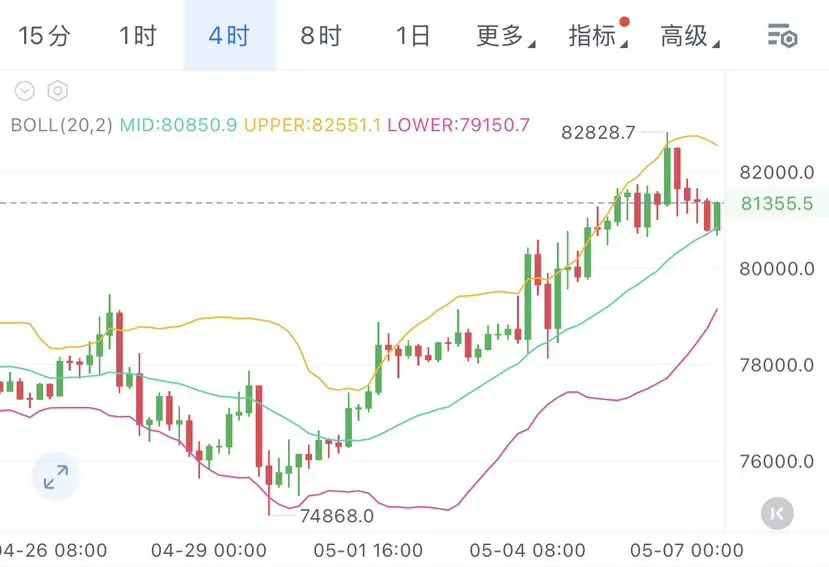
目前大饼在81000附近震荡,从4小时布林带来看,中轨支撑在80800,上轨压力在82500,整体趋势还是偏强的。
布林带开口向上,中轨持续上移,说明中期上升趋势没有被破坏,只要不有效跌破80800,多头格局就不会改变。
当前从高点82800回落,上轨附近抛压明显,没有放量突破的信号,所以直接单边大涨的概率不大,更大概率是震荡偏多的节奏。
建议:
1. 不追高:82500-83000区间压力很强,追进去很容易冲高回落被套。
2. 低吸为主:回踩80800-81000区间企稳,再考虑轻仓试多,止损放在80500下方,目标看82000-82500。
3. 控制仓位:这个位置不上不下,任何重仓操作都容易被来回扫止损,仓位建议控制在10%以内
布林带开口向上,中轨持续上移,说明中期上升趋势没有被破坏,只要不有效跌破80800,多头格局就不会改变。
当前从高点82800回落,上轨附近抛压明显,没有放量突破的信号,所以直接单边大涨的概率不大,更大概率是震荡偏多的节奏。
建议:
1. 不追高:82500-83000区间压力很强,追进去很容易冲高回落被套。
2. 低吸为主:回踩80800-81000区间企稳,再考虑轻仓试多,止损放在80500下方,目标看82000-82500。
3. 控制仓位:这个位置不上不下,任何重仓操作都容易被来回扫止损,仓位建议控制在10%以内
BTC-1.24%
- 報酬
- いいね
- コメント
- リポスト
- 共有
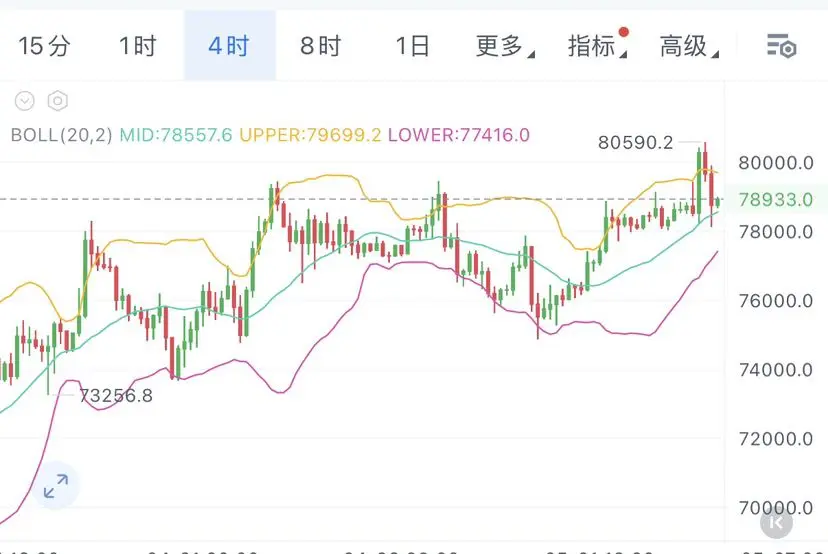
現在、大きなキャンドルは78,900付近で安定しており、4時間のボリンジャーバンドは依然としてミドルラインの上にしっかりと位置している。ミドルラインの78,500付近のサポートは、何度も反発を見せており、明確な下抜けは見られない。上部のバンドの抵抗線は79,700付近にあり、前の高値80,590の試験動作の中で、買い手側が徐々にこれを消化しつつある。
現在、市場にはパニック的な逃避売りは見られず、高値圏での震荡の中でも買い圧力が依然として優勢であることを示している。数日前の急騰後の調整は、主力資金によるブレイク前の洗い落としの動きに近く、二本の陰線で浮動株を洗い流し、その後の上昇に向けて売り圧力を軽減させている。
全体の構造を見ると、ボリンジャーバンドは一時的に開いた後、収縮し始めており、これは上昇の中継信号だ。市場のセンチメントは弱まっておらず、新たな爆発点を待っている状態だ。買い手が再び力を発揮し、上部のバンドの抵抗を突破すれば、上昇余地は一気に広がり、再び80,590の高値に挑戦し突破する可能性が高い。さらに高い整数の関門に向けて攻め込む展開も十分に考えられる。
多くの人は震荡の中で方向感を失い、短期的な陰線に怖じ気づいてしまうが、トレンドの力を見落としている。今の反発は、むしろ乗車のチャンスであり、離脱の理由ではない。
大きなキャンドルは市場のリーダーであり、その方向性が市
BTC-1.24%
- 報酬
- いいね
- コメント
- リポスト
- 共有
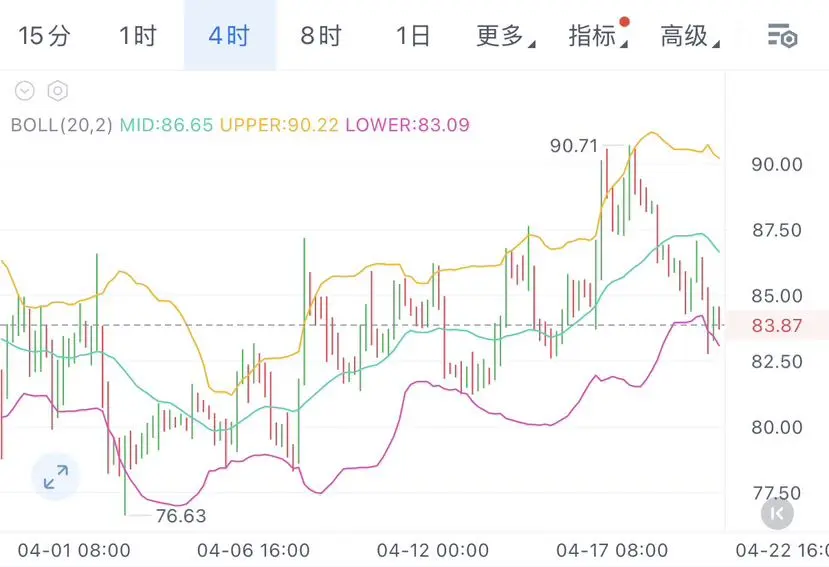
ソラナの4時間足は引き続き弱含みで、ボリンジャーバンドの下限を割り込み、86付近に明らかな圧力があり、現状反発の力不足が見られる。現在83付近で弱気の持ち合いが続き、売り圧力が優勢。
提案
85付近で売り、80を目指す
原文表示提案
85付近で売り、80を目指す
- 報酬
- いいね
- コメント
- リポスト
- 共有
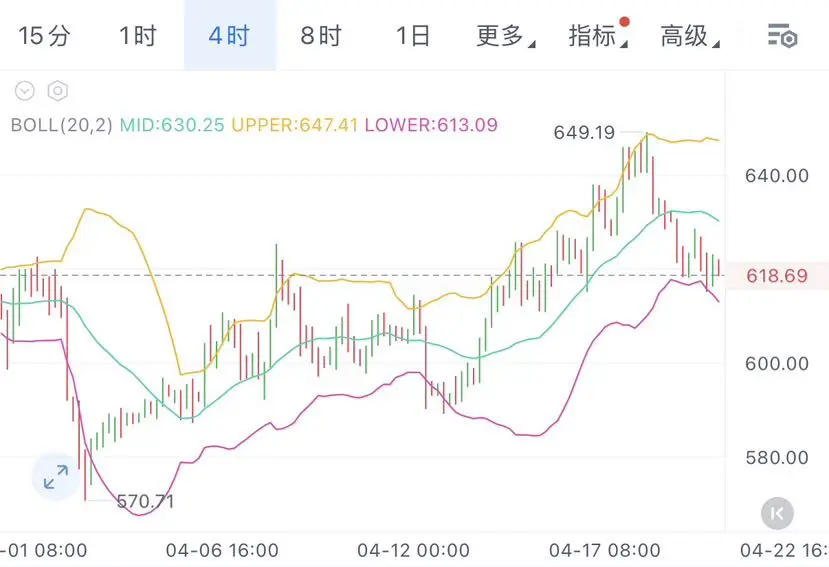
币安币在布林中轨下方持续承压,上方625附近是明确压力位。当前在618附近弱势盘整,反弹无力,大概率下探布林下轨支撑。
建议
623附近开空,先看615,跌破后看605,防守位放在630
建议
623附近开空,先看615,跌破后看605,防守位放在630
BNB0.23%
- 報酬
- いいね
- コメント
- リポスト
- 共有
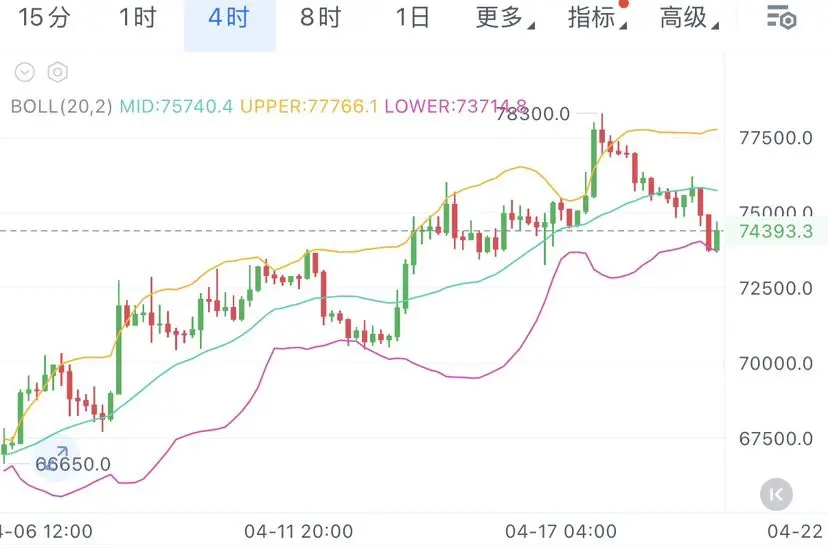
昨日明確空売りを宣言し、77000付近の高値から直接空売りを開始、今までずっと持ち続けており、正確に布林帯の中軌を下回る下落のリズムを捉えました!!!
今日の相場を整理すると、ビットコインは78300の高値から一気に下落し、すでに布林帯の中軌を下回っています。現在は完全に弱気市場の主導であり、反発のたびに空売りにチャンスを与えています!
布林帯の下限のサポートラインも危険な状態で、何度もテストされているものの反発は伴っていません。もし割り込めば、次のターゲットは72000付近の前期のレンジ帯、さらには70000の節目に戻る可能性も排除できません!
推奨
74500付近で空売りし、73000の割れ後に72000を見据える
今日の相場を整理すると、ビットコインは78300の高値から一気に下落し、すでに布林帯の中軌を下回っています。現在は完全に弱気市場の主導であり、反発のたびに空売りにチャンスを与えています!
布林帯の下限のサポートラインも危険な状態で、何度もテストされているものの反発は伴っていません。もし割り込めば、次のターゲットは72000付近の前期のレンジ帯、さらには70000の節目に戻る可能性も排除できません!
推奨
74500付近で空売りし、73000の割れ後に72000を見据える
BTC-1.24%
- 報酬
- いいね
- コメント
- リポスト
- 共有
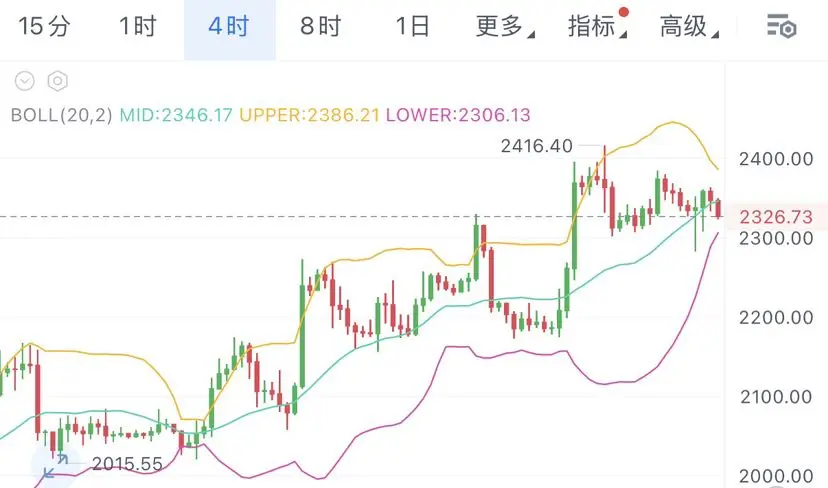
二饼目前布林带上轨开始拐头向下,形成明显的冲高回落形态,说明上方抛压沉重!
目前成交额与持仓量同步下滑,属于典型的无量反弹后放量下跌,说明多头缺乏持续增量资金,反弹仅为存量博弈,难以形成趋势性上涨!
建议
2350附近空看2270
目前成交额与持仓量同步下滑,属于典型的无量反弹后放量下跌,说明多头缺乏持续增量资金,反弹仅为存量博弈,难以形成趋势性上涨!
建议
2350附近空看2270
- 報酬
- いいね
- コメント
- リポスト
- 共有
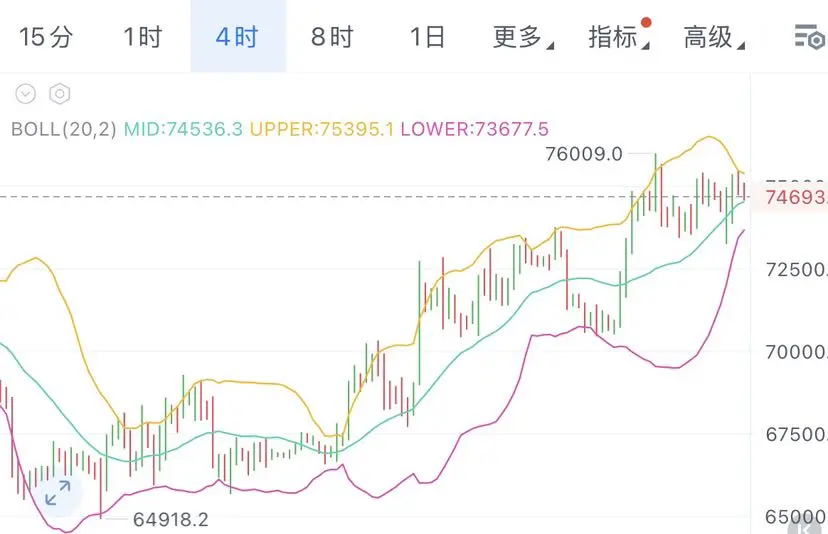
大きなパンが76000付近で抵抗に遭った後、連続して2本のローソク足が下落し、すでに上限の75400付近を割り込んでいます。これは上限の圧力が効き始めたことを示し、短期的な強気の勢いが明らかに衰退し、高値で資金の利食いが行われていることを意味します。
現在は74700付近で、ちょうどボリンジャーバンドの中間線付近に位置しており、これは日内の買いと売りの分岐点です。74700を上回って出来高を伴って安定しない限り、引き続き圧力を受けて下落する可能性があります。
ボリンジャーバンドの上限はすでに反転し始めており、チャネルは平坦化または縮小の兆候を示しています。これは高値圏での震荡相の強気相が終了し、調整局面に入ったことを意味します。一方、下限は依然として上昇しており、下落の緩衝スペースを提供しているため、ほぼ陰線による下落とリバウンドの繰り返しであり、直接的な大暴落ではありません。
推奨:
74800付近で売り、73700で買い、ストップロスは75500に設定してください。
BTC-1.24%
- 報酬
- 2
- コメント
- リポスト
- 共有
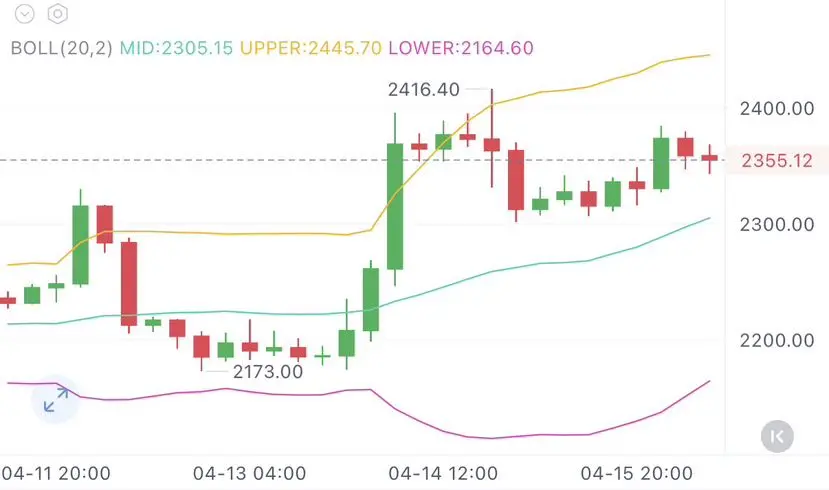
二饼布林带指标確認支撐有效性
4時間級別布林帶指標顯示,自下探2306低點後快速反彈,當前穩穩站於中軌上方,且布林帶中軌呈現向上拐頭態勢,說明短期上升趨勢明確;
距離上軌仍有充足空間,波動率未出現超買信號,這說明上行动能未被透支。
從K線結構看,當前形態與趨勢共振,前期回調後已形成連續小陽線企穩形態,結合資金持續淨流入的量價配合,符合“回踩支撐後啟漲”的多頭啟動特徵,這進一步確認短期多頭主導權。
建議
2300附近多看2440 止損看2270
原文表示4時間級別布林帶指標顯示,自下探2306低點後快速反彈,當前穩穩站於中軌上方,且布林帶中軌呈現向上拐頭態勢,說明短期上升趨勢明確;
距離上軌仍有充足空間,波動率未出現超買信號,這說明上行动能未被透支。
從K線結構看,當前形態與趨勢共振,前期回調後已形成連續小陽線企穩形態,結合資金持續淨流入的量價配合,符合“回踩支撐後啟漲”的多頭啟動特徵,這進一步確認短期多頭主導權。
建議
2300附近多看2440 止損看2270
- 報酬
- いいね
- コメント
- リポスト
- 共有
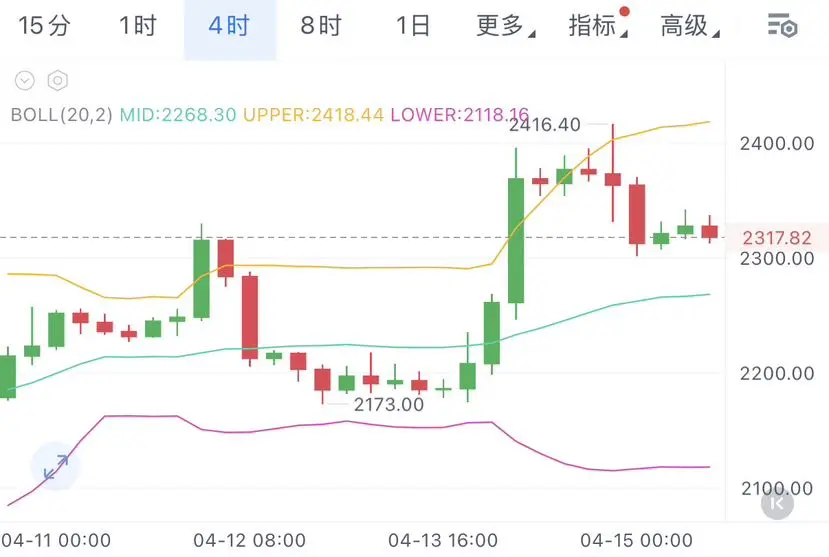
二饼は2410付近の前高から持続的に下落し、すでに短期上昇トレンドラインを割り込みました。現在、ボリンジャーバンドのミドルライン2270の上で震蕩し、上限の圧力2420にしっかりと抑えられています。開口部は拡大から平行へと変化し、典型的な高値圏での天井形成、多頭の退潮シグナルです。反発はむしろ空売りのチャンスです。
ローソク足は連続して陰線で下落し、4時間足レベルでも連続して大陰線を形成しています。反発の力は弱く、ピークは次第に低下し、底は継続的に下方に探っています。これは標準的な下降トレンドの兆候であり、2300-2280のサポートを割り込めば、新たな加速下落の局面が始まります。
提案:2340付近で空売りし、2260を狙う。
原文表示ローソク足は連続して陰線で下落し、4時間足レベルでも連続して大陰線を形成しています。反発の力は弱く、ピークは次第に低下し、底は継続的に下方に探っています。これは標準的な下降トレンドの兆候であり、2300-2280のサポートを割り込めば、新たな加速下落の局面が始まります。
提案:2340付近で空売りし、2260を狙う。
- 報酬
- 1
- コメント
- リポスト
- 共有
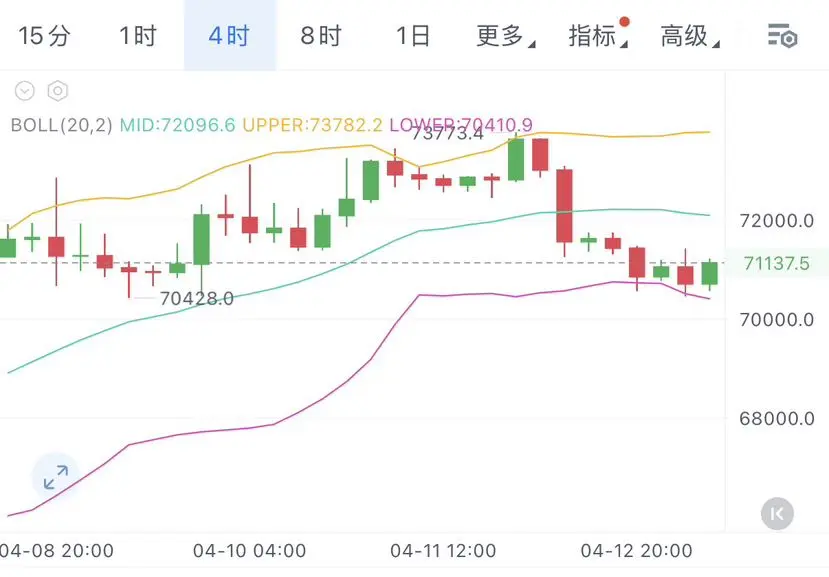
現在のビットコインは71100付近にあり、すでにボリンジャーバンドのミドルライン72100付近を下回っています。これは典型的な弱気のベアトレンドの格局です。資金面も追い打ちをかけており、空売りの勢いは全く衰える様子がありません。
現在、ボリンジャーバンドは下向きに開き、価格は下軌道に沿って推移しており、典型的な下落チャネルです。ミドルラインの72000付近はすでにサポートから強い圧力に変わっており、反発は空売りのチャンスです。下限の70400は第一防衛線であり、これを割り込めば、次は70000の整数関門に到達し、下方の空間は一気に開きます。
推奨
72000付近で売り、70500で損切り、72500で利益確定
現在、ボリンジャーバンドは下向きに開き、価格は下軌道に沿って推移しており、典型的な下落チャネルです。ミドルラインの72000付近はすでにサポートから強い圧力に変わっており、反発は空売りのチャンスです。下限の70400は第一防衛線であり、これを割り込めば、次は70000の整数関門に到達し、下方の空間は一気に開きます。
推奨
72000付近で売り、70500で損切り、72500で利益確定
BTC-1.24%
- 報酬
- いいね
- コメント
- リポスト
- 共有
人気の話題
もっと見る537.38K 人気度
106.31M 人気度
43.57K 人気度
3.28M 人気度
1.42M 人気度
ピン