#Get2SharesOfSKHynixAtZeroCost
🚀 Get 2 FREE Shares of SK Hynix Worth Up to $3,400 — The Biggest Korean Stock Reward Event of 2026!
🔥 Introduction
What if your normal trading activity could earn you up to 2 full shares of SK Hynix completely free?
That's exactly what Gate is offering through its latest Korean Stocks promotion. From June 23, 2026, to June 30, 2026, traders have a unique chance to accumulate SK Hynix stock rewards simply by participating in stock trading activities on the platform.
With SK Hynix now standing at the center of the global AI revolution and recently overtaking Samsung Electronics in market value, this campaign could become one of the most valuable stock reward events of the year.
🎯 Why Everyone Is Talking About SK Hynix
SK Hynix is no ordinary semiconductor company.
✅ World's leading producer of High Bandwidth Memory (HBM)
✅ Key supplier for NVIDIA's AI chips
✅ Most 2026 HBM production already sold out
✅ Recently surpassed Samsung Electronics in market capitalization
✅ Filed a massive $29.4 Billion Nasdaq ADR listing
✅ Direct beneficiary of the global Artificial Intelligence boom
As AI demand continues exploding worldwide, SK Hynix has become one of the most sought-after semiconductor stocks among institutional investors.
💰 How To Earn 2 Shares For Free
Gate has divided rewards into three major categories.
1️⃣ Registration Reward Pool
This is the easiest reward available.
The first 2,000 eligible users who have never traded stocks on Gate can share a reward pool worth approximately 3,400 USDT in SK Hynix stock rewards.
Requirements:
✔ Register during the campaign
✔ Be a new stock trader
✔ Claim your spot before the pool fills
No large capital is required.
Early registration significantly improves your chances.
2️⃣ First Trade Reward
New users can unlock additional rewards simply by placing their first stock trade.
Qualification:
• Trade SK Hynix or Samsung Electronics
• Reach at least 500 USDT cumulative trading volume
• Receive 5–17 USDT equivalent in SK Hynix rewards
Prize Pool:
17,000 USDT
First Come — First Served
This means your capital remains yours while
receiving extra stock rewards on top.
3️⃣ Buy Stocks, Get Stocks Airdrop
This is where the real opportunity begins.
For every:
10,000 USDT Trading Volume
Users receive a random SK Hynix stock airdrop.
Reward Range:
• 0.01 Share
to
• 0.50 Share
Maximum Reward:
2 Full SK Hynix Shares
Estimated Value:
≈ 3,400 USDT
Higher trading volume increases your ranking
and your chances of receiving larger rewards.
📊 Step-by-Step Participation Guide
Step 1
Register through the official event page.
Step 2
Open:
Stocks → Korean Stocks
Step 3
Transfer USDT to your Stock Account.
Step 4
Trade during Korean market hours:
00:00–06:20 UTC
Step 5
Increase cumulative volume to unlock larger rewards.
📈 SK Hynix Technical Outlook
Current Price Range
1,700–1,800 USDT
Resistance Levels
🔴 R1: 1,850 USDT
🔴 R2: 1,905 USDT
🔴 R3: 2,015 USDT
🔴 ATH Zone: 2,030 USDT
Support Levels
🟢 S1: 1,690 USDT
🟢 S2: 1,585–1,655 USDT
🟢 S3: 1,380 USDT
Trend Analysis
Short-Term Outlook:
Bearish Correction
Long-Term Outlook:
Strong Bullish Trend
Overall Market Bias:
Bullish
Current weakness appears to be a temporary correction within a much larger AI-driven uptrend.
🤖 The AI Revolution Is Fueling SK Hynix
Several major developments continue supporting long-term growth.
NVIDIA Partnership Expansion
NVIDIA CEO Jensen Huang recently highlighted
SK Hynix's importance during Computex 2026.
The partnership focuses on next-generation AI memory solutions for future AI factories.
HBM4E Technology Leadership
SK Hynix recently shipped 12-layer HBM4E samples featuring:
✔ 16Gbps speed
✔ Lower heat generation
✔ Improved efficiency
This strengthens its leadership position over competitors.
2026 Supply Already Sold Out
Most HBM production capacity for 2026 has already been reserved.
Demand continues exceeding supply.
This creates powerful pricing strength and revenue growth potential.
Nasdaq Listing Catalyst
The company recently announced plans for a massive Nasdaq ADR listing worth approximately 29.4 Billion USD.
Following the announcement, shares surged significantly as investors anticipated broader international participation.
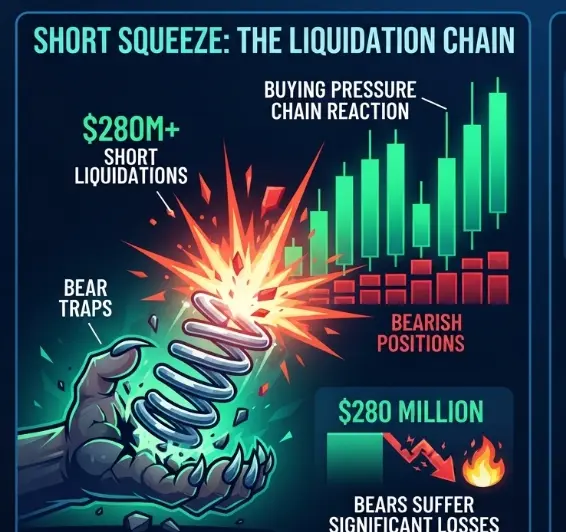
⚠️ Recent Market Crash Explained
On June 23, semiconductor stocks experienced a sharp selloff.
SK Hynix dropped more than 12%.
Samsung Electronics also faced heavy selling pressure.
The broader market panic was driven by:
• NVIDIA production concerns
• Profit taking
• Global technology sector weakness
However, industry analysts continue viewing this as a healthy correction rather than the end of the AI boom.
The core fundamentals remain extremely strong.
💡 Best Strategy For Participants
Small Investors
Register immediately.
Complete the 500 USDT trading requirement.
Collect both registration and first-trade rewards.
Medium Traders
Target 10,000–40,000 USDT trading volume.
Unlock multiple airdrop opportunities.
High-Volume Traders
Aim for the maximum 2-share reward.
Combine all Korean stock campaigns to maximize earnings.
Potential rewards can exceed several thousand dollars in stock value.
⏳ Final Countdown
The campaign ends on:
June 30, 2026 — 16:00 UTC
Only a limited number of Korean trading sessions remain.
Every missed session reduces your opportunity to build volume and qualify for larger rewards.
🚀 Final Verdict
Gate's SK Hynix campaign is one of the most attractive stock reward events currently available.
Participants can potentially earn up to:
💰 2 FREE SK Hynix Shares
💰 Worth Approximately 3,400 USDT
💰 Plus Additional Rewards From Parallel Campaigns
With SK Hynix positioned at the center of the AI memory boom, sold-out HBM demand, expanding NVIDIA partnerships, and a major Nasdaq listing ahead, the company remains one of the strongest AI infrastructure plays globally.
If you were already planning to trade stocks, this promotion allows you to turn normal trading activity into real stock ownership at zero additional cost.
Register early, trade strategically, and maximize every reward tier before the event closes.
@ga
🚀 Get 2 FREE Shares of SK Hynix Worth Up to $3,400 — The Biggest Korean Stock Reward Event of 2026!
🔥 Introduction
What if your normal trading activity could earn you up to 2 full shares of SK Hynix completely free?
That's exactly what Gate is offering through its latest Korean Stocks promotion. From June 23, 2026, to June 30, 2026, traders have a unique chance to accumulate SK Hynix stock rewards simply by participating in stock trading activities on the platform.
With SK Hynix now standing at the center of the global AI revolution and recently overtaking Samsung Electronics in market value, this campaign could become one of the most valuable stock reward events of the year.
🎯 Why Everyone Is Talking About SK Hynix
SK Hynix is no ordinary semiconductor company.
✅ World's leading producer of High Bandwidth Memory (HBM)
✅ Key supplier for NVIDIA's AI chips
✅ Most 2026 HBM production already sold out
✅ Recently surpassed Samsung Electronics in market capitalization
✅ Filed a massive $29.4 Billion Nasdaq ADR listing
✅ Direct beneficiary of the global Artificial Intelligence boom
As AI demand continues exploding worldwide, SK Hynix has become one of the most sought-after semiconductor stocks among institutional investors.
💰 How To Earn 2 Shares For Free
Gate has divided rewards into three major categories.
1️⃣ Registration Reward Pool
This is the easiest reward available.
The first 2,000 eligible users who have never traded stocks on Gate can share a reward pool worth approximately 3,400 USDT in SK Hynix stock rewards.
Requirements:
✔ Register during the campaign
✔ Be a new stock trader
✔ Claim your spot before the pool fills
No large capital is required.
Early registration significantly improves your chances.
2️⃣ First Trade Reward
New users can unlock additional rewards simply by placing their first stock trade.
Qualification:
• Trade SK Hynix or Samsung Electronics
• Reach at least 500 USDT cumulative trading volume
• Receive 5–17 USDT equivalent in SK Hynix rewards
Prize Pool:
17,000 USDT
First Come — First Served
This means your capital remains yours while
receiving extra stock rewards on top.
3️⃣ Buy Stocks, Get Stocks Airdrop
This is where the real opportunity begins.
For every:
10,000 USDT Trading Volume
Users receive a random SK Hynix stock airdrop.
Reward Range:
• 0.01 Share
to
• 0.50 Share
Maximum Reward:
2 Full SK Hynix Shares
Estimated Value:
≈ 3,400 USDT
Higher trading volume increases your ranking
and your chances of receiving larger rewards.
📊 Step-by-Step Participation Guide
Step 1
Register through the official event page.
Step 2
Open:
Stocks → Korean Stocks
Step 3
Transfer USDT to your Stock Account.
Step 4
Trade during Korean market hours:
00:00–06:20 UTC
Step 5
Increase cumulative volume to unlock larger rewards.
📈 SK Hynix Technical Outlook
Current Price Range
1,700–1,800 USDT
Resistance Levels
🔴 R1: 1,850 USDT
🔴 R2: 1,905 USDT
🔴 R3: 2,015 USDT
🔴 ATH Zone: 2,030 USDT
Support Levels
🟢 S1: 1,690 USDT
🟢 S2: 1,585–1,655 USDT
🟢 S3: 1,380 USDT
Trend Analysis
Short-Term Outlook:
Bearish Correction
Long-Term Outlook:
Strong Bullish Trend
Overall Market Bias:
Bullish
Current weakness appears to be a temporary correction within a much larger AI-driven uptrend.
🤖 The AI Revolution Is Fueling SK Hynix
Several major developments continue supporting long-term growth.
NVIDIA Partnership Expansion
NVIDIA CEO Jensen Huang recently highlighted
SK Hynix's importance during Computex 2026.
The partnership focuses on next-generation AI memory solutions for future AI factories.
HBM4E Technology Leadership
SK Hynix recently shipped 12-layer HBM4E samples featuring:
✔ 16Gbps speed
✔ Lower heat generation
✔ Improved efficiency
This strengthens its leadership position over competitors.
2026 Supply Already Sold Out
Most HBM production capacity for 2026 has already been reserved.
Demand continues exceeding supply.
This creates powerful pricing strength and revenue growth potential.
Nasdaq Listing Catalyst
The company recently announced plans for a massive Nasdaq ADR listing worth approximately 29.4 Billion USD.
Following the announcement, shares surged significantly as investors anticipated broader international participation.
⚠️ Recent Market Crash Explained
On June 23, semiconductor stocks experienced a sharp selloff.
SK Hynix dropped more than 12%.
Samsung Electronics also faced heavy selling pressure.
The broader market panic was driven by:
• NVIDIA production concerns
• Profit taking
• Global technology sector weakness
However, industry analysts continue viewing this as a healthy correction rather than the end of the AI boom.
The core fundamentals remain extremely strong.
💡 Best Strategy For Participants
Small Investors
Register immediately.
Complete the 500 USDT trading requirement.
Collect both registration and first-trade rewards.
Medium Traders
Target 10,000–40,000 USDT trading volume.
Unlock multiple airdrop opportunities.
High-Volume Traders
Aim for the maximum 2-share reward.
Combine all Korean stock campaigns to maximize earnings.
Potential rewards can exceed several thousand dollars in stock value.
⏳ Final Countdown
The campaign ends on:
June 30, 2026 — 16:00 UTC
Only a limited number of Korean trading sessions remain.
Every missed session reduces your opportunity to build volume and qualify for larger rewards.
🚀 Final Verdict
Gate's SK Hynix campaign is one of the most attractive stock reward events currently available.
Participants can potentially earn up to:
💰 2 FREE SK Hynix Shares
💰 Worth Approximately 3,400 USDT
💰 Plus Additional Rewards From Parallel Campaigns
With SK Hynix positioned at the center of the AI memory boom, sold-out HBM demand, expanding NVIDIA partnerships, and a major Nasdaq listing ahead, the company remains one of the strongest AI infrastructure plays globally.
If you were already planning to trade stocks, this promotion allows you to turn normal trading activity into real stock ownership at zero additional cost.
Register early, trade strategically, and maximize every reward tier before the event closes.
@ga