Summary
-
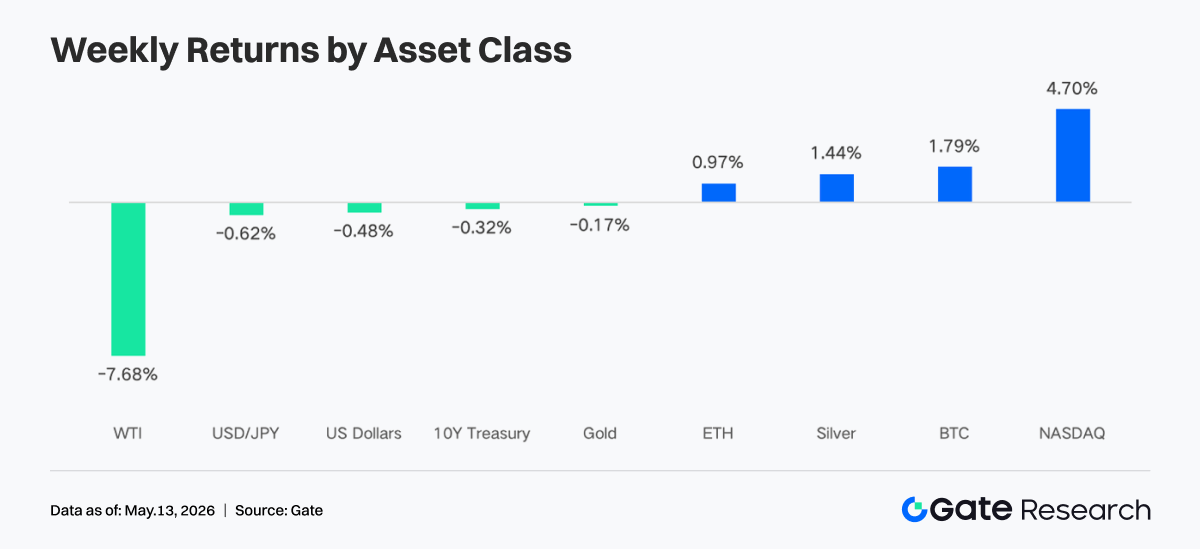
Last week, the market switched from “war safe-haven” trading to “soft landing + rate-cut expectations” trading. Positive signals from the Middle East ceasefire proposal, together with earnings from AI and technology companies, drove the Nasdaq up 4.70% for the week; BTC broke above USD 82,000, supported by continued ETF inflows.
-
BTC ETFs recorded weekly net inflows of USD 632 million, with IBIT continuing to dominate institutional capital flows; ETH ETFs turned from negative to positive, with ETHA becoming the main source of incremental inflows, showing a clear improvement in institutional allocation sentiment.
-
On-chain TradFi trading was dominated by macro assets such as gold and crude oil, while the share of stock- and ETF-related trading continued to recover; the number of CEX TradFi assets continued to expand, with stocks seeing the most notable growth.
-
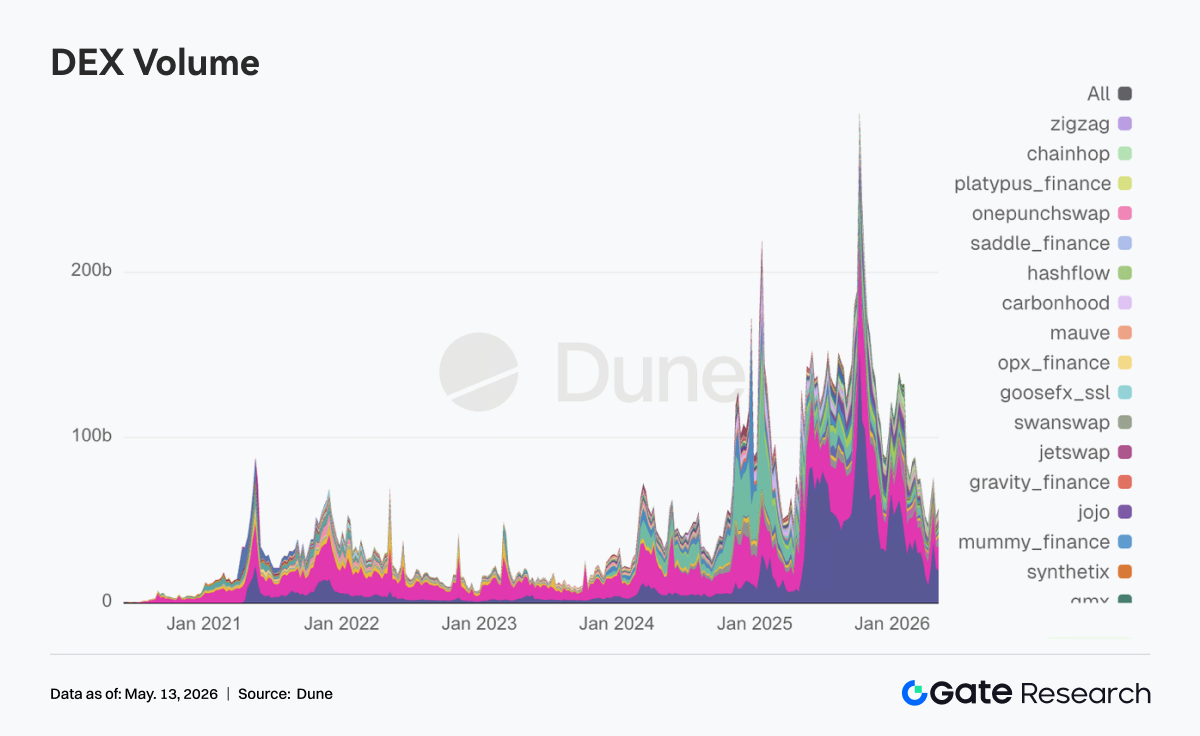
On-chain capital returned to leading DEXs and mature liquidity scenarios, with Uniswap and PancakeSwap as the core receiving platforms; the stablecoin market leaned toward USD assets with stronger compliance, settlement, and cross-chain capabilities.
-
Aave is still digesting the impact of the rsETH incident, and the lending market remains weak; new scenarios such as MegaETH and Plasma have begun to absorb incremental capital, while Solana LSTs were the first to benefit from the recovery in risk appetite.
-
The derivatives market continued the structure of “negative funding rates + high-level consolidation,” with the BTC short-squeeze rally being released in stages; options trading volume and implied volatility expanded during the breakout phase, then cooled again.
-
In May, Gate institutional spot volume increased 14.54% MoM, while futures volume increased 18.10% MoM; CrossEx reached new highs in trading volume and capital deposits for three consecutive weeks; Gate Institutional Circle Amsterdam is now in the preparation stage.
1. Market Focus Analysis
The U.S. proposed a ceasefire plan with substantive progress significance, covering 14 terms including the suspension of Iran’s nuclear enrichment activities, gradual lifting of sanctions, and removal of restrictions related to the Strait of Hormuz. Sources said this is the closest the two sides have come to reaching an agreement since the outbreak of the conflict. The market responded positively to this news, and together with strong earnings across industries, especially from technology and artificial intelligence companies, the Nasdaq rose sharply by 4.70% for the week, reaching a recent high. Meanwhile, although geopolitical conflict provided support for gold and silver, the sharp decline in crude oil prices as concerns over supply disruptions eased, with WTI falling 7.68% for the week, cooled inflation expectations and limited gold’s gains. In crypto, Bitcoin steadily broke through the USD 82,000 level, driven by continued spot ETF inflows and improved market liquidity. In FX, the U.S. Dollar Index weakened due to dovish Fed remarks, supporting a slight rebound in the yen.
Despite the impact of the oil crisis, the latest labor market data still showed improvement. In March and April, nonfarm payrolls increased for two consecutive months, reaching the highest level in nearly a year, bringing the average monthly increase in private-sector employment so far this year close to 90,000. Meanwhile, the unemployment rate has fallen from its 2025 peak, with the latest April data showing an unemployment rate of 4.3%, unchanged from the previous year. Overall, the market has shifted from early-week “war panic” to optimistic pricing of an “economic soft landing” and “room for Fed rate cuts.”
2. Liquidity Analysis
1. BTC ETF Scale Continues to Expand
Last week, BTC ETFs showed a “strong opening, weak closing” pattern overall, recording net inflows for the first three trading days and turning to net outflows in the final two days. BTC ETFs recorded total weekly net inflows of USD 631.6 million, a sharp increase from the previous week, indicating overall positive market sentiment. ETH ETFs recorded total weekly net inflows of USD 70.3 million, a clear improvement from the previous week, turning from negative to positive.
-
Overall AUM: As of May 8, total BTC ETF net assets were approximately USD 106.77 billion, with historical cumulative net inflows exceeding USD 59.4 billion; total ETH ETF net assets were approximately USD 13.6 billion, with historical cumulative net inflows of around USD 12.1 billion, and ETF net assets accounting for about 4.94% of Ethereum’s total market capitalization. BTC ETF scale continued to expand, with IBIT’s single-fund AUM reaching approximately USD 66.9 billion, accounting for about 66% of the entire BTC ETF market, exceeding most traditional commodity ETFs in size.
-
Institutional trends: Capital flows diverged clearly this week. IBIT recorded weekly net inflows of USD 596.3 million, ranking first by far and continuing its dominant position in institutional allocation; ARKB ranked second with USD 53.1 million, showing that some institutions still have interest in high-beta strategic products. By contrast, FBTC recorded only USD 52.2 million in weekly net inflows, with relatively large outflows on Thursday and Friday, totaling about USD 226.6 million, reflecting a more cautious institutional holding attitude toward Fidelity’s product. GBTC continued structural outflows, with weekly net outflows of USD 62.3 million. For ETH ETFs, ETHA led with USD 100.1 million in net inflows, while FETH recorded weekly net outflows of USD 32.2 million due to a single-day outflow of USD 62.3 million on Thursday, showing clear divergence between the two major ETH products.
2. TradFi Liquidity
-
TradFi Perp DEX: Over the past week, the trading structure of TradFi Perp DEX remained centered on commodities, with the share staying above about 60%, showing that macro assets such as gold and crude oil still dominate on-chain TradFi trading demand. Against the backdrop of ongoing geopolitical risk and safe-haven sentiment, capital clearly preferred commodity assets with higher volatility and more direct narratives. Meanwhile, the share of Indices/ETFs and Stocks continued to recover steadily, reflecting that some capital has begun to re-enter trading opportunities related to U.S. equity indices and ETFs; the share of traditional macro assets such as FX and Bonds remained low. Overall, current trading preferences on TradFi DEX remain highly concentrated on the “macro trading” theme, and on-chain capital risk appetite has not yet clearly shifted toward low-volatility assets.
-
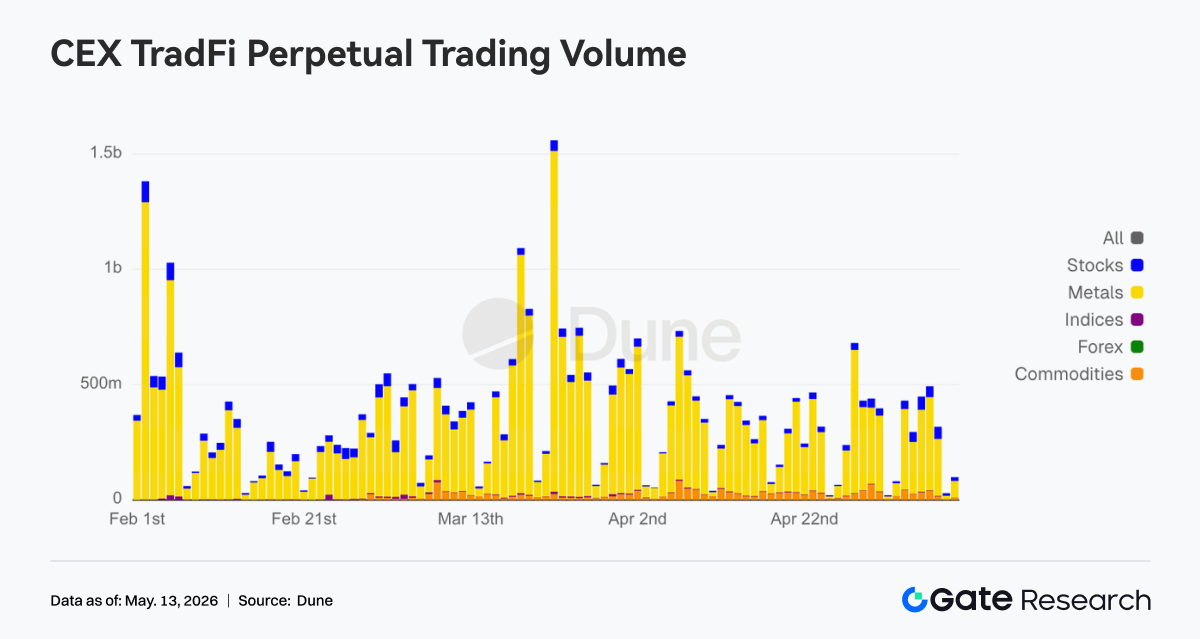
TradFi Perp CEX: Over the past week, CEX TradFi perpetual contract trading volume generally remained at a high and volatile level, with metals such as gold continuing to dominate absolutely. The precious metals sector still contributed the vast majority of turnover, reflecting continued strong market participation in safe-haven and macro trading assets. Meanwhile, stock-sector trading volume remained stable, showing that capital continues to focus on volatility opportunities in U.S. equity indices and technology stocks; commodities saw a temporary volume increase driven by oil price fluctuations. Overall, the current CEX TradFi trading structure is still centered on gold, with macro events and safe-haven demand continuing to dominate market risk appetite.
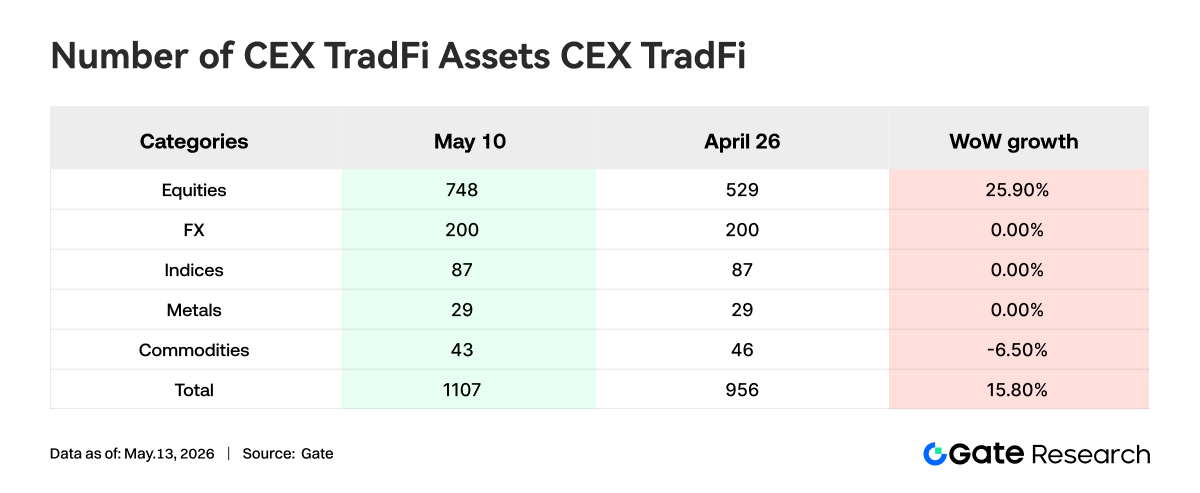
- Number of CEX TradFi assets: Over the past week, the number of CEX TradFi asset categories expanded further. Across three major CEXs, the total number of TradFi assets, counting only TradFi and CFD sectors and excluding perpetual contracts, increased from 956 to 1,107, up 15.80% from the end of April. Stocks saw the most significant growth, increasing from 594 to 748, up 25.90% from the end of April; Gate’s stock-type TradFi assets increased by 104 from the end of April, a growth rate of 38.95%.
- TradFi order book depth: We selected XAUT, the TradFi asset with the highest trading volume, to analyze its order book depth, Delta. Over the past week, XAUT’s depth structure showed a clear pattern of “price rising, sell-side thickening.” From May 4 to May 5, order book Delta once recorded consecutive positive values exceeding USD 1 million, showing a significant increase in buyer aggressiveness, but the price still temporarily fell back to around USD 4,500, reflecting strong support at lower levels. From May 6 onward, as gold prices quickly rose above USD 4,700, order book Delta turned persistently negative, with multiple single-hour liquidity outflows exceeding USD 1.5 million, indicating a clear increase in sell orders at high levels, with some capital beginning to take profit or hedge actively. Even so, the overall XAUT price remained in high-level consolidation, indicating that market allocation demand for gold as a safe-haven asset remains solid. The current depth structure has gradually shifted from the earlier “active buying driving the rise” stage to a “high-level selling pressure versus capital absorption” stage. In the short term, attention should be paid to whether liquidity support near USD 4,650 can be maintained.
3. On-Chain Data Insights
The DEX market in the first week of May showed a strong “returning to home field” feature. PancakeSwap ranked first, but incremental capital gave higher weight to deeper liquidity trading scenarios such as Uniswap and Aerodrome. The Solana side did not cool down, with Meteora and Raydium still active, and trading was not supported solely by a single Meme narrative as in previous weeks. After Bitcoin regained a key psychological level, the entire market’s risk appetite was reignited, and DEX trading switched back to a more active state. Notably, in Grayscale’s quarterly rebalancing of its DeFi fund that week, it removed Aerodrome, increased allocation to Ethena, and kept Uniswap as the largest weight, indicating that institutional capital still gives priority to mature liquidity protocols before selecting new narrative directions.
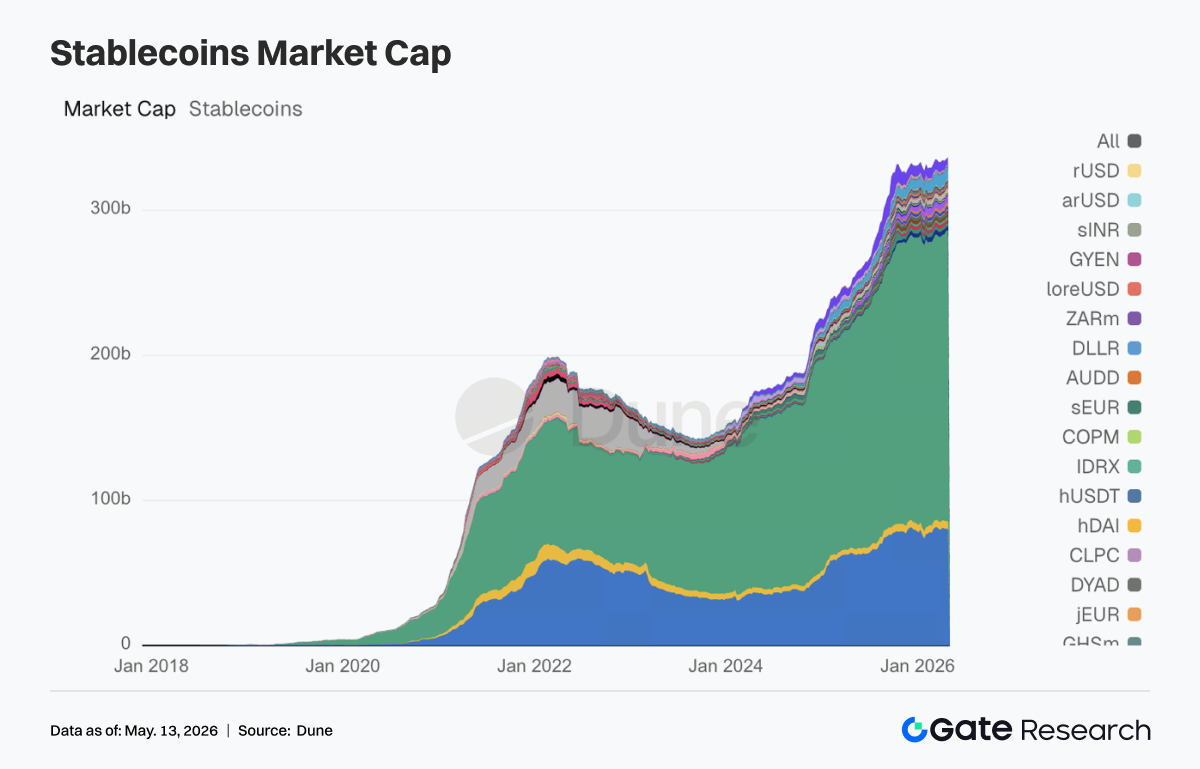
2. Market Attention Returns to Stablecoin Assets That Are Settleable, Compliant, and Cross-chain
In addition to the two leading stablecoins, USDT and USDC, payment-oriented, compliant stablecoins that can directly enter DeFi collateral and liquidation processes ranked higher this week, while yield-oriented and more experimental varieties cooled. This change echoed the policy side. Reuters reported that the Senate reached a key compromise around stablecoin reward and yield provisions, and the market quickly began to reassess which types of stablecoins best fit the next phase of the regulatory framework. Notably, Circle was intensively involved this week in bridging the real world, regulation, and ecosystem building. It obtained France’s MiCA-related authorization on May 4, submitted comments on the GENIUS rules the next day, and connected USDC and CCTP to Injective on May 7, moving further along the main line of compliant distribution and cross-chain settlement.
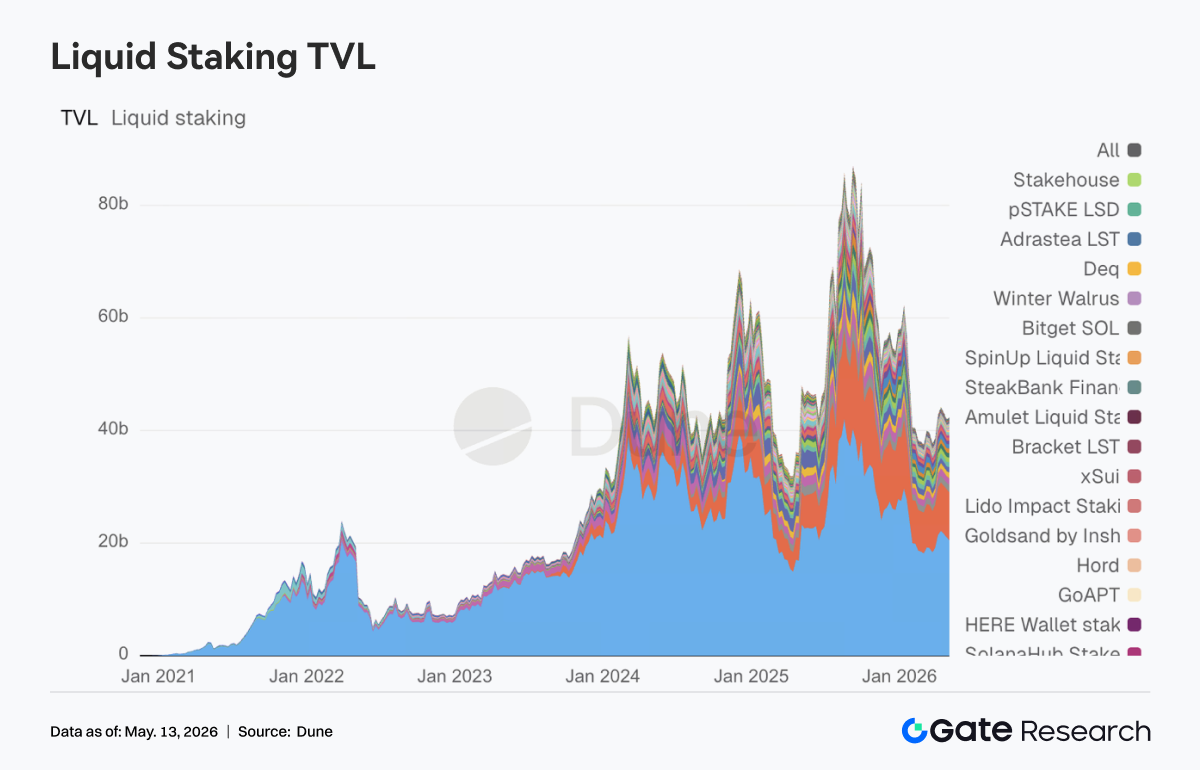
3. ETH LST Leaders Remain Stable, While Solana First Absorbs Risk Recovery
On the ETH side, leading protocols have not yet entered a one-sided strong recovery. Lido itself appeared relatively restrained, while Rocket Pool and StakeWise were relatively stable. By contrast, Solana-side LSTs were the first to benefit from the recovery in market risk appetite, with assets such as Sanctum and Jupiter Staked SOL seeing more active absorption, as capital became willing to reprice high-beta staking assets. Meanwhile, Lido obtained Web3SOC certification this week, continuing to advance the main themes of institutional due diligence, governance transparency, and security framework, further strengthening its slow-variable advantage among institutional capital.
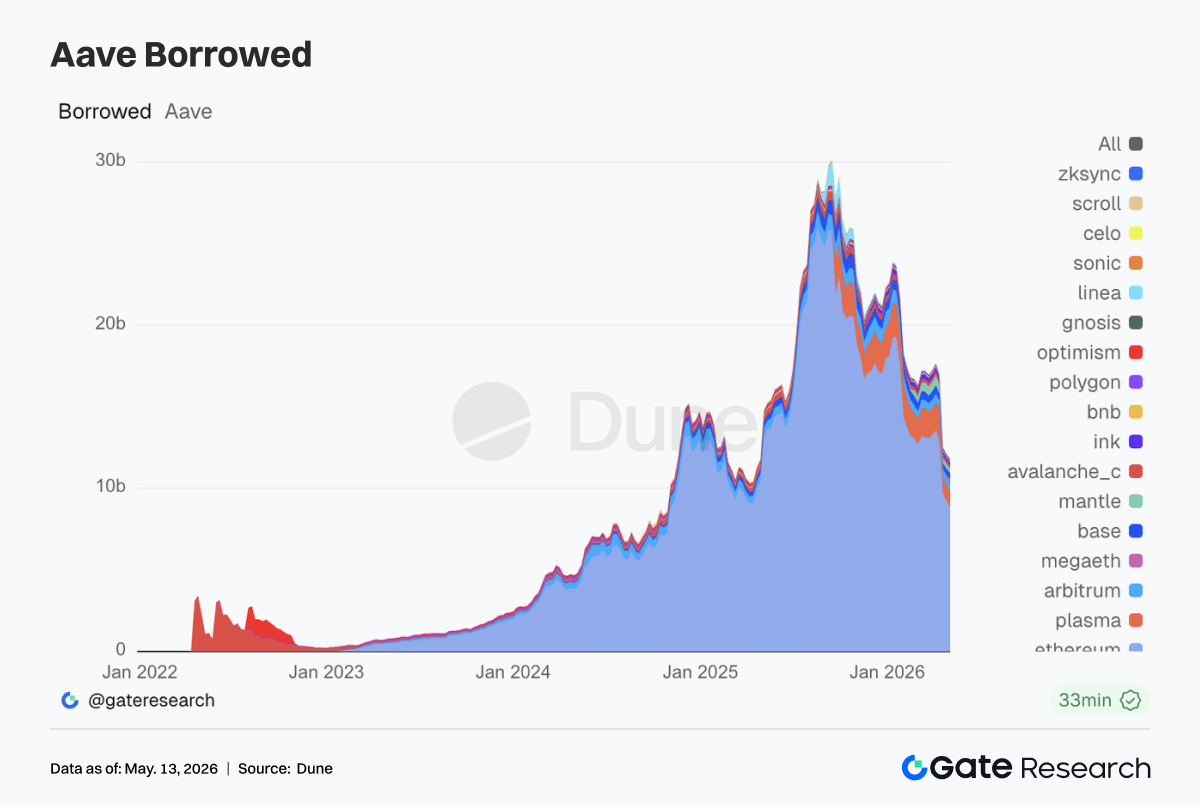
4. Aave Is Still Digesting the Aftermath of the rsETH Incident, While MegaETH Absorbed New Lending Demand
Aave’s lending data this week still carried strong traces of post-event repair. Lending on the Ethereum main market shrank again, while older main markets such as Arbitrum, Base, and Ink also remained weak. The picture of multi-chain recovery seen in previous weeks did not return. By contrast, Plasma continued to strengthen, and the lending book on the new chain MegaETH rose especially clearly. Capital moved from traditional main markets toward newer scenarios and markets with more incentive space. In its monthly update at the beginning of the month, Aave Labs directly stated that the rsETH incident had disrupted Aave V4’s early growth rhythm. Then on May 5, Aave Labs’ risk team advanced cap increases for EURC on Ethereum and USDm on MegaETH. Aave is shifting new growth points toward stablecoins with clearer regulatory attributes and lending markets on new chains that can more easily form closed loops.
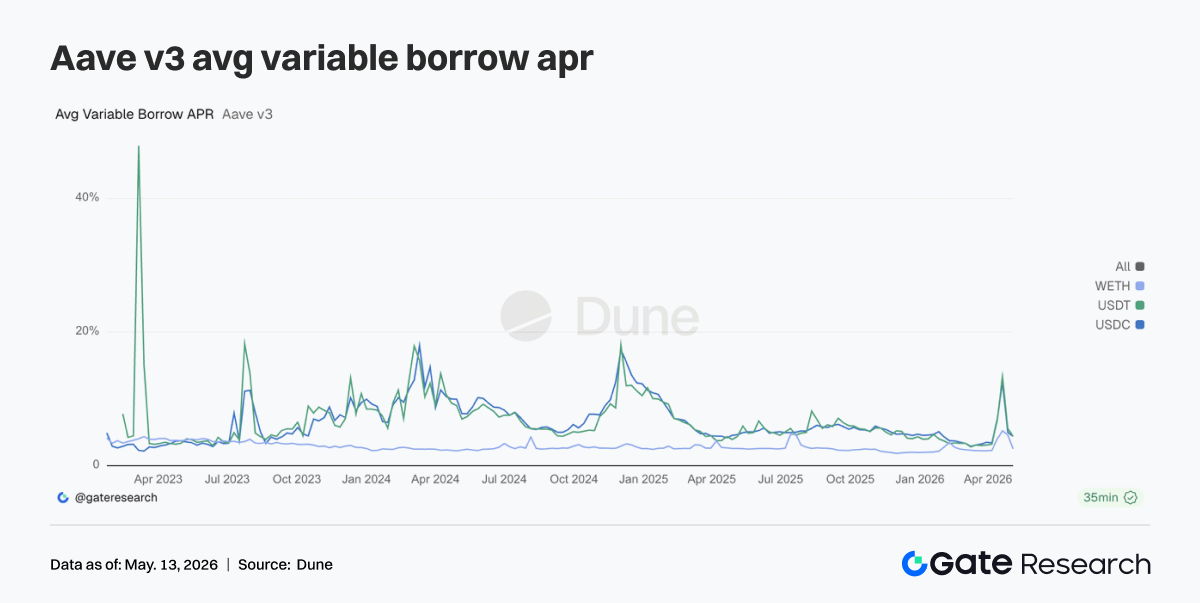
5. Aave Core Assets Retreat From Stress State, With WETH Leverage Cooling Most Clearly
Compared with the event-driven rise in interest rates seen in the previous two weeks, Aave lending rates cooled significantly this week. Average borrowing costs for USDC and USDT both returned to normal ranges, while WETH declined even faster. Looking at loan size together, market demand has shifted from “rushing for liquidity” back to “selectively borrowing liquidity.” This also explains why EURC and USDm were prioritized for supply cap increases, because demand for stablecoin borrowing still exists, but it is now more tilted toward structured arbitrage, regional currency demand, and incentive trading on new chains.
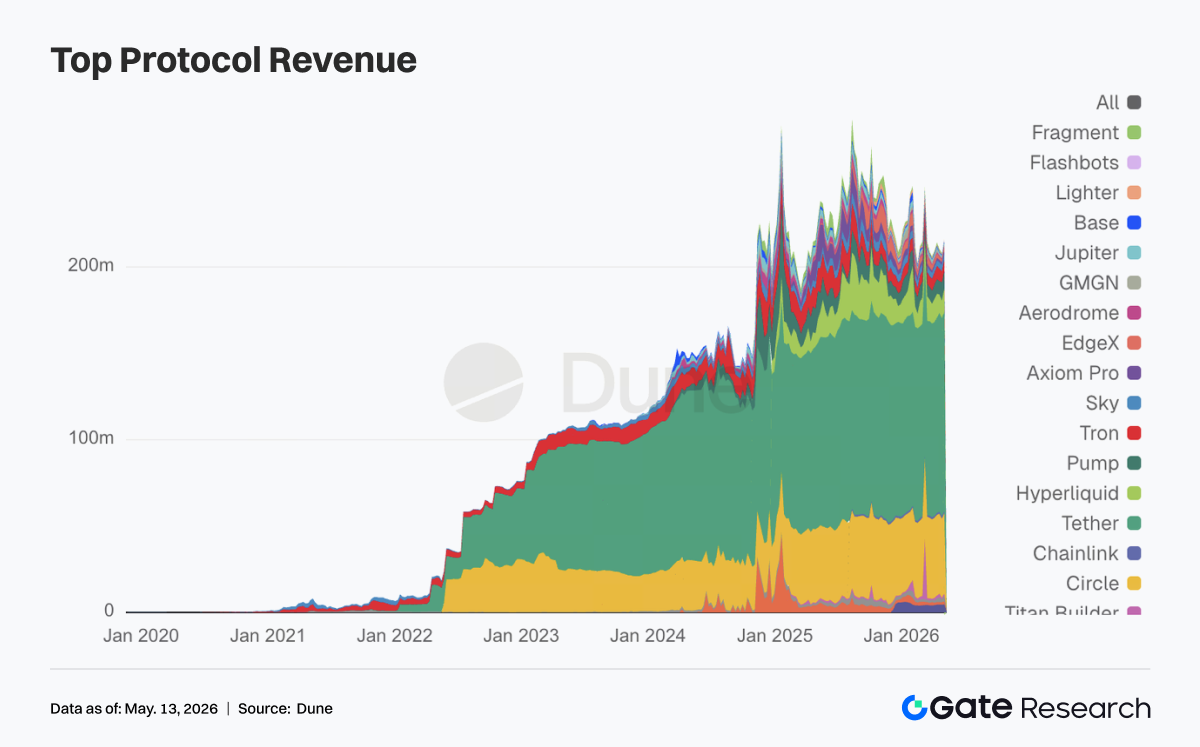
6. Protocol Revenue Returns to a Structure of Stablecoin Base, With Derivatives and Lending Providing Elasticity
Tether and Circle’s stablecoin issuance side continued to contribute the most stable cash flow. This week, elasticity mainly returned to on-chain derivatives and lending infrastructure. Hyperliquid remained highly popular, and Aave’s revenue elasticity was also significantly stronger than the previous week. Trading and liquidation demand did not die down because of the risk event in late April. Hyperliquid began entering Bitcoin outcome markets on May 5, while Hyperliquid Strategies disclosed an expansion of HYPE reserves and progress in validator cooperation. The market priced this as a signal of its shift from perpetuals toward a full financial stack. On the other hand, Aave’s revenue increase and lending book contraction appeared at the same time, behind which were post-event risk premiums and capital repricing.
4. Derivatives Tracking
4.1 BTC Funding Rates Deeply Negative While OI Rises, Strengthening the Short-squeeze Structure
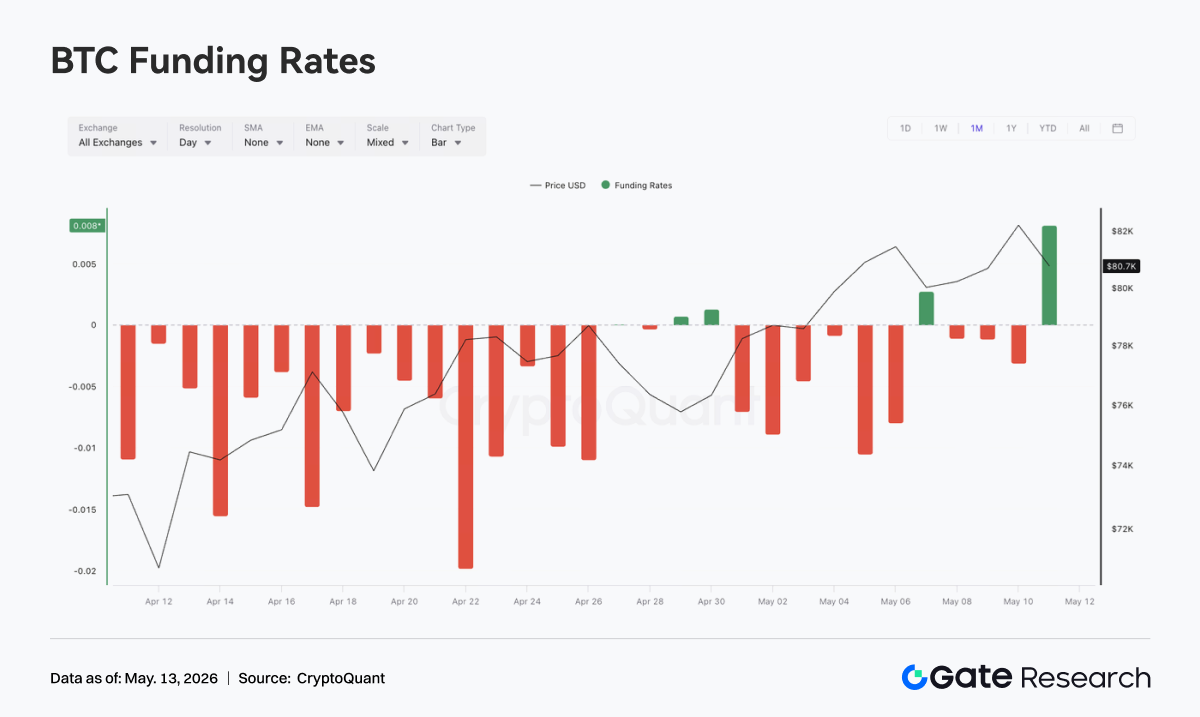
From May 4 to May 10, BTC price continued to rise overall and maintained high-level consolidation, moving from around 79K to above 82K. Although it fell back to around 80K near May 7, it then recovered again. In terms of funding rates, they remained negative for most of the week, especially around May 5 and May 6, when negative values were deeper, showing that short sentiment had not fully faded during the price rise, and the market still had a certain divergence structure of “price strength but bearish funding rates.”
Unlike the previous stage, OI surged above about 29B on May 5 and then quickly fell back, later fluctuating in the 26B to 27B range. Negative funding rates combined with a spike and retreat in OI indicate that the earlier crowded short structure had been partly released during the price rise, with some leveraged positions exiting either passively or actively. After May 7, BTC price maintained a high-level recovery, but OI failed to return to its previous high, indicating limited willingness for new leveraged chasing. The market gradually shifted from a short-squeeze accumulation stage of “shorts adding positions + price not falling” to a “post-squeeze high-level rotation” state.
Overall, the current derivatives structure still favors bulls, but short-squeeze momentum has been partially digested compared with around May 5. If price continues to break above 82K and OI rises at the same time, it may once again form resonance between leveraged chasing and short covering; but if price consolidates at high levels while OI continues to decline, it would indicate that this round of upside momentum came more from previous short covering, and follow-up spot buying or new long leverage will be needed.
4.2 Options Trading Volume Expanded Temporarily, While Monthly Contracts Still Dominated the Structure
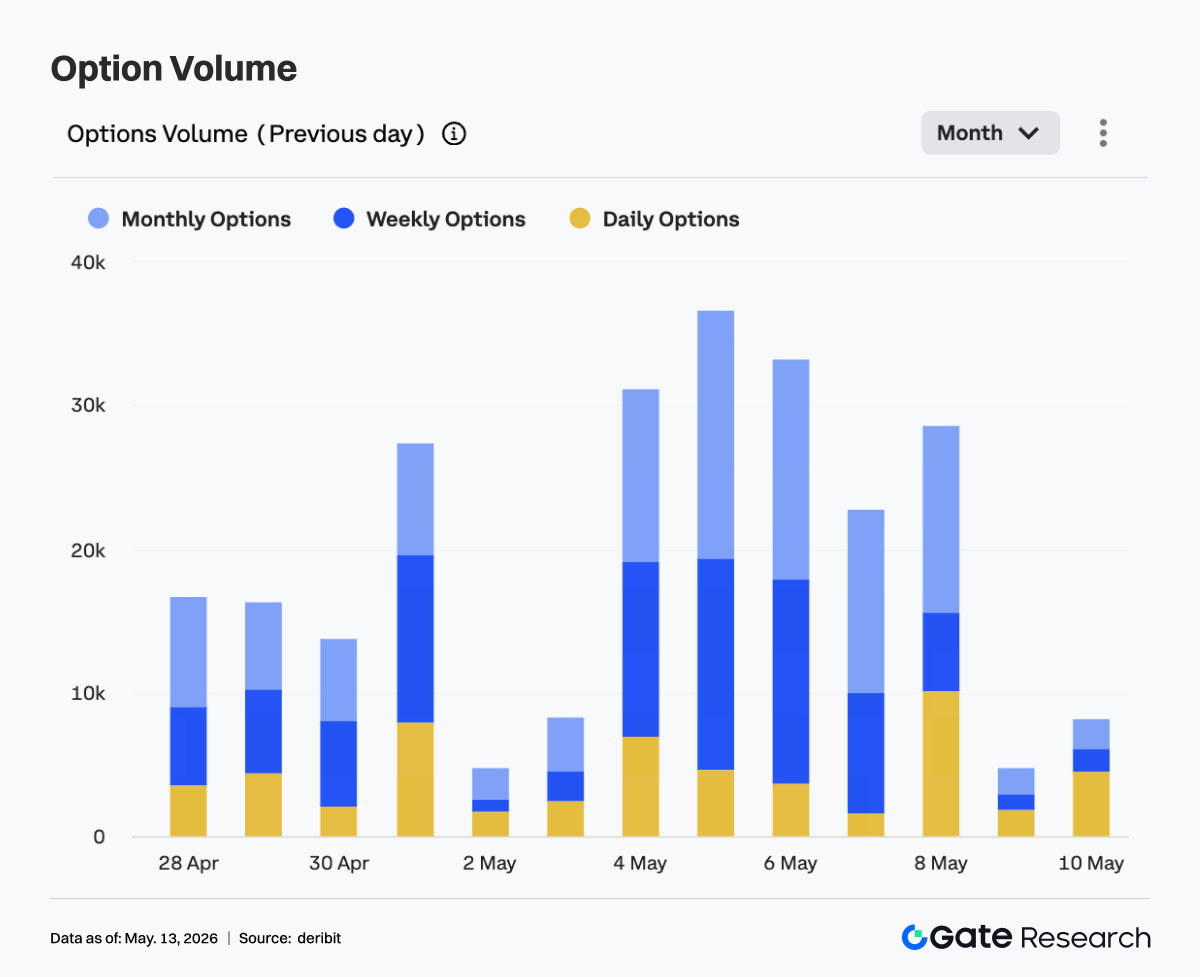
Last week, BTC options trading volume showed a clear pattern of high early and low later. From May 4 to May 6, trading volume remained high for three consecutive days, reaching a weekly peak on May 5, with daily volume close to 36K. On May 6, it still remained around 33K, showing that when price quickly rose to the 81K-82K range, options trading and hedging demand expanded significantly.
Structurally, monthly and weekly options remained the main contributors to trading volume, indicating that market participants still mainly focused on short- to medium-term directional positioning and volatility management. Notably, the share of daily options trading rose clearly on May 8, reflecting stronger short-cycle event trading and near-expiry risk management demand during the high-level price consolidation stage. However, trading volume fell significantly from May 9 to May 10, especially on May 9, when it dropped to the weekly low, indicating that after price temporarily entered high-level consolidation, active trading enthusiasm cooled.
Overall, the options market concentrated its pricing of the price breakout from May 4 to May 6, but trading heat then fell back, showing that the market did not continue to chase higher volatility. The current structure is closer to “post-breakout high-level observation.” If BTC challenges the upper range again, whether options trading volume expands again will be an important signal for judging whether the market has entered a new round of directional pricing.
4.3 Implied Volatility Across Tenors Rose Overall, and the Term Structure Converged
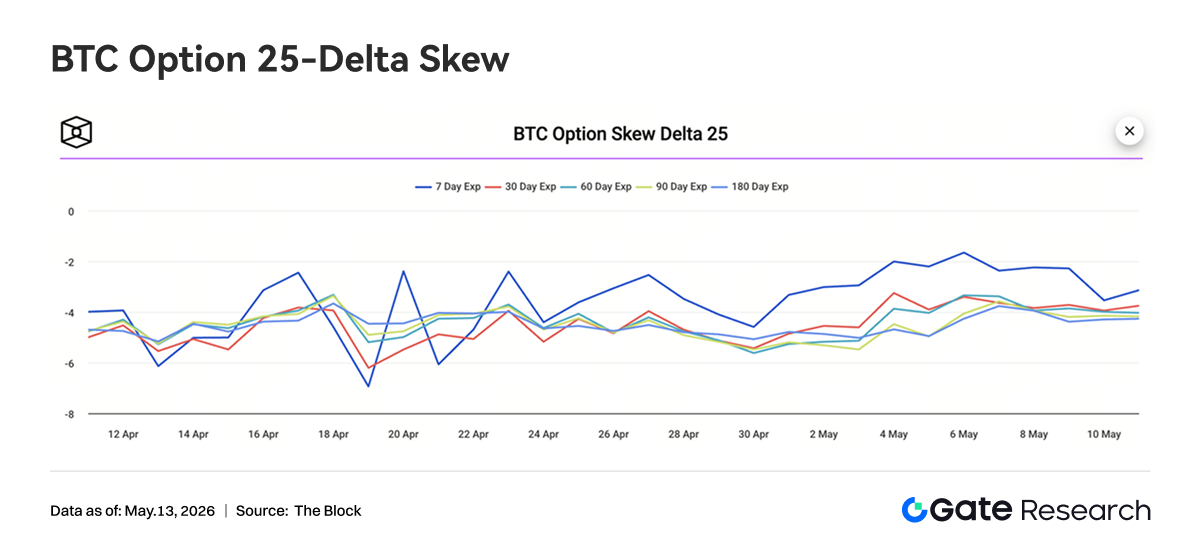
Last week, BTC 25D Skew across tenors remained in negative territory overall, showing that the options market still priced downside protection higher than upside chasing, and risk appetite had not fully shifted to one-sided optimism. At the beginning of the week, 7D Skew once recovered to around -2, clearly higher than other tenors, indicating that during the rapid price rise, the premium for short-term put protection eased, and short-term market panic temporarily cooled.
However, from May 9 to May 10, 7D Skew fell again to around -3.5, gradually converging with medium- and long-term tenors, showing that after price consolidated at high levels, short-term protection demand rose again. 30D, 60D, 90D, and 180D Skew fluctuated relatively little overall, mostly staying in the -3.5 to -4.5 range, indicating that the medium- and long-term market still retained a certain defensive pricing and did not clearly shift to an upside-chasing structure because of the price rise.
Overall, the Skew structure reflects that the market is not pessimistic about BTC’s upward trend, but remains alert to the risk of a high-level pullback. The shift in short-term Skew from recovery to decline means short-term traders increased protection again after the price surged. If price fails to effectively break through the high, protective demand may continue to support put option premiums.
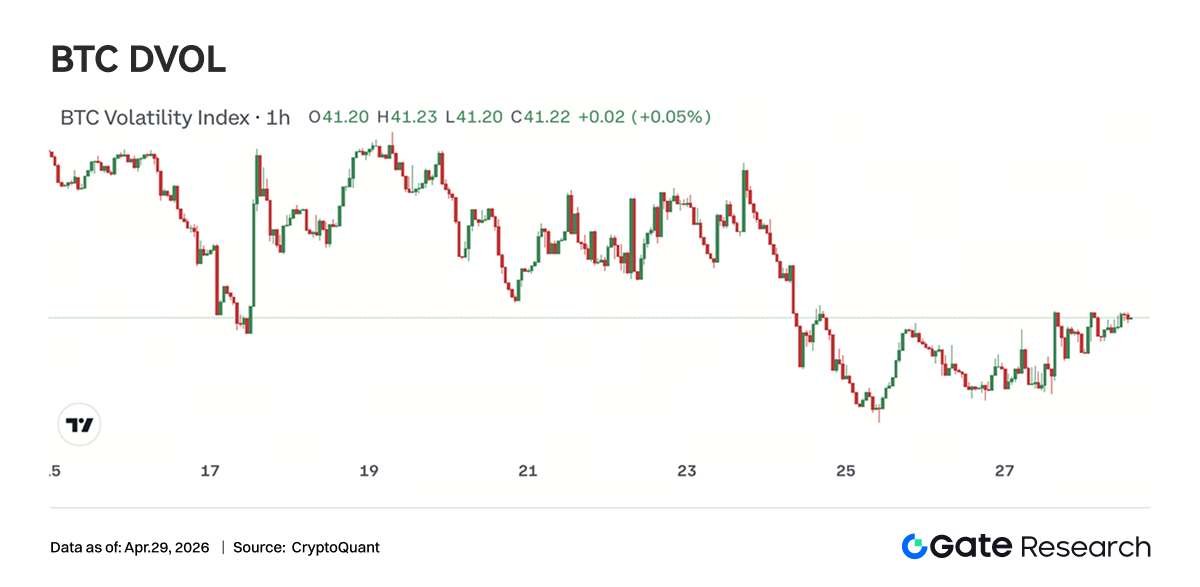
4.4 BTC Volatility Index Stabilized After Volatile Decline, With Short-term Volatility Compressed
Last week, the BTC Volatility Index, BVOL, first rose significantly around May 4 to May 5, once approaching 41, then quickly fell back and dropped to the 37-38 range from May 8 to May 9. On May 10, the volatility index recovered somewhat, but overall it remained around 38.5-39, lower than the early-week high. In terms of rhythm, BVOL’s high basically corresponded to the stage of BTC’s rapid price rise and options volume expansion, showing that the market had briefly raised volatility expectations during the breakout. However, as price entered high-level consolidation, OI fell back, and options trading volume cooled, volatility pricing compressed quickly, showing that the market’s expectation for sharp short-term volatility declined.
Overall, the current state is a combination of “high-level price consolidation + volatility decline and stabilization,” indicating that derivatives pricing for a further one-sided breakout is still insufficient. If BTC continues to consolidate at high levels, BVOL may remain at a low and volatile level; but with funding rates still fluctuating and Skew remaining negative, once price breaks above or below the range again, volatility may be rapidly repriced.
5. Outlook
6. Gate Institutional Updates
-
Trading Volume and Liquidity Performance
-
Overall trading volume maintained a growth trend in the first two weeks of May, with spot volume increasing 14.54% MoM and futures volume increasing 18.10% MoM.
-
Futures trading market share and institutional client structure remained stable overall.
-
Spot depth recovered to near bull-market levels, and trading activity in small-cap coins rebounded significantly; small-cap spot assets continued to outperform the market overall.
-
CrossEx Products and Infrastructure
-
CrossEx reached new highs in trading volume and capital deposits for three consecutive weeks.
-
Demand for cross-exchange arbitrage, hedging, and single-lock strategies continued to grow. CrossEx has entered the stage of connecting to more exchanges and is expected to complete further expansion in Q2.
-
Brand and Ecosystem Building
- Gate Institutional Circle Amsterdam has entered the preparation stage and will continue to strengthen Gate’s brand influence and ecosystem cooperation in the European institutional market.
Sources:
-
Investing, https://investing.com/currencies/xau-usd-historical-data
-
Gate, https://www.gate.com/trade/BTC_USDT
-
CMC, https://coinmarketcap.com/real-world-assets/?type=all-tokens
-
Coinglass, https://www.coinglass.com/pro/depth-delta
-
Dune, https://dune.com/gateresearch/gate-tradfi#weekly-volume
-
Dune, https://dune.com/gateresearch/gate-institutional-weekly-report
-
Bybit, https://www.bybit.com/future-activity/en/tradfi
-
Bitget, https://www.bitgettradfi.com/tradfi/XAUUSD
-
CryptoQuant, https://cryptoquant.com/asset/btc/chart/derivatives
-
Amberdata, https://pro.amberdata.io/options/deribit/btc/current/
Gate Research is a comprehensive blockchain and cryptocurrency research platform that provides deep content for readers, including technical analysis, market insights, industry research, trend forecasting, and macroeconomic policy analysis.
Disclaimer
Investing in cryptocurrency markets involves high risk. Users are advised to conduct their own research and fully understand the nature of the assets and products before making any investment decisions. Gate is not responsible for any losses or damages arising from such decisions.