2026 APP Price Prediction: Expert Analysis and Market Forecast for Next Generation Applications


Introduction: APP's Market Position and Investment Value
APP (APP) serves as an Injective-focused launchpad superapp integrating advanced on-chain trading capabilities. Since its launch in 2024, the project has established itself within the Injective ecosystem by providing retail users access to sophisticated trading tools including on-chain limit orders, presale sniping, and liquidity monitoring features. As of 2026, APP maintains a market capitalization of approximately $312,389, with a circulating supply of about 1.99 billion tokens, and its price stabilizes around $0.0001573. This asset, positioned as a comprehensive trading solution within the Injective network, is playing an increasingly important role in democratizing advanced trading mechanisms for individual investors.
This article will comprehensively analyze APP's price trajectory from 2026 to 2031, combining historical patterns, market supply-demand dynamics, ecosystem development, and macroeconomic environmental factors to provide investors with professional price forecasts and practical investment strategies.
I. APP Price History Review and Market Status
APP Historical Price Evolution Trajectory
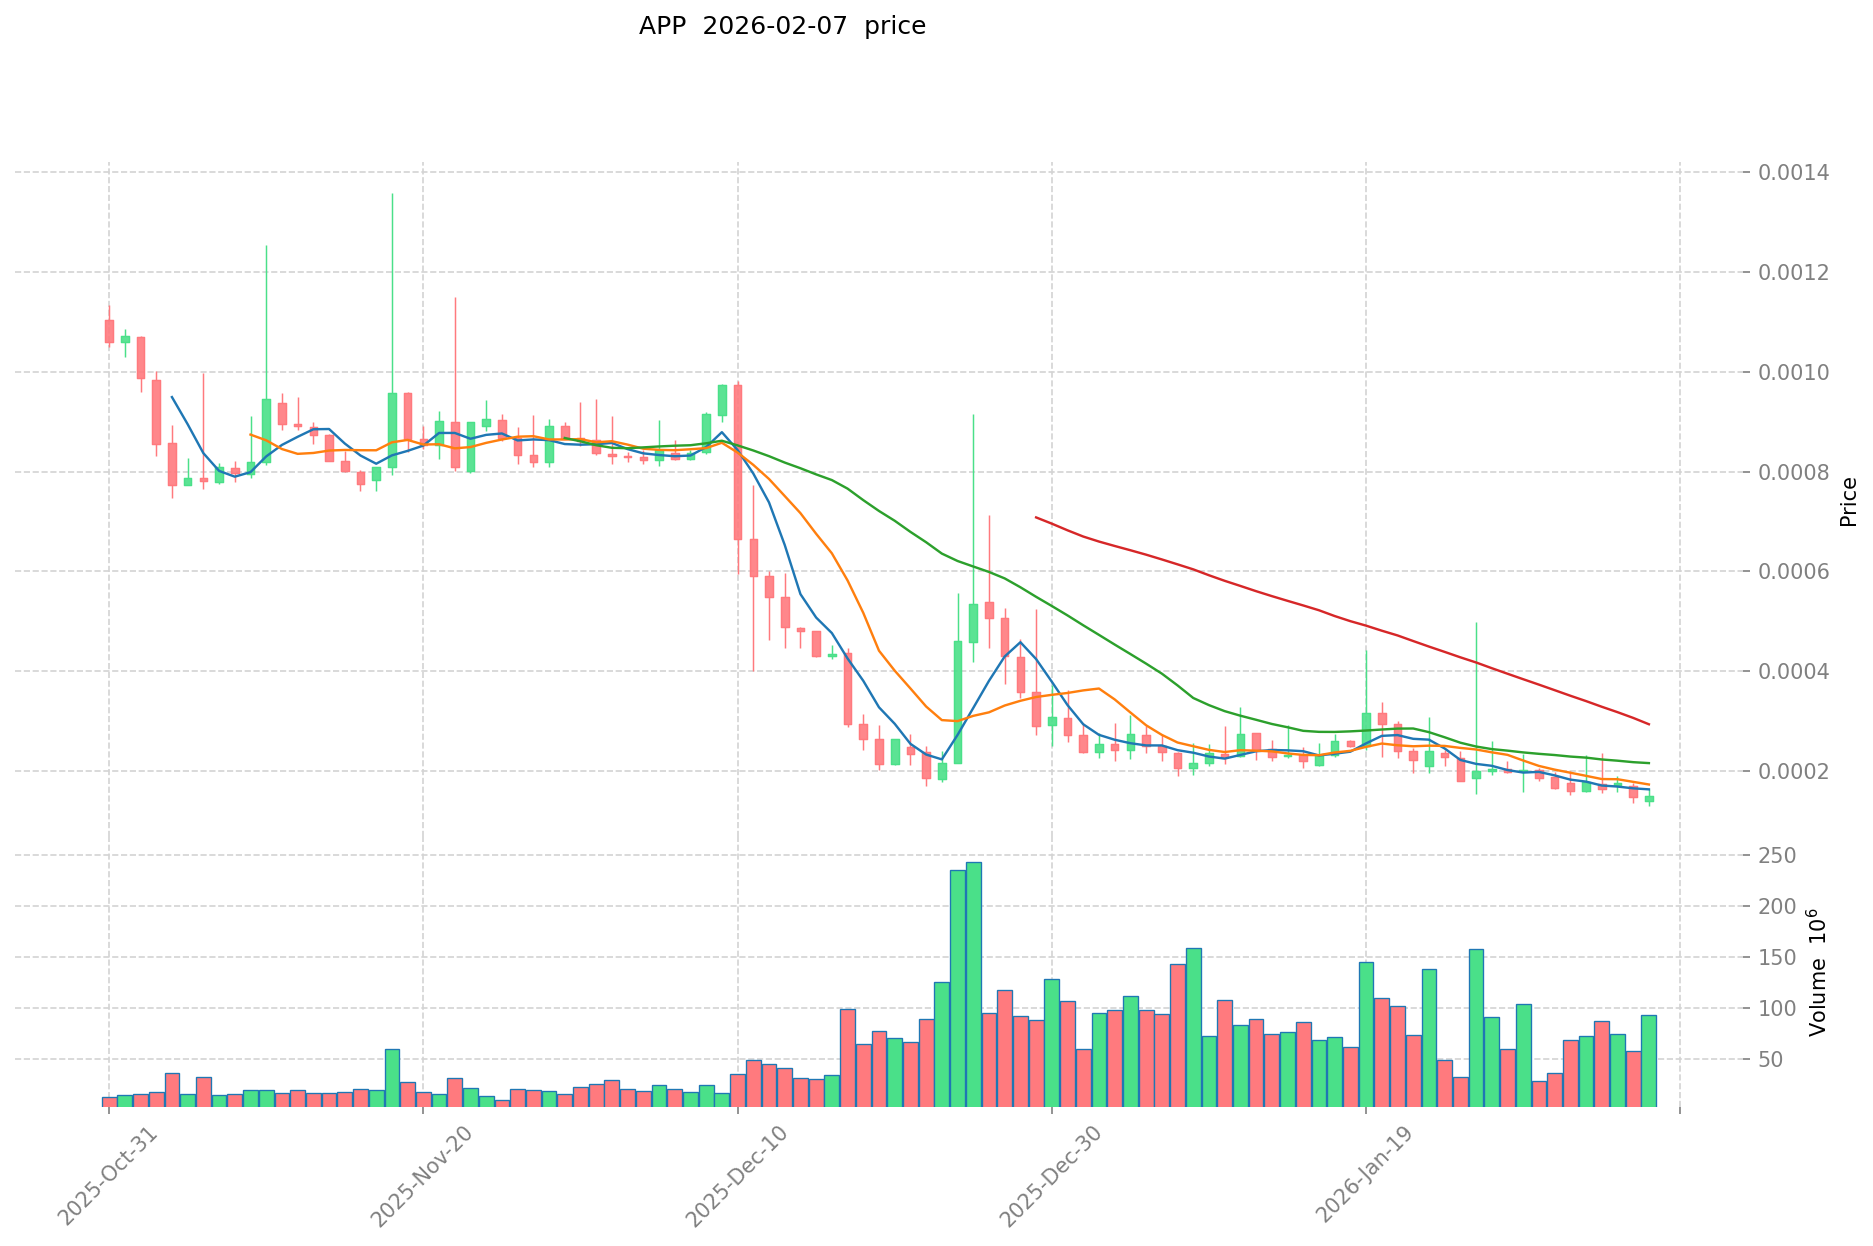
- 2024: The token launched in January 2024 with a publish price of $0.0067, reaching its all-time high of $0.051 on January 16, 2024
- 2024-2025: The price experienced significant decline following the initial peak, reflecting broader market adjustments
- 2026: The token reached its all-time low of $0.0001293 on February 6, 2026, representing a substantial correction from historical highs
APP Current Market Status
As of February 7, 2026, APP is trading at $0.0001573, showing a 24-hour increase of 11.04%. The token has demonstrated notable short-term volatility, with a 1-hour gain of 4.45%, while experiencing a 7-day decline of 17.93% and a 30-day decrease of 23.94%. The year-over-year performance indicates a 95.33% decline.
The current market capitalization stands at $312,389.15, with a 24-hour trading volume of $14,954.47. The circulating supply represents 1,985,944,981.93 APP tokens, accounting for 66.2% of the maximum supply of 3,000,000,000 tokens. The fully diluted market cap is valued at $471,900.00.
The token holder count has reached 1,860 addresses. The 24-hour price range fluctuated between $0.0001293 and $0.000163. The current market dominance stands at 0.000018%, with the market cap to fully diluted valuation ratio at 66.2%.
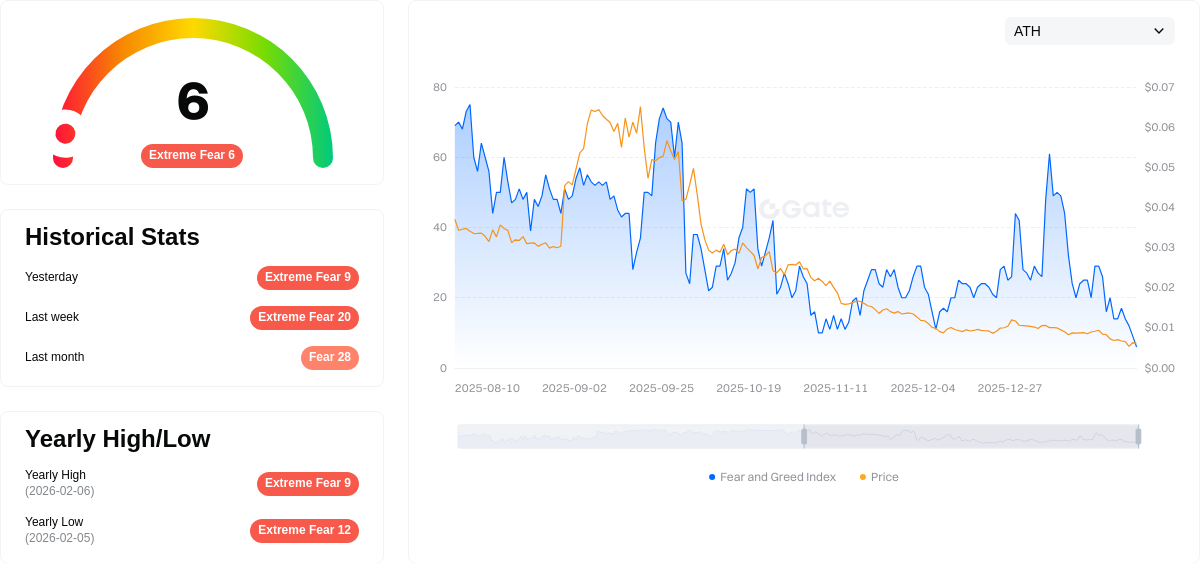
The broader crypto market sentiment index shows a value of 6, indicating conditions of extreme fear, which may be influencing APP's trading patterns alongside other digital assets.
Click to view the current APP market price
APP Market Sentiment Indicator
2026-02-07 Fear and Greed Index: 6 (Extreme Fear)
Click to view current Fear & Greed Index
The crypto market is currently experiencing extreme fear, with the Fear and Greed Index at just 6 points. This exceptionally low reading indicates severe market pessimism and heightened investor anxiety. Such extreme fear conditions often present contrarian opportunities, as markets tend to overreact during panic phases. Experienced traders typically monitor these extreme readings as potential reversal signals. However, caution remains warranted until market sentiment begins stabilizing. Market participants should exercise disciplined risk management and avoid impulsive decisions during this period of heightened uncertainty.
APP Holdings Distribution
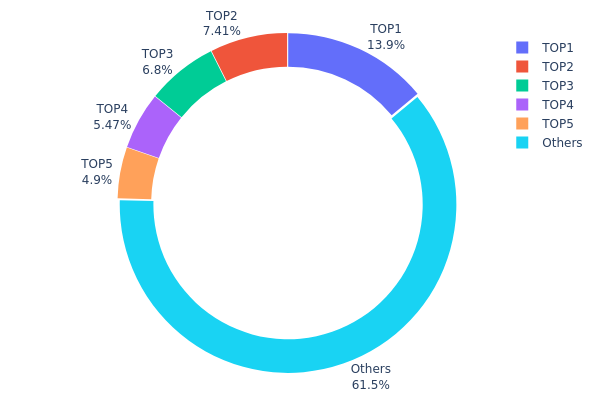
The holdings distribution chart illustrates the allocation of APP tokens across different wallet addresses, providing insights into the decentralization level and concentration risk within the token's ecosystem. This metric serves as a crucial indicator of market structure and potential price manipulation risks.
Based on the current data, APP exhibits a moderate level of concentration in its holdings distribution. The top five addresses collectively control approximately 38.5% of the total supply, with the largest holder possessing 13.94% (418,461.96K tokens). While this concentration is not extreme compared to many emerging crypto projects, it does warrant attention. The second through fifth largest holders maintain relatively balanced positions ranging from 4.89% to 7.41%, suggesting a degree of distribution among major stakeholders rather than dominance by a single entity.
The remaining 61.5% of tokens are distributed among other addresses, indicating a reasonably broad base of holders. This distribution pattern suggests a relatively healthy market structure with moderate decentralization. However, the concentration within the top holder creates potential vulnerability to large-scale sell pressure. Any significant movement from the top addresses could trigger notable price volatility, particularly in low-liquidity market conditions. The current distribution reflects a transitional phase where the token maintains sufficient decentralization to support organic price discovery while remaining susceptible to coordinated actions by major holders.
Click to view the current APP Holdings Distribution
| Top | Address | Holding Qty | Holding (%) |
|---|---|---|---|
| 1 | 0x4a12...00a795 | 418461.96K | 13.94% |
| 2 | 0x0529...c553b7 | 222312.97K | 7.41% |
| 3 | 0x0d07...b492fe | 203989.36K | 6.79% |
| 4 | 0x74de...a2f9a1 | 164168.05K | 5.47% |
| 5 | 0x58ed...a36a51 | 146900.76K | 4.89% |
| - | Others | 1844166.90K | 61.5% |
II. Core Factors Influencing APP's Future Price
Supply Mechanism
- Supply-Demand Imbalance: The cryptocurrency market is experiencing structural tensions in supply-demand dynamics, with industry-wide capacity constraints affecting various sectors from storage chips to power management solutions.
- Historical Patterns: Historical data shows that supply bottlenecks in semiconductor and technology sectors often lead to price appreciation, with previous cycles demonstrating 5-8 year bull market durations.
- Current Impact: The ongoing supply chain restructuring and production cost increases are creating upward pressure on prices across technology-related assets, though specific supply mechanisms for APP remain unclear from available data.
Institutional and Major Holder Dynamics
- Institutional Holdings: The cryptocurrency sector has witnessed increased institutional participation, with entities adjusting portfolios in response to market cycles and regulatory developments.
- Corporate Adoption: Technology companies are navigating complex supply-demand environments, with firms adjusting pricing strategies based on raw material costs, order volumes, and inventory levels.
- National Policies: Regulatory frameworks continue to evolve globally, with policy stability and technological application progress being critical determinants of market direction in the second half of 2026.
Macroeconomic Environment
- Monetary Policy Impact: Federal Reserve policy remains a key variable, with potential signals regarding interest rate paths directly affecting market sentiment. The nomination of hawkish Federal Reserve leadership has created policy transition concerns, with markets responding to potential "rate cuts with balance sheet reduction" scenarios.
- Inflation Hedge Properties: Assets with inflation hedging characteristics have gained attention as debt-to-GDP ratios exceed critical thresholds, prompting investors to seek alternative stores of value amid currency system restructuring.
- Geopolitical Factors: International tensions and trade policy uncertainties are creating complex market conditions, with geopolitical developments influencing risk appetite and capital flows across asset classes.
Technological Development and Ecosystem Building
- Industry Innovation Cycles: The technology sector is experiencing transformation driven by AI demand patterns, creating new paradigms distinct from traditional consumer electronics cycles. This includes structural shifts in semiconductor applications and power management solutions.
- Supply Chain Optimization: Companies are implementing technical adjustments to address cost pressures, including efficiency improvements and material substitution strategies that are reshaping demand structures.
- Ecosystem Applications: The broader technology ecosystem is witnessing accelerated domestic substitution trends, with enterprises ending previous competitive pricing models and beginning to reflect genuine cost and technical value through strategic adjustments.
III. 2026-2031 APP Price Forecast
2026 Outlook
- Conservative prediction: $0.00009 - $0.00016
- Neutral prediction: $0.00016 (average trading level)
- Optimistic prediction: $0.00018 (requires favorable market conditions and increased adoption)
2027-2029 Outlook
- Market stage expectation: Gradual growth phase with moderate volatility, potential ecosystem development driving utility expansion
- Price range predictions:
- 2027: $0.00011 - $0.00023
- 2028: $0.00019 - $0.00024
- 2029: $0.00018 - $0.00028
- Key catalysts: Technology upgrades, partnership announcements, broader crypto market sentiment, and increasing trading volume on platforms like Gate.com
2030-2031 Long-term Outlook
- Baseline scenario: $0.00016 - $0.00036 (assuming steady market growth and maintained project development)
- Optimistic scenario: $0.00022 - $0.00040 (assuming enhanced ecosystem utility and favorable regulatory environment)
- Transformational scenario: Potential to approach $0.00040 range (requires breakthrough adoption, major strategic partnerships, and sustained bull market conditions)
- 2026-02-07: APP currently trading near baseline levels with moderate growth trajectory anticipated over the forecast period
| Year | Predicted High Price | Predicted Average Price | Predicted Low Price | Price Change |
|---|---|---|---|---|
| 2026 | 0.00018 | 0.00016 | 0.00009 | 0 |
| 2027 | 0.00023 | 0.00017 | 0.00011 | 6 |
| 2028 | 0.00024 | 0.0002 | 0.00019 | 27 |
| 2029 | 0.00028 | 0.00022 | 0.00018 | 39 |
| 2030 | 0.00036 | 0.00025 | 0.00016 | 59 |
| 2031 | 0.0004 | 0.00031 | 0.00022 | 95 |
IV. APP Professional Investment Strategy and Risk Management
APP Investment Methodology
(1) Long-term Holding Strategy
- Suitable for: Investors seeking exposure to Injective ecosystem and DeFi trading tools
- Operational Recommendations:
- Consider accumulating positions during market corrections when technical indicators suggest oversold conditions
- Monitor the development progress of Moon App's trading bot features and user adoption metrics
- Utilize Gate Web3 Wallet for secure storage with multi-signature protection
(2) Active Trading Strategy
- Technical Analysis Tools:
- Moving Averages: Monitor 50-day and 200-day moving averages to identify trend direction and potential reversal points
- Volume Analysis: Observe trading volume patterns, noting the current 24-hour volume of approximately $14,954 as a baseline for liquidity assessment
- Swing Trading Key Points:
- Consider the token's recent volatility, with 24-hour price range between $0.0001293 and $0.000163
- Set stop-loss orders to manage downside risk, particularly given the 7-day decline of 17.93%
APP Risk Management Framework
(1) Asset Allocation Principles
- Conservative Investors: 1-2% of crypto portfolio allocation
- Aggressive Investors: 3-5% of crypto portfolio allocation
- Professional Investors: Up to 10% with active hedging strategies
(2) Risk Hedging Solutions
- Portfolio Diversification: Balance APP holdings with established cryptocurrencies and stablecoin reserves
- Position Sizing: Scale entries during different market conditions rather than deploying full capital at once
(3) Secure Storage Solutions
- Hot Wallet Recommendation: Gate Web3 Wallet for active trading needs with convenient access
- Cold Storage Solution: Hardware wallet integration for long-term holdings exceeding short-term trading requirements
- Security Precautions: Enable two-factor authentication, verify contract addresses (0xC5d27F27F08D1FD1E3EbBAa50b3442e6c0D50439 on ETH and BSC), and never share private keys
V. APP Potential Risks and Challenges
APP Market Risks
- High Volatility: The token has experienced a 95.33% decline over the past year, indicating substantial price volatility
- Limited Liquidity: With a market cap of approximately $312,389 and relatively low trading volume, liquidity constraints may impact execution
- Market Sentiment: Current market capitalization represents only 0.000018% of total crypto market, suggesting limited mainstream adoption
APP Regulatory Risks
- DeFi Trading Bot Scrutiny: Automated trading tools may face regulatory examination as authorities develop frameworks for DeFi applications
- Token Classification Uncertainty: Evolving regulatory standards for utility tokens could impact the project's operational framework
- Multi-Jurisdiction Compliance: Operating across different regulatory environments may present compliance challenges
APP Technical Risks
- Smart Contract Vulnerabilities: Trading bot integration and on-chain operations require rigorous security audits to prevent exploits
- Dependency on Injective Ecosystem: Heavy focus on Injective blockchain creates concentration risk tied to that network's performance
- Competition: The trading bot and DeFi tools space has numerous competitors, potentially impacting market share
VI. Conclusion and Action Recommendations
APP Investment Value Assessment
APP represents a specialized investment opportunity within the Injective ecosystem, offering exposure to on-chain trading automation tools. The project's integration of advanced trading bots, including limit orders, presale sniping, and liquidity sniping features, addresses specific needs in the DeFi trading space. However, investors should carefully consider the substantial price decline of 95.33% over the past year and limited market capitalization. The token's long-term value proposition depends on successful user adoption, continuous feature development, and the broader growth of the Injective ecosystem. Short-term risks include continued price volatility, liquidity constraints, and competitive pressures in the trading tools sector.
APP Investment Recommendations
✅ Beginners: Exercise extreme caution; consider waiting for demonstrated project traction and stabilized price action before allocating small amounts (no more than 1% of crypto portfolio) ✅ Experienced Investors: May consider speculative allocation of 2-3% in crypto portfolio, with disciplined entry strategies during technical support levels and strict stop-loss management ✅ Institutional Investors: Conduct thorough due diligence on smart contract security, team credentials, and competitive positioning before any allocation; consider staged entry with performance milestones
APP Trading Participation Methods
- Spot Trading: Purchase APP tokens on Gate.com and other supported exchanges for direct exposure
- Dollar-Cost Averaging: Implement systematic periodic purchases to mitigate timing risk in volatile conditions
- Active Monitoring: Track Moon App's development updates, user growth metrics, and Injective ecosystem developments to inform position adjustments
Cryptocurrency investment carries extremely high risks, and this article does not constitute investment advice. Investors should make prudent decisions based on their own risk tolerance and are advised to consult professional financial advisors. Never invest more than you can afford to lose.
FAQ
What is APP price prediction and what is its main purpose?
APP price prediction is a tool that uses trained neural network models to forecast cryptocurrency prices. Its main purpose is to help investors track market trends and predict price movements based on historical data analysis.
How to use data and algorithms to predict APP price changes?
Use linear regression and machine learning algorithms to analyze transaction volume, market sentiment, and on-chain metrics. These models identify price trends and relationships between key factors to forecast APP price movements.
What are the key factors affecting the accuracy of APP price prediction?
Key factors include market sentiment, trading volume, token supply dynamics, adoption trends, regulatory developments, and macroeconomic conditions. Strong data quality and appropriate model selection also significantly impact prediction accuracy.
What are common APP price prediction tools or platforms?
Popular APP price prediction tools include App Annie, Sensor Tower, and Apptopia. These platforms analyze market trends, trading volume, and historical data to forecast cryptocurrency price movements and market performance.
What is the application value of APP price prediction in marketing and business decision-making?
APP price prediction optimizes pricing strategies, enhances market competitiveness, and enables precise market positioning. It guides inventory management, revenue forecasting, and resource allocation, delivering data-driven insights for strategic business decisions and improved profitability.
What role does historical data play in APP price prediction?
Historical data helps calculate price trends and predict future movements by analyzing past patterns. It provides a probabilistic distribution of potential price movements, enabling data-driven investment decisions based on market behavior analysis.
Share
Content
Introduction: APP's Market Position and Investment Value
I. APP Price History Review and Market Status
II. Core Factors Influencing APP's Future Price
III. 2026-2031 APP Price Forecast
IV. APP Professional Investment Strategy and Risk Management
V. APP Potential Risks and Challenges
VI. Conclusion and Action Recommendations
FAQ
How to Buy Cryptocurrency


Trending Cryptocurrencies


What will be the market capitalization of USDC in 2025? Analysis of the stablecoin market landscape.

How is DeFi different from Bitcoin?

What is DeFi: Understanding Decentralized Finance in 2025

USDC stablecoin 2025 Latest Analysis: Principles, Advantages, and Web3 Eco-Applications

Development of Decentralized Finance Ecosystem in 2025: Integration of Decentralized Finance Applications with Web3

2025 USDT USD Complete Guide: A Must-Read for Newbie Investors

Comprehensive Guide to Bull Flag Trading

Comprehensive Guide to NGMI and WAGMI: Understanding Crypto Community Culture

AI and Machine Learning Trainer

Top 7 Best Stock Investment Apps
Automated Market Maker (AMM) in Cryptocurrency: What Is It?