This comprehensive analysis provides professional price forecasts and investment strategies for APP, the native token of Moon App's Injective-focused launchpad. Currently trading at $0.0001455 with a market cap of $289,000, APP has experienced extreme volatility since its January 2024 launch. The article examines historical price trajectories, supply mechanics, institutional dynamics, and macroeconomic factors influencing APP's future performance. Price predictions range from $0.00008-$0.00021 in 2026, potentially reaching $0.0004 by 2031 under favorable conditions. Key sections cover long-term holding strategies, active trading methodologies, risk management frameworks, and secure storage solutions on Gate. The analysis addresses regulatory risks, technical vulnerabilities, and low liquidity challenges while providing actionable investment recommendations for beginners, experienced traders, and institutional investors based on individual risk tolerance.
Introduction: APP's Market Position and Investment Value
APP, as the native token of Moon App—an Injective-focused launchpad superapp integrating advanced on-chain trading bots, has carved out a specialized niche since its launch in January 2024. As of February 2026, APP maintains a market capitalization of approximately $289,000, with a circulating supply of around 1.99 billion tokens, and its price currently trades at approximately $0.0001455. This asset, designed for retail users seeking streamlined on-chain trading tools, plays an evolving role in the decentralized trading bot ecosystem.
This article will comprehensively analyze APP's price trajectory from 2026 to 2031, combining historical patterns, market supply-demand dynamics, ecosystem developments, and macroeconomic conditions to provide investors with professional price forecasts and practical investment strategies.
I. APP Price History Review and Market Status
APP Historical Price Evolution Trajectory
- 2024: Token launch in January with an initial price of $0.0067, price reached peak at $0.051 on January 16, 2024
- 2024-2025: Market adjustment period, price experienced significant correction from historical high
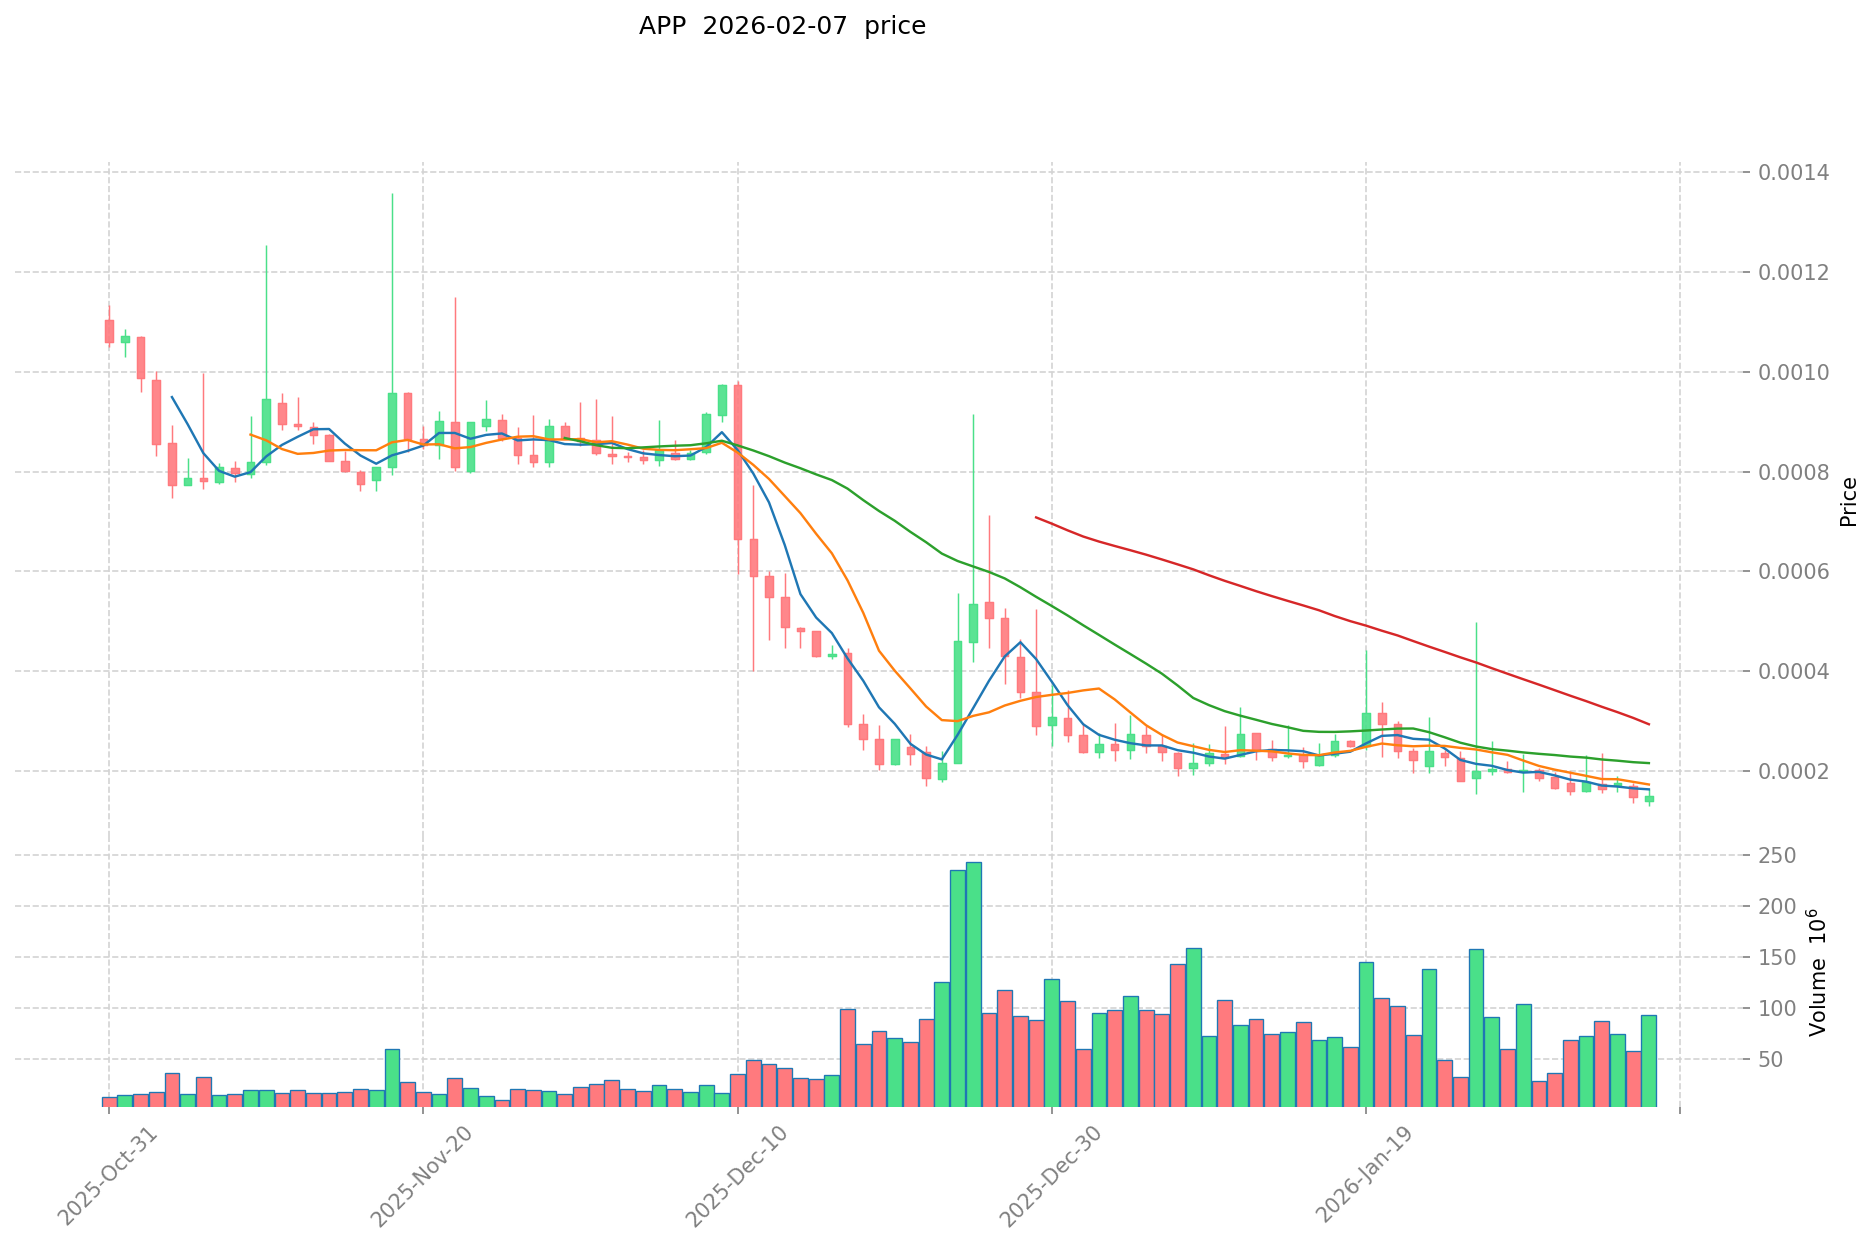
- 2026: Continued downward trend, price declined to $0.0001228 on February 7, 2026, marking the all-time low
APP Current Market Situation
As of February 7, 2026, APP is trading at $0.0001455, showing a recovery of 5.27% over the past 24 hours. The token has experienced mixed short-term performance, with a 5.97% increase in the past hour but a 21.22% decline over the past 7 days. The 30-day performance shows a 32.37% decrease, while the annual performance reflects a substantial 95.7% decline from its price level one year ago.
The current market capitalization stands at approximately $288,955, with a circulating supply of 1.99 billion APP tokens, representing 66.2% of the maximum supply of 3 billion tokens. The fully diluted market cap is calculated at $436,500. The 24-hour trading volume recorded $15,300, indicating relatively limited trading activity. The token holder count has reached 1,860 addresses.
The current price represents a 99.71% decline from the all-time high of $0.051 reached in January 2024, while trading 18.49% above the all-time low recorded earlier today. The 24-hour price range fluctuated between $0.0001228 and $0.000163. APP's market dominance remains minimal at 0.000017% of the total cryptocurrency market.
Click to view current APP market price
APP Market Sentiment Indicator
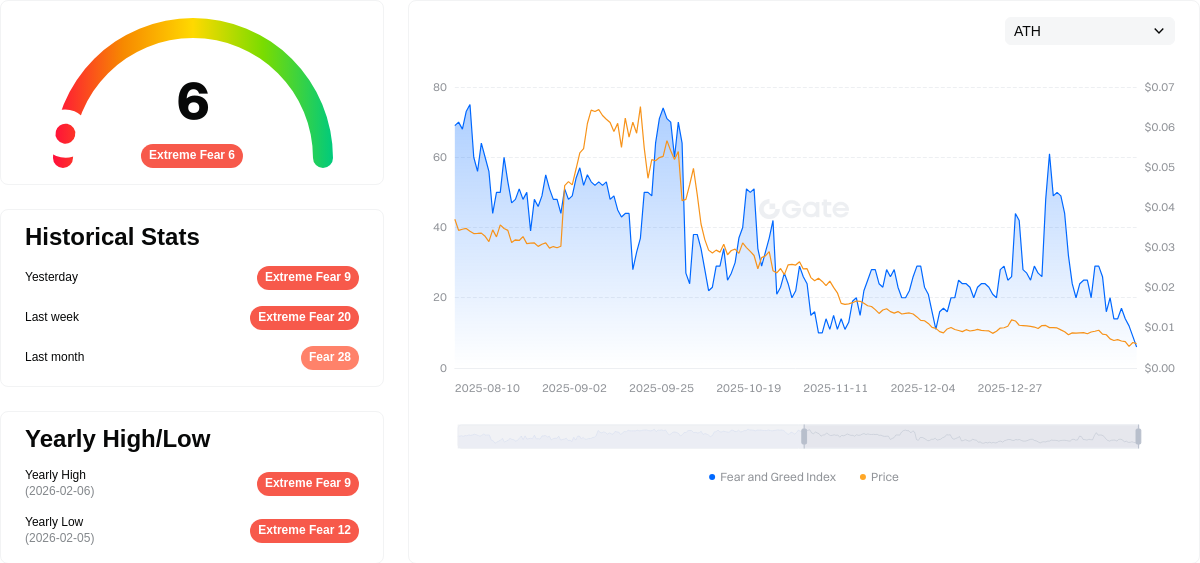
2026-02-07 Fear and Greed Index: 6 (Extreme Fear)
Click to view the current Fear & Greed Index
The cryptocurrency market is currently experiencing extreme fear, with the index at 6. This historically low reading suggests that panic sentiment has peaked among investors. Such extreme fear periods often present contrarian opportunities, as excessive pessimism frequently precedes market reversals. However, traders should exercise caution and conduct thorough analysis before making decisions. Monitor market developments closely on Gate.com to stay informed about potential shifts in market sentiment and capitalize on emerging opportunities during this volatile period.
APP Holding Distribution
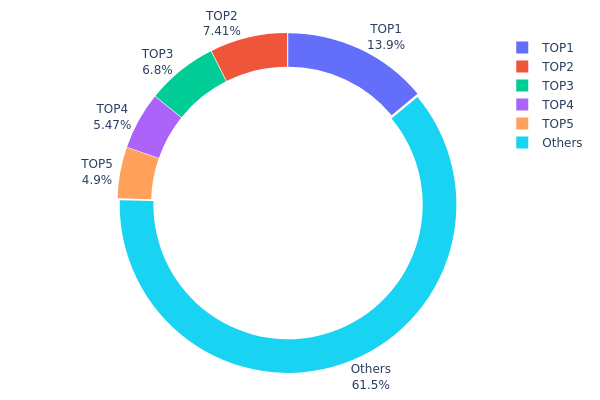
The holding distribution chart illustrates the concentration of APP tokens across different wallet addresses, providing insights into the decentralization level and potential market control by major holders. Based on the current data, the top five addresses collectively hold approximately 38.5% of the total APP supply, with the largest single address (0x4a12...00a795) controlling 13.94% of tokens, equivalent to 418,461.96K APP.
This distribution pattern reveals a moderate concentration level in APP's on-chain structure. While the top holder's 13.94% stake represents significant influence, it falls within a relatively healthy range compared to extremely concentrated projects where single addresses may control over 20-30% of supply. The gradual decline from the first holder (13.94%) to the fifth holder (4.89%) demonstrates a reasonably balanced distribution among major stakeholders. However, the collective 38.5% held by the top five addresses still warrants attention, as coordinated actions among these entities could potentially influence market dynamics.
From a market structure perspective, this concentration level suggests that APP maintains acceptable decentralization while acknowledging the presence of substantial whales. The remaining 61.5% distributed among other addresses indicates broad-based participation, which typically contributes to market stability and reduces the likelihood of single-entity manipulation. Nevertheless, investors should remain aware that significant token movements from any of the top five addresses could trigger notable price volatility, particularly during periods of lower trading volume or market uncertainty.
Click to view current APP Holding Distribution
| Top |
Address |
Holding Qty |
Holding (%) |
| 1 |
0x4a12...00a795 |
418461.96K |
13.94% |
| 2 |
0x0529...c553b7 |
222312.97K |
7.41% |
| 3 |
0x0d07...b492fe |
203989.36K |
6.79% |
| 4 |
0x74de...a2f9a1 |
164168.05K |
5.47% |
| 5 |
0x58ed...a36a51 |
146900.76K |
4.89% |
| - |
Others |
1844166.90K |
61.5% |
II. Core Factors Influencing APP's Future Price
Supply Mechanism
- Market Competition: The future price trend of an app is primarily influenced by the level of competition within its market segment. Apps operating in highly saturated markets may face downward price pressure, while those in niche or emerging categories may maintain stronger pricing power.
- Historical Patterns: High user retention rates and innovative feature sets have historically driven value increases for successful applications. Apps that consistently deliver unique functionality tend to command premium positioning.
- Current Impact: User engagement metrics remain a critical determinant of valuation. Applications demonstrating strong daily active user growth and sustained engagement typically experience positive price momentum.
Institutional and Major Holder Dynamics
- Technological Advancement: The pace of technological innovation significantly impacts app valuations. Applications incorporating cutting-edge technologies such as artificial intelligence, machine learning, or advanced personalization features often attract higher valuations and user willingness to pay.
- Enterprise Adoption: The adoption rate among enterprise users and business clients can substantially influence an app's pricing trajectory, as B2B models often support more stable and predictable revenue streams.
Macroeconomic Environment
- Economic Factors: Broader economic conditions play a role in app pricing dynamics. During economic downturns, consumers may exhibit increased price sensitivity, while growth periods may support premium pricing strategies.
- Regulatory Landscape: Changes in data privacy regulations, app store policies, and industry-specific compliance requirements can impact operational costs and, consequently, pricing strategies.
Technical Development and Ecosystem Building
- Feature Innovation: Continuous development and deployment of new features that address evolving user needs contribute to maintaining competitive positioning and supporting pricing power.
- Platform Integration: The degree of integration with other platforms and services within the broader digital ecosystem influences user stickiness and pricing flexibility.
- User Experience Optimization: Improvements in user interface design, performance optimization, and overall user experience contribute to perceived value and pricing sustainability.
III. 2026-2031 APP Price Prediction
2026 Outlook
- Conservative prediction: $0.00008 - $0.00015
- Neutral prediction: $0.00015 average price level
- Optimistic prediction: up to $0.00021 (requires favorable market conditions and increased adoption)
2027-2029 Outlook
- Market stage expectation: gradual growth phase with moderate volatility and expanding ecosystem development
- Price range predictions:
- 2027: $0.0001 - $0.00019
- 2028: $0.00017 - $0.00021
- 2029: $0.00018 - $0.00025
- Key catalysts: technological upgrades, community engagement expansion, potential partnership developments, and broader market sentiment shifts
2030-2031 Long-term Outlook
- Baseline scenario: $0.00018 - $0.00022 (assuming steady adoption and stable market conditions)
- Optimistic scenario: $0.00022 - $0.00032 (assuming accelerated ecosystem growth and favorable regulatory environment)
- Transformative scenario: $0.00023 - $0.0004 (under exceptionally favorable conditions including major platform integrations and significant utility expansion)
- 2026-02-07: APP is currently in an early growth stage with potential for gradual appreciation
| Year |
Predicted High Price |
Predicted Average Price |
Predicted Low Price |
Price Change |
| 2026 |
0.00021 |
0.00015 |
0.00008 |
1 |
| 2027 |
0.00019 |
0.00018 |
0.0001 |
24 |
| 2028 |
0.00021 |
0.00019 |
0.00017 |
27 |
| 2029 |
0.00025 |
0.0002 |
0.00018 |
37 |
| 2030 |
0.00032 |
0.00022 |
0.00018 |
53 |
| 2031 |
0.0004 |
0.00027 |
0.00023 |
86 |
IV. APP Professional Investment Strategy and Risk Management
APP Investment Methodology
(1) Long-term Holding Strategy
- Target Investors: Retail users and early-stage crypto investors interested in DeFi trading tools and Injective ecosystem growth
- Operational Recommendations:
- Consider dollar-cost averaging over 6-12 months to reduce timing risk given the token's high volatility
- Monitor the development progress of Moon App's trading bot features and Injective ecosystem expansion
- Utilize Gate Web3 Wallet for secure storage with multi-signature protection enabled
(2) Active Trading Strategy
- Technical Analysis Tools:
- Moving Averages: Utilize 20-day and 50-day moving averages to identify short-term trend reversals, particularly important given APP's recent 21.22% decline over 7 days
- Volume Analysis: Monitor 24-hour trading volume fluctuations (currently $15,300) to gauge market participation and potential breakout signals
- Swing Trading Key Points:
- Set stop-loss orders at 8-12% below entry price given the token's high volatility profile
- Consider taking partial profits during short-term rallies, as demonstrated by the 5.27% 24-hour gain
APP Risk Management Framework
(1) Asset Allocation Principles
- Conservative Investors: 0.5-1% of crypto portfolio allocation
- Aggressive Investors: 2-5% of crypto portfolio allocation
- Professional Investors: 5-10% of crypto portfolio allocation with hedging strategies
(2) Risk Hedging Solutions
- Portfolio Diversification: Balance APP holdings with established Layer-1 tokens and stablecoins to reduce concentration risk
- Position Sizing: Limit single-position exposure to no more than stated allocation percentages based on risk tolerance
(3) Secure Storage Solutions
- Hot Wallet Recommendation: Gate Web3 Wallet for active trading with portion of holdings, offering convenient access to trading features
- Cold Storage Solution: Consider hardware wallet storage for long-term holdings exceeding 30% of total APP position
- Security Precautions: Enable two-factor authentication, regularly verify contract addresses (0xC5d27F27F08D1FD1E3EbBAa50b3442e6c0D50439 on ETH and BSC), and avoid sharing private keys or seed phrases
V. APP Potential Risks and Challenges
APP Market Risks
- High Volatility: APP has experienced a 95.7% decline over the past year, indicating substantial price instability and potential for further drawdowns
- Low Liquidity: With 24-hour trading volume of only $15,300 and listing on just 3 exchanges, large trades may experience significant slippage
- Limited Market Adoption: Current market capitalization of approximately $289,000 and 1,860 holders suggest limited widespread adoption
APP Regulatory Risks
- DeFi Bot Classification: Trading bots and automated trading tools may face increasing regulatory scrutiny as authorities develop frameworks for algorithmic trading in crypto markets
- Jurisdictional Uncertainty: Regulatory treatment of MEV-related tools (such as sandwiching bots) remains undefined in many regions
- Compliance Evolution: Changes in securities law interpretation could impact the classification and permissible use of automated trading tools
APP Technical Risks
- Smart Contract Vulnerabilities: As with all DeFi protocols, potential bugs or exploits in smart contracts could compromise user funds or token functionality
- Dependency on Injective Network: APP's functionality is closely tied to the Injective blockchain; any network issues or security incidents could directly impact APP utility
- Competition from Established Platforms: Numerous trading bot solutions exist in the market, creating competitive pressure on Moon App's value proposition
VI. Conclusion and Action Recommendations
APP Investment Value Assessment
APP represents a high-risk, speculative opportunity within the Injective ecosystem trading tools sector. The token's core value proposition centers on providing retail users access to advanced on-chain trading functionalities including limit orders, presale sniping, and liquidity sniping features. However, the 95.7% decline over the past year, extremely low trading volume, and limited holder base indicate significant challenges in market acceptance and liquidity. While short-term price movements show some volatility-driven opportunities (5.27% 24-hour gain), the long-term investment case requires substantial improvement in adoption metrics, trading volume, and ecosystem development. The circulating supply of approximately 66.2% of maximum supply provides moderate supply predictability, but this is offset by the token's micro-cap status and concentration risk.
APP Investment Recommendations
✅ Beginners: Avoid or allocate no more than 0.5% of crypto portfolio; prioritize understanding the technology and market dynamics before investing
✅ Experienced Investors: Consider small speculative positions (1-3% of crypto portfolio) with strict stop-loss discipline and readiness to exit if liquidity deteriorates further
✅ Institutional Investors: Exercise extreme caution due to low liquidity and limited market depth; conduct thorough due diligence on smart contract security and team background before any allocation
APP Trading Participation Methods
- Spot Trading on Gate.com: Purchase APP through the spot market with limit orders to minimize slippage impact given low liquidity conditions
- Dollar-Cost Averaging: Implement systematic purchase plans over extended periods to reduce timing risk and average entry prices
- Active Monitoring: Regularly review Moon App development updates, Injective ecosystem news, and trading volume trends to adjust positions accordingly
Cryptocurrency investment carries extremely high risk, and this article does not constitute investment advice. Investors should make prudent decisions based on their own risk tolerance and are advised to consult professional financial advisors. Never invest more than you can afford to lose.
FAQ
How to predict the future price of APP?
APP price prediction depends on analyzing trading volume trends, market capitalization movements, and technical indicators. Monitor on-chain metrics, adoption rates, and macro sentiment shifts. Strong breakout signals from resistance levels combined with sustained volume increases typically indicate upward momentum potential.
What are the main factors affecting APP price?
APP price is influenced by market demand, trading volume, ecosystem development, community sentiment, tokenomics, technology upgrades, and macroeconomic conditions. Strong adoption and network growth typically drive price appreciation.
Common methods include technical analysis(technical indicators、chart patterns)、fundamental analysis(market trends、trading volume)、and machine learning algorithms. Popular tools encompass TradingView、Bloomberg Terminal、and specialized crypto analytics platforms that analyze market data、on-chain metrics、and historical price movements.
How to predict APP's reasonable price through competitor analysis?
Compare competitor prices and market positioning, analyze trading volume trends and transaction value changes, examine token distribution and utility metrics, then establish price correlations to forecast reasonable valuation levels.
How do market demand and user base affect APP price prediction?
Market demand and user base directly drive APP price predictions. Larger user bases increase trading volume, boosting token value. Higher demand creates scarcity, pushing prices upward. Strong community adoption signals long-term viability, supporting bullish price trends and sustained appreciation potential.
What is the difference in price prediction between in-app purchase and subscription modes?
In-app purchase mode predicts volatile, transaction-based revenue peaks, while subscription mode forecasts stable, recurring income streams. Subscription provides more predictable price trends due to consistent user commitment.
What is the importance of historical data in APP price prediction?
Historical data is fundamental for accurate price prediction. By analyzing past price trends, trading volume, and market patterns, you can identify key support and resistance levels, recognize cyclical behaviors, and forecast future price movements with greater precision.
* The information is not intended to be and does not constitute financial advice or any other recommendation of any sort offered or endorsed by Gate.