This comprehensive analysis examines Blood Crystal (BC), a blockchain gaming token currently trading at $0.000706 with extreme market volatility. The article evaluates BC's historical performance, supply dynamics, and institutional adoption across GameFi sectors through 2031. It provides professional price forecasts ranging from conservative to optimistic scenarios, incorporating technical analysis, market sentiment assessment, and on-chain holding distribution data. The guide offers practical investment methodologies for different investor profiles, risk management frameworks, and secure storage solutions via Gate Web3 Wallet. Addressing market liquidity constraints, regulatory uncertainties, and smart contract vulnerabilities, this analysis equips investors with actionable strategies for navigating BC's early-stage development while emphasizing rigorous due diligence and appropriate portfolio allocation within cryptocurrency markets.
Introduction: BC's Market Position and Investment Value
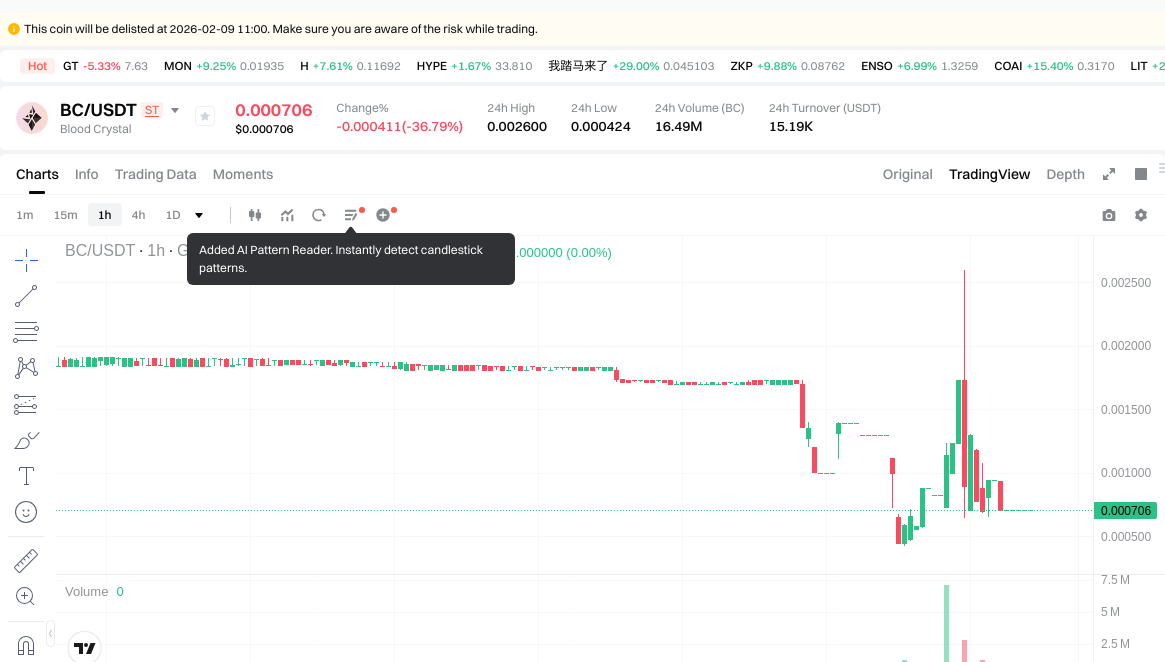
Blood Crystal (BC), as a blockchain gaming asset combining the classic Wizardry franchise with innovative cookie clicker mechanics, has undergone significant market fluctuations since its launch in 2024. As of 2026, BC maintains a market capitalization of approximately $595,894, with a circulating supply of around 844 million tokens, and the price stabilized at $0.000706. This asset, characterized as a "next-generation blockchain gaming token," is playing an increasingly relevant role in the GameFi and blockchain entertainment sectors.
This article will comprehensively analyze BC's price trends from 2026 to 2031, combining historical patterns, market supply and demand dynamics, ecosystem development, and macroeconomic conditions to provide investors with professional price forecasts and practical investment strategies.
I. BC Price History Review and Market Status
BC Historical Price Evolution Trajectory
- 2024: BC experienced significant volatility, reaching a price peak of $0.095102 on December 18, 2024
- 2026: Market entered a downturn phase, with the price declining substantially to a historical low of $0.000424 on February 4, 2026
BC Current Market Situation
As of February 5, 2026, Blood Crystal (BC) is trading at $0.000706, showing a decline of 36.79% over the past 24 hours. The token has experienced notable downward pressure across multiple timeframes, with a 7-day decline of 62.64%, a 30-day decline of 57.59%, and a 1-year decline of 96.46%.
The current market capitalization stands at approximately $595,894.88, with a circulating supply of 844,043,746 BC tokens, representing 84.40% of the total supply. The 24-hour trading volume reached $15,196.74. The token's market dominance is 0.000023%, reflecting its position as an emerging project in the cryptocurrency ecosystem.
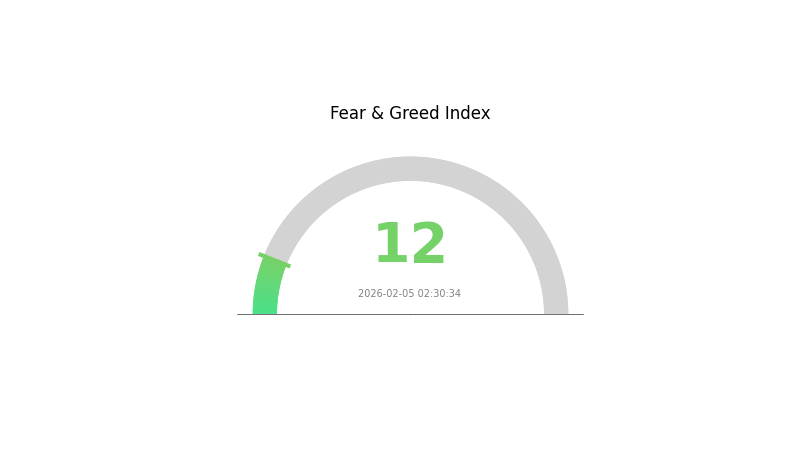
The market is currently experiencing extreme fear sentiment, with a VIX index reading of 12. BC's fully diluted market cap aligns closely with its current market cap at 84.4%, indicating a relatively high proportion of tokens already in circulation. The token has approximately 190 holders and operates on the Ethereum blockchain using the ERC-20 standard.
Click to view current BC market price
BC Market Sentiment Index
2026-02-05 Fear and Greed Index: 12 (Extreme Fear)
Click to view current Fear & Greed Index
The crypto market is currently experiencing extreme fear, with the Fear and Greed Index plummeting to 12. This exceptionally low reading signals intense market pessimism and investor anxiety. During such phases, selling pressure typically dominates as traders rush to reduce exposure. However, history suggests that extreme fear often precedes market reversals, presenting potential opportunities for contrarian investors. It is advisable to monitor market fundamentals closely and consider position sizing carefully during this volatile period.
BC Holding Distribution
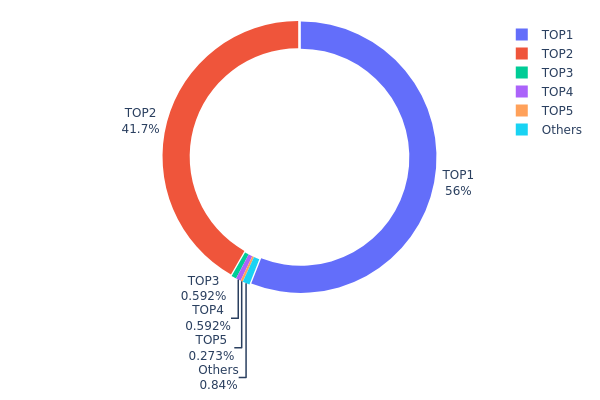
The holding distribution chart illustrates the allocation of BC tokens across different wallet addresses, revealing the degree of centralization in token ownership. According to the latest on-chain data, the top 5 addresses collectively hold approximately 98.14% of the total BC supply, indicating an extremely high concentration level. Specifically, the largest address (0x40ec...5bbbdf) holds 472,292.03K tokens, accounting for 55.95% of the total supply, while the second-largest address (0x0000...00dead) controls 352,354.37K tokens, representing 41.74%. These two addresses alone command nearly 97.69% of the entire circulating supply.
This extreme concentration presents significant implications for market dynamics. The dominance of a single address holding over half the supply creates substantial centralization risk, potentially enabling price manipulation and reducing market liquidity. The second-largest address, identified by the "dead" suffix typically associated with burn addresses, suggests that a considerable portion of tokens has been permanently removed from circulation. While token burns can theoretically increase scarcity value, the overwhelming concentration in the top address raises concerns about governance centralization and potential liquidity shocks should large-scale selling occur.
From a market structure perspective, the current distribution reflects limited decentralization, with minimal dispersion among retail holders—the "Others" category accounts for merely 0.86% of total supply. This concentration pattern may deter institutional participation due to elevated manipulation risks and could result in amplified price volatility during significant market movements. The holding structure suggests that BC's on-chain ecosystem remains in an early developmental stage, requiring further distribution optimization to enhance market stability and foster sustainable long-term growth.
Click to view current BC Holding Distribution
| Top |
Address |
Holding Qty |
Holding (%) |
| 1 |
0x40ec...5bbbdf |
472292.03K |
55.95% |
| 2 |
0x0000...00dead |
352354.37K |
41.74% |
| 3 |
0xa60d...5ae096 |
5000.00K |
0.59% |
| 4 |
0x568f...7b56f0 |
5000.00K |
0.59% |
| 5 |
0x8ded...16e375 |
2307.22K |
0.27% |
| - |
Others |
7090.12K |
0.86% |
II. Core Factors Influencing BC's Future Price
Supply Mechanism
- Industrial Scale Expansion: As production capacity continues to increase and equipment manufacturing capabilities improve, the unit investment cost per capacity is expected to decline further. This expansion in industrial scale represents a fundamental shift in the supply dynamics of BC technology.
- Historical Pattern: Previous periods of capacity expansion in the photovoltaic industry have typically led to cost reductions and improved market competitiveness. The maturation of production processes has historically supported price stabilization.
- Current Impact: The ongoing scaling of BC cell production facilities, combined with technological advancements, is anticipated to reduce manufacturing costs. However, yield rates remain a critical factor affecting overall production economics.
Institutional and Major Player Dynamics
- Production Capacity Distribution: Major manufacturers are accelerating their layout in BC cell production lines, with leading companies investing in advanced equipment to improve yield rates and reduce costs.
- Technology Adoption: The industry is witnessing growing interest from established photovoltaic companies seeking to diversify their product portfolios with BC technology, driven by its potential for higher efficiency and premium pricing.
- Policy Support: Government initiatives promoting renewable energy development and carbon reduction targets continue to provide a favorable policy environment for advanced photovoltaic technologies, including BC cells.
Macroeconomic Environment
- Energy Transition Momentum: The global shift toward sustainable energy sources creates sustained demand for high-efficiency photovoltaic solutions. BC technology benefits from this broader trend as markets seek advanced alternatives.
- Supply Chain Stability: The stability of upstream materials, particularly specialized components required for BC cell production, influences cost structures and production scalability.
- Market Competition: Intensifying competition in the photovoltaic sector puts pressure on pricing while simultaneously driving innovation and efficiency improvements.
Technology Development and Ecosystem Building
- Yield Rate Optimization: Yield levels represent a crucial factor affecting BC cell costs. Ongoing improvements in production processes and quality control systems are targeting higher yield rates, which directly impact economic viability.
- Equipment Investment Efficiency: Advancements in manufacturing equipment are expected to reduce the initial capital requirements for BC cell production, making the technology more accessible to a broader range of manufacturers.
- Process Innovation: The industry is addressing challenges related to the lengthy production workflow through process optimization and automation, aiming to enhance competitiveness against alternative cell technologies.
III. 2026-2031 BC Price Forecast
2026 Outlook
- Conservative forecast: $0.00047 - $0.00071
- Neutral forecast: Around $0.00071
- Optimistic forecast: Up to $0.00074 (requires favorable market conditions)
Based on current market analysis, BC is expected to maintain relatively stable price levels throughout 2026, with projected average trading around $0.00071. The price range suggests moderate volatility, with potential fluctuations between the lower bound of $0.00047 and an upper limit of $0.00074.
2027-2029 Mid-term Outlook
- Market stage expectation: Gradual recovery and accumulation phase
- Price range forecast:
- 2027: $0.00062 - $0.00093 (potential 2% year-over-year change)
- 2028: $0.00044 - $0.00118 (potential 17% year-over-year change)
- 2029: $0.00089 - $0.00122 (potential 42% year-over-year change)
- Key catalysts: Progressive adoption rates, enhanced ecosystem development, and broader market sentiment recovery
The mid-term projection indicates a potential upward trajectory, with 2028 and 2029 showing more pronounced growth potential. The widening price ranges reflect increased market dynamics and possible catalysts that could drive value appreciation.
2030-2031 Long-term Outlook
- Baseline scenario: $0.00099 - $0.00165 (assuming steady ecosystem growth and sustained market interest)
- Optimistic scenario: $0.00138 - $0.00200 (contingent on accelerated adoption and favorable regulatory environment)
- Transformative scenario: Potential to reach upper bounds if breakthrough developments occur in utility expansion and strategic partnerships
Long-term forecasts suggest BC could experience substantial growth, with 2030 projections indicating a potential 57% increase and 2031 showing possibilities of up to 95% growth compared to baseline periods. These projections assume continued project development, increased utility, and positive market conditions. Investors should note that cryptocurrency markets remain highly volatile, and actual performance may vary significantly from these projections based on numerous external factors including regulatory changes, technological developments, and overall market sentiment.
| Year |
Predicted High Price |
Predicted Average Price |
Predicted Low Price |
Price Change |
| 2026 |
0.00074 |
0.00071 |
0.00047 |
0 |
| 2027 |
0.00093 |
0.00072 |
0.00062 |
2 |
| 2028 |
0.00118 |
0.00083 |
0.00044 |
17 |
| 2029 |
0.00122 |
0.001 |
0.00089 |
42 |
| 2030 |
0.00165 |
0.00111 |
0.00099 |
57 |
| 2031 |
0.002 |
0.00138 |
0.00073 |
95 |
IV. BC Professional Investment Strategy and Risk Management
BC Investment Methodology
(1) Long-Term Holding Strategy
- Target Investors: Investors with strong risk tolerance and belief in blockchain gaming development
- Operational Recommendations:
- Consider accumulating positions during significant market corrections
- Monitor project development progress and ecosystem expansion
- Storage Solution: Gate Web3 Wallet offers convenient storage and management options
(2) Active Trading Strategy
- Technical Analysis Tools:
- Volume Analysis: Monitor 24-hour trading volume (current volume: $15,196.74) to identify potential trend reversals
- Support and Resistance Levels: Track key price levels, with recent low at $0.000424 and 24H high at $0.0026
- Swing Trading Points:
- Given high volatility (24H change: -36.79%), set strict stop-loss levels
- Consider position sizing based on market sentiment and volume patterns
BC Risk Management Framework
(1) Asset Allocation Principles
- Conservative Investors: 1-2% of crypto portfolio
- Aggressive Investors: 3-5% of crypto portfolio
- Professional Investors: Up to 8% with active monitoring
(2) Risk Hedging Solutions
- Portfolio Diversification: Maintain exposure across multiple blockchain gaming projects
- Position Scaling: Implement dollar-cost averaging to reduce timing risk
(3) Secure Storage Solutions
- Web3 Wallet Recommendation: Gate Web3 Wallet provides secure ERC-20 token storage with user-friendly interface
- Cold Storage Option: For long-term holdings, consider offline storage solutions
- Security Precautions: Never share private keys, enable two-factor authentication, and verify contract addresses (0x4b6d036d0bc62a633acca6d10956e9dbbb16748f)
V. BC Potential Risks and Challenges
BC Market Risks
- Extreme Volatility: Recent 7-day decline of -62.64% demonstrates significant price instability
- Limited Liquidity: With only 2 exchange listings and $15,196.74 daily volume, liquidity constraints may impact execution
- Market Cap Position: Ranking #2899 with market cap of $595,894.88 indicates early-stage project status
BC Regulatory Risks
- Blockchain Gaming Compliance: Evolving regulatory frameworks for blockchain-based games may impact project operations
- Token Classification: Uncertainty around regulatory treatment of gaming utility tokens across jurisdictions
- Cross-Border Operations: Multi-jurisdictional regulatory requirements may pose operational challenges
BC Technical Risks
- Smart Contract Security: As an ERC-20 token, vulnerabilities in smart contract code could pose risks
- Platform Dependencies: Project relies on Ethereum network performance and security
- Gaming Mechanics Evolution: Transition from RPG to cookie clicker format may affect user retention and token utility
VI. Conclusion and Action Recommendations
BC Investment Value Assessment
Blood Crystal (BC) represents a high-risk, early-stage blockchain gaming project attempting to merge classic RPG elements with modern blockchain mechanics. While the project shows innovation in combining Wizardry IP with blockchain technology, current market performance indicates significant volatility and limited market adoption. The token has declined -96.46% from its launch price of $0.025 to current levels around $0.000706. With 190 holders and limited exchange presence, the project faces considerable challenges in liquidity and market penetration. Long-term value proposition depends heavily on successful execution of gaming mechanics and ecosystem expansion.
BC Investment Recommendations
✅ Beginners: Avoid or allocate minimal speculative capital (under 1% of crypto portfolio) only after thorough research
✅ Experienced Investors: Consider small position sizing with clear risk parameters and stop-loss levels, monitoring project development milestones
✅ Institutional Investors: Exercise extreme caution; conduct comprehensive due diligence on team, technology, and market positioning before any allocation
BC Trading Participation Methods
- Spot Trading: Available on Gate.com with BC/USDT trading pairs
- Dollar-Cost Averaging: Implement systematic purchase strategy to mitigate volatility impact
- Portfolio Integration: Consider as part of broader blockchain gaming sector exposure with appropriate diversification
Cryptocurrency investment carries extremely high risks, and this article does not constitute investment advice. Investors should make prudent decisions based on their own risk tolerance and are advised to consult professional financial advisors. Never invest more than you can afford to lose.
FAQ
What are the main methods for BC price prediction?
BC price prediction primarily uses qualitative analysis and quantitative analysis methods. Quantitative methods include causal regression analysis and time series analysis, which analyze historical transaction volume, market trends, and on-chain data to forecast price movements.
How is technical analysis applied in BC price prediction?
Technical analysis uses historical price and trading volume patterns to forecast BC price movements. Traders identify support and resistance levels to determine potential price directions and entry/exit points for informed decision-making.
What are the main factors affecting BC price fluctuations?
BC price is primarily influenced by market sentiment, regulatory policies, trading volume, technological developments, and global economic conditions. Investor psychology and adoption trends also play significant roles in price movements.
How to assess the accuracy and risk of BC price predictions?
Compare actual market performance against forecasts, analyze prediction methodology rigorously, and evaluate model limitations. Consider historical accuracy rates, transaction volume trends, and inherent volatility. Assess data quality and timeframe reliability to determine prediction credibility.
What is the relationship between BC price prediction and market sentiment?
BC price prediction closely correlates with market sentiment. High BC ratios reflect extreme market emotions and trading volume imbalances, indicating bullish or bearish conditions. Strong sentiment typically drives price movements, making sentiment analysis a key factor in BC price forecasting and trend prediction.
How do professional institutions conduct BC price predictions?
Professional institutions analyze market trends, trading volume, and historical data using technical analysis. They evaluate consensus ratings, market sentiment, and economic factors to forecast BC price movements and user target prices.
* The information is not intended to be and does not constitute financial advice or any other recommendation of any sort offered or endorsed by Gate.