This comprehensive analysis examines Blocery (BLY) token's market position and price trends from 2026 through 2031. Currently trading at $0.001625 with a $1.62 million market cap, BLY operates as a blockchain-based agricultural supply chain platform. The article evaluates historical price movements, analyzes core factors influencing valuation including market demand, project development, technology innovation, and regulatory landscape, and provides detailed price forecasts across three scenarios. It outlines professional investment strategies spanning long-term holding and active trading approaches, supplemented by comprehensive risk management frameworks. Key risks including high volatility, low liquidity, and market competition are thoroughly examined. Investors can trade BLY spot on Gate and manage assets through Gate Web3 Wallet, with recommendations varying by experience level from conservative allocation strategies to professional due diligence protocols.
Introduction: BLY's Market Position and Investment Value
Blockery (BLY), as a blockchain-based agricultural food supply chain platform, has been building its ecosystem to enhance transparency and trust in food production and distribution since its inception. As of 2026, BLY maintains a market capitalization of approximately $1.62 million, with a circulating supply of around 1 billion tokens, and the price remains at approximately $0.001625. This asset, designed to facilitate agricultural product supply chain efficiency, is playing an increasingly important role in connecting producers and consumers through decentralized services.
This article will comprehensively analyze BLY's price trends from 2026 to 2031, combining historical patterns, market supply and demand dynamics, ecosystem development, and macroeconomic conditions to provide investors with professional price forecasts and practical investment strategies.
I. BLY Price Historical Review and Current Market Status
BLY Historical Price Evolution Trajectory
- 2020: Token reached its lowest point during initial market phase, with price touching $0.0010071 in November
- 2021: Project experienced significant growth momentum, with price climbing to $0.724004 in April, representing a notable expansion phase
- 2022-2025: Market entered consolidation period, with price experiencing gradual decline alongside broader market conditions
- 2025-2026: Price continued adjustment phase, declining from approximately $0.006445 to current levels
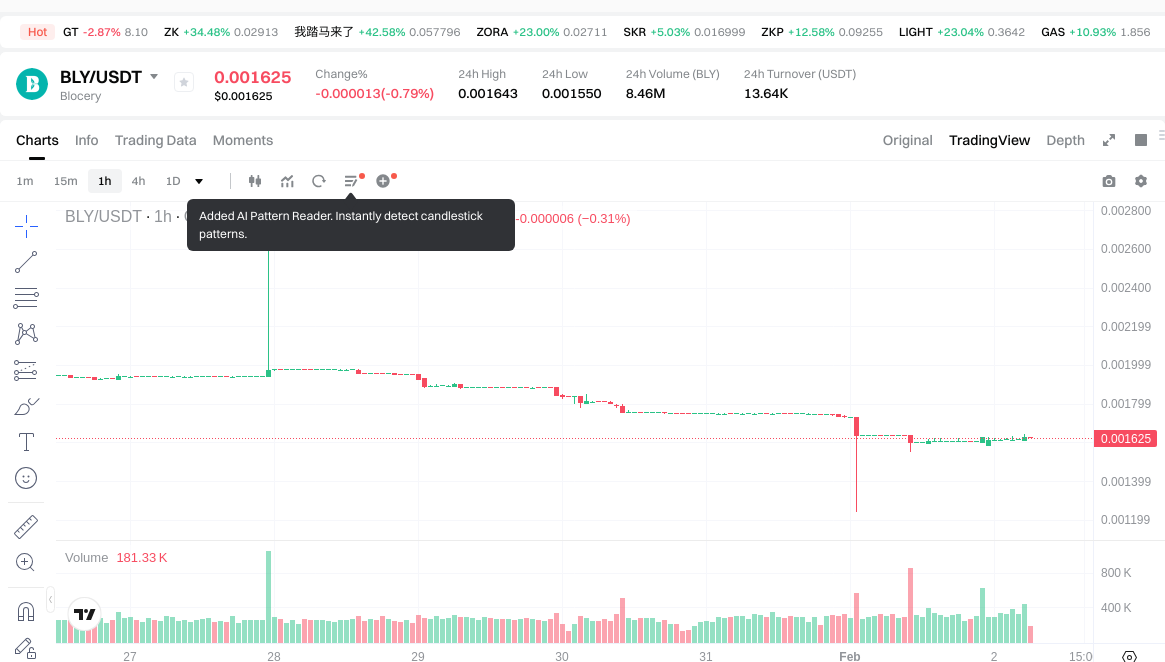
BLY Current Market Situation
As of February 2, 2026, BLY is trading at $0.001625, showing mixed short-term performance. The token has exhibited a slight increase of 0.80% over the past hour, while experiencing a modest decline of 0.79% in the 24-hour timeframe. Over the past week, the token has decreased by 16.24%, with a 30-day decline of 14.92%. The one-year performance shows a decrease of 74.79%.
The token's 24-hour trading range has been between $0.00155 and $0.001643, with total trading volume reaching $13,572.23. BLY maintains a market capitalization of approximately $1.62 million, with a circulating supply of nearly 1 billion tokens, representing 99.99% of the maximum supply of 1 billion tokens. The fully diluted market cap matches the current market capitalization at $1.62 million.
The token is currently ranked #2,173 in the cryptocurrency market, with a market dominance of 0.000059%. BLY is available on 3 exchanges and has approximately 1,642 token holders. The current market sentiment indicator shows a value of 1, while the broader crypto market fear and greed index stands at 14, indicating extreme fear conditions.
Click to view current BLY market price
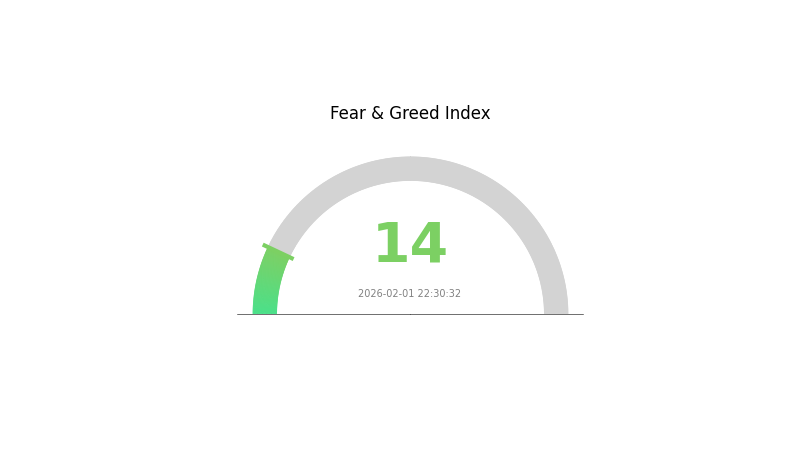
BLY Market Sentiment Indicator
2026-02-01 Fear and Greed Index: 14 (Extreme Fear)
Click to view current Fear & Greed Index
The cryptocurrency market is currently experiencing extreme fear, with the index reaching 14. This represents a significant downturn in investor sentiment, reflecting heightened anxiety and risk aversion across the sector. When the fear index hits such low levels, it often signals capitulation among retail investors and presents potential buying opportunities for contrarian traders. Historical patterns suggest that extreme fear periods typically precede market reversals. However, investors should remain cautious and conduct thorough due diligence before making investment decisions during such volatile market conditions.
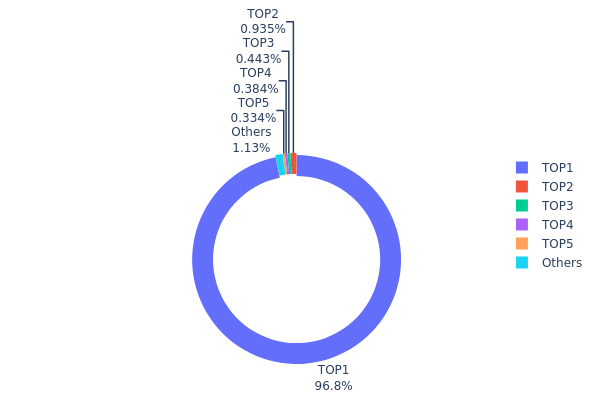
BLY Holdings Distribution
The holdings distribution chart illustrates the concentration of token ownership across different wallet addresses, serving as a critical indicator of decentralization and potential market manipulation risks. By examining the percentage of total supply held by top addresses versus smaller holders, analysts can assess whether a token's governance and price discovery mechanisms are genuinely distributed or controlled by a small cohort of major stakeholders.
Current data reveals an exceptionally high concentration pattern in BLY's holdings structure. The top address alone controls 967,692.21K tokens, representing 96.76% of the total supply—an extraordinarily centralized distribution that raises significant concerns. The second-largest holder possesses only 9,353.35K tokens (0.93%), while the remaining top five addresses collectively account for less than 2% of the supply. This extreme imbalance indicates that BLY's market structure is dominated by a single entity, creating substantial centralization risks that deviate significantly from ideal decentralized token economics.
Such concentrated holdings introduce multiple structural vulnerabilities to BLY's market dynamics. The dominant address possesses sufficient supply to exert unilateral influence over price movements, liquidity depth, and trading sentiment. Any significant transfer or sell-off from this address could trigger severe price volatility or liquidity crises. Furthermore, this concentration pattern suggests limited distribution among retail participants and institutional investors, potentially constraining organic market development and reducing resilience against manipulation. The minimal holdings among "Others" (1.16%) indicate weak community participation and insufficient token circulation across the broader ecosystem.
Click to view current BLY Holdings Distribution
| Top |
Address |
Holding Qty |
Holding (%) |
| 1 |
0x6eb8...9629b8 |
967692.21K |
96.76% |
| 2 |
0x0d07...b492fe |
9353.35K |
0.93% |
| 3 |
0xe303...ad2087 |
4430.63K |
0.44% |
| 4 |
0x9642...2f5d4e |
3835.28K |
0.38% |
| 5 |
0x5066...6bb3d1 |
3340.90K |
0.33% |
| - |
Others |
11347.64K |
1.16% |
II. Core Factors Influencing BLY's Future Price
Market Demand and Sentiment
- Investor Confidence: Market sentiment and investor confidence directly impact BLY's price trajectory. Positive news regarding widespread adoption or technological breakthroughs tends to drive upward momentum.
- Adoption Trends: Growing market demand and increased project adoption serve as fundamental drivers for potential price appreciation.
- Historical Context: Price movements historically correlate with shifts in market perception and confidence levels within the cryptocurrency ecosystem.
Project Development Progress
- Development Milestones: The pace and quality of project development significantly influence BLY's valuation. Successful implementation of roadmap objectives typically generates positive market response.
- Strategic Partnerships: Collaborations and partnerships established by the Blocery project can enhance credibility and expand use cases.
- Current Trajectory: Ongoing development efforts and their execution quality remain critical factors in shaping investor expectations.
Technological Innovation
- Technical Breakthroughs: Major technological advancements within the Blocery ecosystem could serve as catalysts for price movement.
- Network Difficulty Adjustments: Changes in network difficulty and mining dynamics may influence supply-side economics and price discovery mechanisms.
- Infrastructure Development: Improvements in underlying technology and infrastructure contribute to long-term value propositions.
Regulatory Landscape
- Policy Framework: Regulatory developments and policy changes in key jurisdictions play pivotal roles in shaping market conditions for BLY.
- Compliance Positioning: The project's ability to navigate evolving regulatory requirements affects its accessibility and adoption potential.
- Institutional Acceptance: Regulatory clarity can facilitate institutional participation and broader market acceptance.
Macroeconomic Conditions
- Economic Indicators: Broader economic trends, including growth forecasts and central bank policies, influence cryptocurrency market sentiment.
- Market Psychology: Retail investor behavior and rotation patterns within cryptocurrency sectors create secondary effects on individual asset prices.
- Risk Appetite: Global risk sentiment and capital flow dynamics impact speculative assets like BLY.
III. 2026-2031 BLY Price Forecast
2026 Outlook
- Conservative forecast: $0.00132 - $0.00163
- Neutral forecast: $0.00163 (average market conditions)
- Optimistic forecast: $0.00208 (requires favorable market sentiment and increased trading volume)
2027-2029 Outlook
- Market stage expectation: Gradual growth phase with potential for steady appreciation as the project develops its ecosystem and user base
- Price range forecast:
- 2027: $0.00176 - $0.00235 (approximately 14% increase from 2026)
- 2028: $0.00156 - $0.00292 (approximately 29% increase from 2026)
- 2029: $0.00148 - $0.00344 (approximately 54% increase from 2026)
- Key catalysts: Enhanced platform adoption, potential partnerships, and broader cryptocurrency market recovery could drive price appreciation during this period
2030-2031 Long-term Outlook
- Base scenario: $0.00244 - $0.00444 (assuming steady market development and maintained project momentum)
- Optimistic scenario: $0.00298 - $0.00541 (assuming strong ecosystem growth and favorable regulatory environment)
- Transformational scenario: Potential to reach upper ranges if BLY achieves significant market penetration and establishes strategic industry partnerships
- 2026-02-02: BLY trading within initial forecast range, with baseline projections suggesting gradual appreciation trajectory through 2031
| Year |
Predicted High Price |
Predicted Average Price |
Predicted Low Price |
Price Change |
| 2026 |
0.00208 |
0.00163 |
0.00132 |
0 |
| 2027 |
0.00235 |
0.00185 |
0.00176 |
14 |
| 2028 |
0.00292 |
0.0021 |
0.00156 |
29 |
| 2029 |
0.00344 |
0.00251 |
0.00148 |
54 |
| 2030 |
0.00444 |
0.00298 |
0.00244 |
83 |
| 2031 |
0.00541 |
0.00371 |
0.00256 |
128 |
IV. BLY Professional Investment Strategies and Risk Management
BLY Investment Methodology
(I) Long-term Holding Strategy
- Target Investors: Blockchain agriculture ecosystem believers and cryptocurrency technology enthusiasts
- Operational Recommendations:
- Adopt a phased accumulation approach, avoiding concentrated purchases at market highs
- Monitor developments in Blocery's agricultural supply chain platform and ecosystem expansion
- Storage Solution: Use Gate Web3 Wallet for secure asset storage, enabling regular backup of private keys and mnemonic phrases
(II) Active Trading Strategy
- Technical Analysis Tools:
- Support and Resistance Levels: Observe whether BLY can hold support at $0.00155 (24H low) and faces resistance near $0.00164 (24H high)
- Volume Analysis: Current 24H trading volume of approximately $13,572 reflects relatively low market liquidity, requiring caution with position sizing
- Swing Trading Key Points:
- Given BLY's recent 7-day decline of 16.24% and 30-day decline of 14.92%, wait for clear reversal signals before entering positions
- Set reasonable stop-loss levels to control single-trade risk within 5-10%
BLY Risk Management Framework
(I) Asset Allocation Principles
- Conservative Investors: 1-2% allocation
- Aggressive Investors: 3-5% allocation
- Professional Investors: May consider 5-8% allocation based on research depth
(II) Risk Hedging Solutions
- Portfolio Diversification: Avoid concentrating investments solely in agricultural blockchain projects; diversify across different sectors
- Liquidity Reserve: Maintain sufficient stablecoin reserves to respond to market volatility
(III) Secure Storage Solutions
- Hot Wallet Recommendation: Gate Web3 Wallet for convenient trading and management
- Cold Storage Solution: For long-term holding, consider transferring assets to hardware wallets for enhanced security
- Security Precautions: Never share private keys or mnemonic phrases; be vigilant against phishing websites and fraudulent messages
V. BLY Potential Risks and Challenges
BLY Market Risks
- High Volatility Risk: BLY has declined 74.79% over the past year, indicating significant price fluctuation potential
- Low Liquidity Risk: Daily trading volume of approximately $13,572 may result in substantial slippage for large transactions
- Market Capitalization Risk: With a market cap of approximately $1.62 million and ranking around 2173, the project faces considerable market competition pressure
BLY Regulatory Risks
- Agricultural Supply Chain Regulation: Changes in regulatory policies for blockchain applications in agriculture across different countries may impact project development
- Cryptocurrency Compliance: Tightening global cryptocurrency regulations may affect BLY's liquidity and trading venues
- Data Privacy Regulations: Recording agricultural product information on-chain must comply with various regional data protection regulations
BLY Technical Risks
- Smart Contract Security: As an ERC-20 token deployed on Ethereum, it faces potential smart contract vulnerability risks
- Blockchain Network Dependency: Project operations depend on Ethereum network stability; network congestion may affect user experience
- Ecosystem Development Risk: The project's long-term value depends on the maturity of its agricultural supply chain ecosystem, with technical implementation facing uncertainties
VI. Conclusion and Action Recommendations
BLY Investment Value Assessment
Blocery (BLY) attempts to build a transparent and efficient agricultural supply chain ecosystem through blockchain technology, with innovative concepts offering long-term development potential. However, the project currently faces challenges including significant price decline (74.79% annual decline), low market liquidity, and intensifying market competition. Investors should closely monitor ecosystem development progress, user adoption rates, and the actual implementation of agricultural supply chain applications. Short-term market volatility risks remain high, requiring cautious investment decisions.
BLY Investment Recommendations
✅ Beginners: Not recommended as a primary investment target; if interested in the agricultural blockchain sector, limit allocation to no more than 1-2% of total portfolio and focus on learning project fundamentals
✅ Experienced Investors: May consider small position allocation (3-5%), emphasizing technical analysis combined with project progress tracking, setting strict stop-loss levels
✅ Institutional Investors: Conduct comprehensive due diligence on team background, technical architecture, and business model; consider strategic investment only after confirming project sustainability
BLY Trading Participation Methods
- Spot Trading: Trade BLY spot on Gate.com to participate in price fluctuations of the agricultural blockchain ecosystem
- Secure Storage: Use Gate Web3 Wallet for asset management, ensuring private key security
- Information Tracking: Follow Blocery's official Twitter (@blocery) and GitHub updates to stay informed about the latest project developments
Cryptocurrency investments carry extremely high risks, and this article does not constitute investment advice. Investors should make prudent decisions based on their own risk tolerance and are advised to consult professional financial advisors. Never invest more than you can afford to lose.
FAQ
How to predict the future price trend of BLY token?
BLY price predictions depend on market demand, adoption trends, and broader economic factors. Historical analysis and trading volume metrics suggest potential annual growth around 5%, though precise forecasting requires professional analysis of on-chain data and market sentiment.
What are the main factors affecting BLY price?
BLY price is primarily influenced by market sentiment, trading volume, and supply-demand dynamics. Investor confidence, market trends, and industry news also play significant roles in determining price movements.
What are the risks and uncertainties in BLY price predictions?
BLY price predictions face market volatility, regulatory changes, and technological uncertainties. Crypto markets are inherently unpredictable, influenced by sentiment shifts, trading volume fluctuations, and macroeconomic factors that can rapidly alter asset valuations.
How to analyze BLY historical price data to assist with prediction?
Analyze BLY's open, high, low prices and trading volume to identify trends. Use technical analysis tools to spot patterns in historical data. Recognize support and resistance levels to forecast future price movements and market behavior.
BLY demonstrates relatively higher volatility compared to similar assets, driven significantly by market demand and technological innovation. Its price performance is directly influenced by industry trends and policy changes, showing responsive market dynamics.
* The information is not intended to be and does not constitute financial advice or any other recommendation of any sort offered or endorsed by Gate.