This comprehensive guide analyzes BUCK (GME Mascot), GameStop's official mascot token on Solana blockchain, delivering expert price analysis and investment strategies through 2031. As of February 2026, BUCK trades at $0.0006029 with $602,896 market cap across 11,307 holders. The article examines BUCK's historical volatility, from $0.05859 peak to current levels, while evaluating supply-demand dynamics, macroeconomic influences, and competitive positioning. Price projections range from $0.00039-$0.00065 in 2026 to $0.00061-$0.00107 by 2031, indicating potential 69% cumulative appreciation. The guide offers tailored strategies for conservative, active, and professional traders, emphasizing risk management and portfolio allocation. Available on Gate.com, BUCK presents high-risk opportunities requiring strict position sizing (0.5-5% allocation), diversification, and secure Web3 Wallet storage. Investors must understand extreme volatility risks and regulatory uncertainties before participation.
Introduction: BUCK's Market Position and Investment Value
GME Mascot (BUCK), as GameStop's official mascot token, has been navigating the crypto market since its launch in November 2024. As of February 2026, BUCK maintains a market capitalization of approximately $602,896, with a circulating supply of 999,993,000 tokens and a current price around $0.0006029. This meme token, running on the Solana blockchain, represents a unique intersection of traditional gaming retail culture and decentralized finance.
This article will comprehensively analyze BUCK's price trajectory from 2026 to 2031, combining historical patterns, market supply-demand dynamics, ecosystem developments, and macroeconomic conditions to provide professional price forecasts and practical investment strategies for investors.
I. BUCK Price History Review and Market Status
BUCK Historical Price Evolution Trajectory
- 2024: Token launched in November with initial trading activity, price experienced significant volatility from launch
- 2024: Price reached peak level at $0.05859 on November 21, representing the strongest market performance since inception
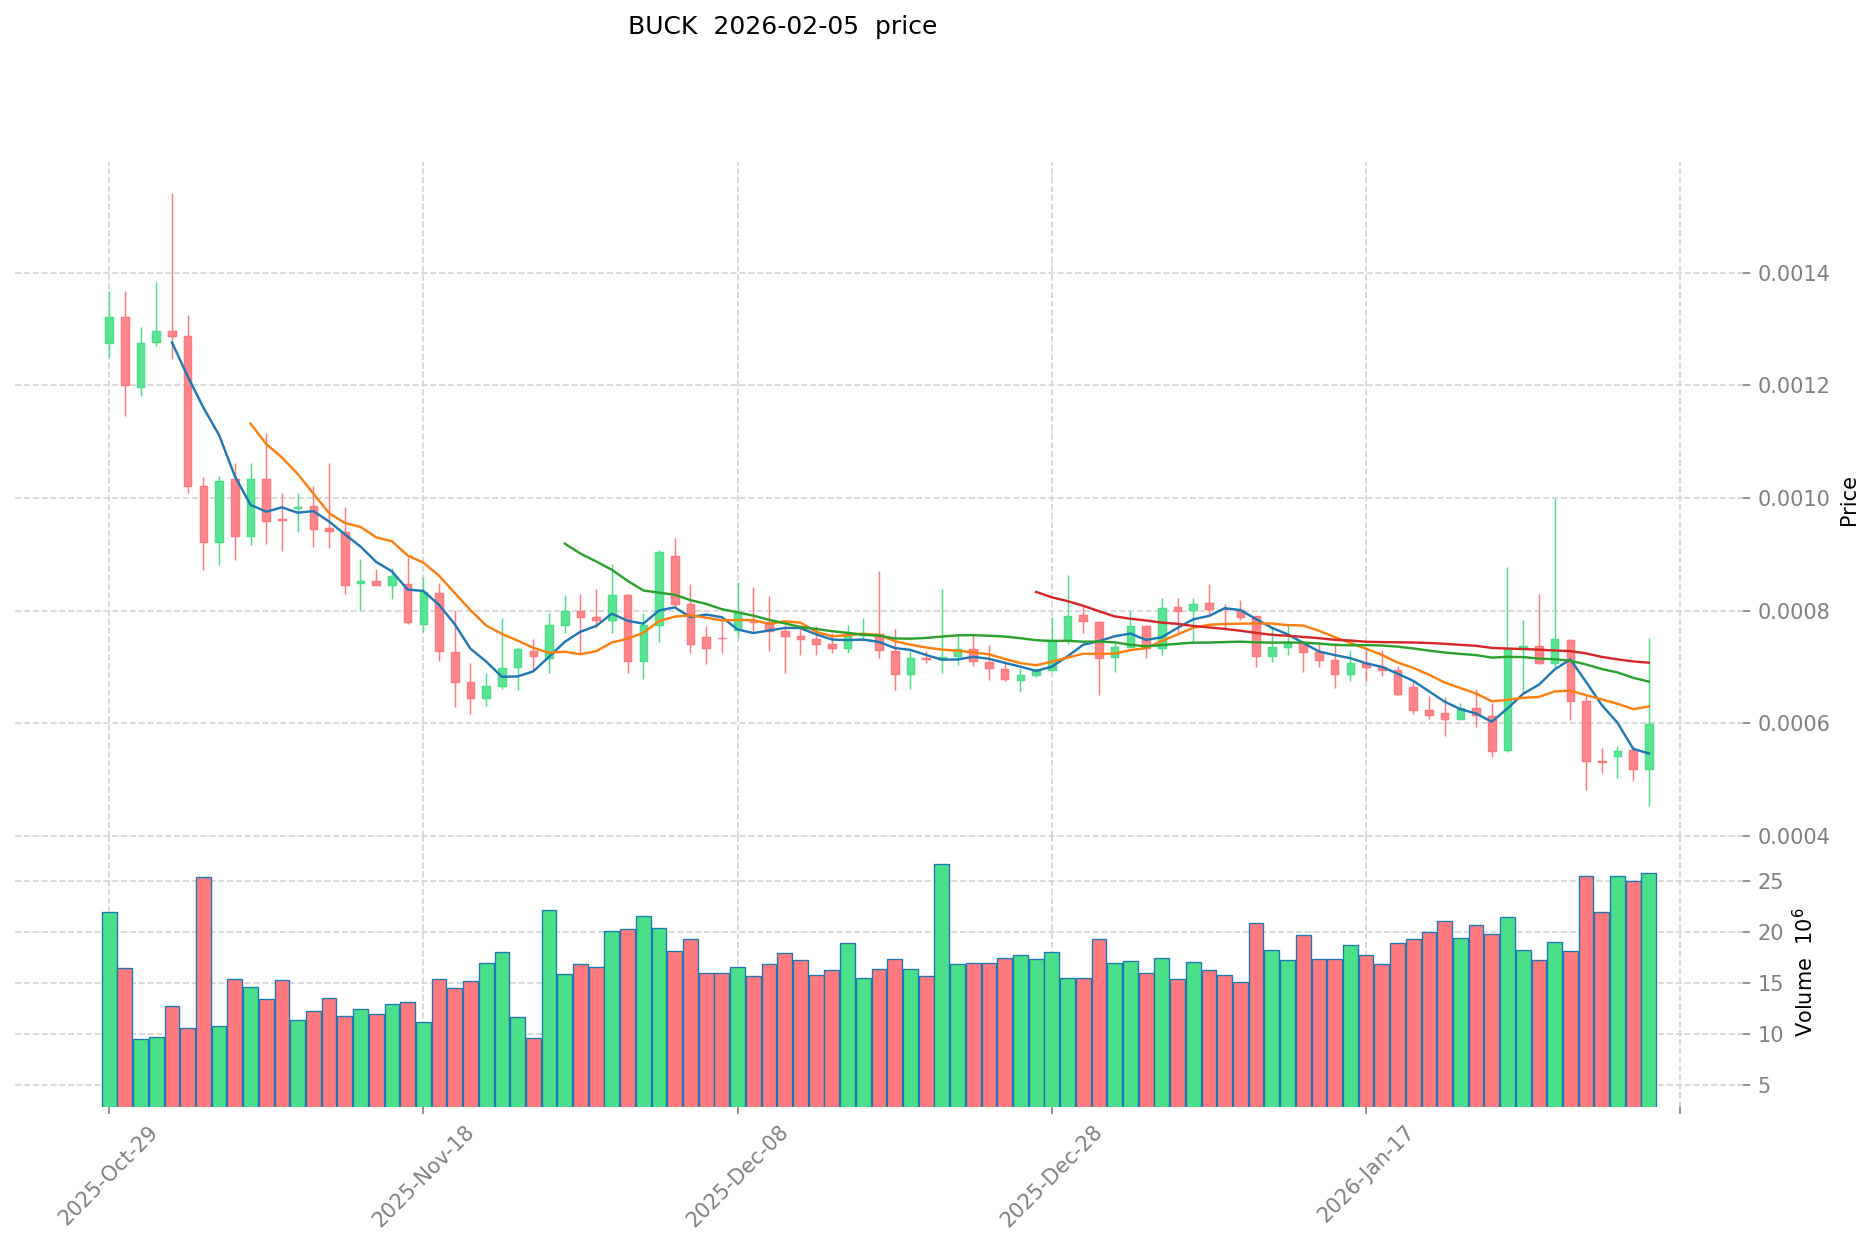
- 2026: Market entered correction phase, price declined to lowest recorded level of $0.0004522 on February 4
BUCK Current Market Dynamics
As of February 5, 2026, BUCK is trading at $0.0006029, showing an increase of 9.64% over the past 24 hours. The token has experienced notable price movements across different timeframes, with a decline of 24.39% in the past hour and a decrease of 19.78% over the past week. The 30-day performance shows a reduction of 29.2%.
The token maintains a market capitalization of approximately $602,895.78, with a fully diluted valuation matching this figure, indicating that 100% of the total supply of 999,993,000 tokens is currently in circulation. The 24-hour trading volume stands at $12,976.03. BUCK's market dominance is 0.000023%, with a holder base of 11,307 addresses.
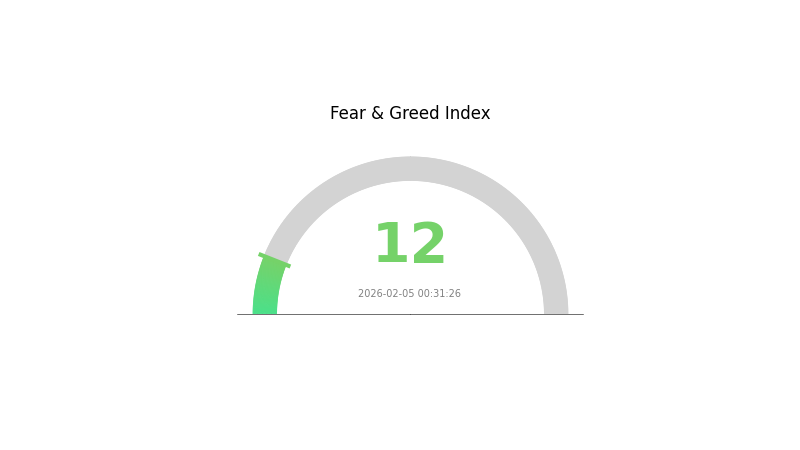
The Fear and Greed Index for the broader cryptocurrency market currently registers at 12, indicating an "Extreme Fear" sentiment among market participants. BUCK is deployed on the Solana blockchain with the contract address FLqmVrv6cp7icjobpRMQJMEyjF3kF84QmC4HXpySpump and is available for trading on Gate.com.
Click to view current BUCK market price
BUCK Market Sentiment Indicator
2026-02-05 Fear and Greed Index: 12 (Extreme Fear)
Click to view the current Fear & Greed Index
The cryptocurrency market is experiencing extreme fear, with the Fear and Greed Index dropping to 12. This indicates significant market pessimism and panic selling pressure among investors. When sentiment reaches such lows, it often signals potential oversold conditions. Market participants should exercise caution and avoid impulsive decisions driven by fear. This environment may present opportunities for long-term investors, though short-term volatility remains high. Stay informed and manage risk appropriately during periods of extreme market sentiment.
BUCK Holding Distribution
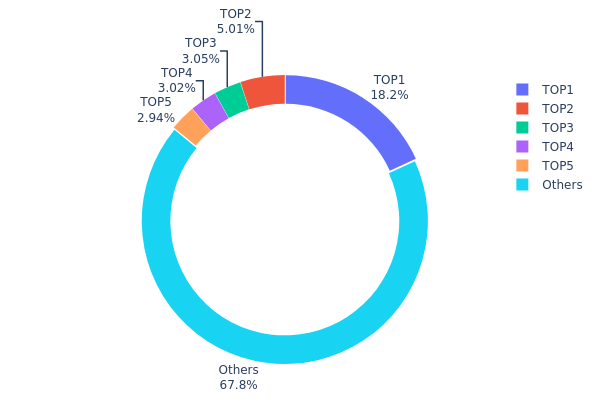
The holding distribution chart reveals the concentration of token ownership across different addresses on the blockchain, serving as a critical indicator of decentralization and market structure. By examining how tokens are distributed among top holders versus the broader network, analysts can assess potential risks related to price manipulation, liquidity concerns, and overall ecosystem health.
Currently, BUCK exhibits a moderate level of concentration, with the top holder controlling approximately 18.16% of the total supply (181,636.32K tokens). The top five addresses collectively account for 32.16% of circulating tokens, while the remaining 67.84% is distributed among other holders. This distribution pattern suggests a relatively balanced structure compared to highly concentrated projects where top addresses might control over 50% of supply. The largest single holder's position, while significant, does not pose an immediate centralization threat, as nearly two-thirds of tokens remain dispersed across the broader community.
From a market dynamics perspective, this distribution presents both stability factors and potential volatility triggers. The substantial portion held by smaller addresses (67.84%) indicates meaningful retail participation and reduces the risk of coordinated dumps by a few large holders. However, the top holder's 18.16% position retains considerable influence over short-term price movements, particularly during periods of low liquidity. The gradual decrease in holdings from the first to fifth largest addresses (18.16% to 2.94%) demonstrates a tiered ownership structure rather than extreme whale dominance. This configuration typically supports more organic price discovery while maintaining sufficient liquidity depth for trading activities.
Click to view current BUCK Holding Distribution
| Top |
Address |
Holding Qty |
Holding (%) |
| 1 |
5Q544f...pge4j1 |
181636.32K |
18.16% |
| 2 |
AJF3kX...CKU3WT |
50050.00K |
5.00% |
| 3 |
9kwuhM...AKZxJE |
30517.91K |
3.05% |
| 4 |
HEY8Wt...ygfHzD |
30174.00K |
3.01% |
| 5 |
D5jx4w...e1nw8p |
29399.59K |
2.94% |
| - |
Others |
678071.37K |
67.84% |
II. Core Factors Influencing BUCK's Future Price
Supply Mechanism
-
Supply and Demand Dynamics: BUCK's future price trajectory is primarily governed by the fundamental relationship between market supply and demand. When demand outpaces available supply, upward price pressure typically emerges, while oversupply relative to demand tends to exert downward pressure on valuations.
-
Historical Patterns: Historical market data suggests that significant shifts in supply-demand equilibrium have consistently served as primary drivers of price volatility. Periods of constrained supply coupled with rising demand have historically corresponded with appreciating price trends.
-
Current Outlook: Market demand fluctuations and production cost variations are expected to remain important factors influencing price movements in the near term. Changes in these underlying fundamentals may create price adjustment opportunities.
Macroeconomic Environment
-
Monetary Policy Influence: Broader macroeconomic factors, including central bank policy decisions and regulatory developments, may impact BUCK's price performance. Shifts in monetary conditions can influence investor risk appetite and capital allocation decisions across asset classes.
-
Policy and Regulatory Considerations: Government policy adjustments and regulatory frameworks may affect market sentiment and trading dynamics. Changes in the regulatory landscape warrant monitoring as potential price-influencing factors.
Market Competition and Technology
-
Competitive Landscape: The level of market competition and the pace of technological advancement within the sector may influence BUCK's relative positioning and market share. Competitive dynamics can affect long-term valuation prospects.
-
Innovation Drivers: Technological progress and innovation within the ecosystem may contribute to enhanced utility and adoption, potentially supporting price appreciation over extended time horizons.
III. 2026-2031 BUCK Price Prediction
2026 Outlook
- Conservative Forecast: $0.00039 - $0.00059
- Neutral Forecast: $0.00059 (average price level)
- Optimistic Forecast: $0.00065 (contingent on favorable market conditions and sustained trading volume)
Based on the prediction data, BUCK may experience a slight contraction in 2026, with an anticipated price change of -2%. The projected price range spans from a low of $0.00039 to a high of $0.00065, with an average price expectation around $0.00059. This modest correction could reflect a consolidation phase following earlier market movements.
2027-2029 Outlook
- Market Stage Expectation: Recovery and gradual growth trajectory with increasing momentum
- Price Range Predictions:
- 2027: $0.00043 - $0.00076 (average $0.00062, +2% change)
- 2028: $0.00057 - $0.00090 (average $0.00069, +14% change)
- 2029: $0.00056 - $0.00099 (average $0.00080, +32% change)
- Key Catalysts: Enhanced adoption rates, potential ecosystem developments, and broader cryptocurrency market recovery trends
The mid-term projection indicates a progressive upward trend, with 2028 marking a notable acceleration showing a 14% price change, followed by a more substantial 32% increase in 2029. This growth pattern suggests potential strengthening of market fundamentals and increasing investor interest during this period.
2030-2031 Long-term Outlook
- Baseline Scenario: $0.00067 - $0.00115 in 2030 (assuming continued market maturation and stable adoption)
- Optimistic Scenario: $0.00090 average price in 2030, potentially reaching $0.00102 average by 2031 (+48% and +69% respective changes)
- Transformative Scenario: $0.00115 peak in 2030 (under exceptionally favorable conditions including significant protocol upgrades or major partnerships)
The long-term forecast through 2031 presents an encouraging growth trajectory, with projections indicating substantial appreciation potential. By 2030, BUCK could potentially trade within a range of $0.00067 to $0.00115, representing a 48% cumulative price change. The 2031 outlook suggests further consolidation with prices potentially stabilizing between $0.00061 and $0.00107, with an average around $0.00102, marking a cumulative 69% increase from the 2026 baseline.
- 2026-02-05: BUCK exhibits positioning within the projected early-year range as the market enters a transitional phase
| Year |
Predicted High Price |
Predicted Average Price |
Predicted Low Price |
Price Change |
| 2026 |
0.00065 |
0.00059 |
0.00039 |
-2 |
| 2027 |
0.00076 |
0.00062 |
0.00043 |
2 |
| 2028 |
0.0009 |
0.00069 |
0.00057 |
14 |
| 2029 |
0.00099 |
0.0008 |
0.00056 |
32 |
| 2030 |
0.00115 |
0.0009 |
0.00067 |
48 |
| 2031 |
0.00107 |
0.00102 |
0.00061 |
69 |
IV. BUCK Professional Investment Strategies and Risk Management
BUCK Investment Methodology
(1) Long-term Holding Strategy
- Target Investors: Crypto enthusiasts interested in meme tokens and GameStop brand supporters
- Operational Recommendations:
- Consider dollar-cost averaging to mitigate entry price volatility
- Monitor community engagement and brand developments related to GameStop
- Storage Solution: Utilize Gate Web3 Wallet for secure SOL-based token storage with built-in security features
(2) Active Trading Strategy
- Technical Analysis Tools:
- Volume Analysis: Monitor the 24-hour trading volume ($12,976) relative to market cap to assess liquidity conditions
- Support and Resistance Levels: Track the 24-hour range ($0.0004522 - $0.0007506) to identify potential entry and exit points
- Swing Trading Points:
- Consider the token's high volatility, with 1-hour movements showing significant fluctuations
- Monitor price action near the all-time low of $0.0004522 for potential support levels
BUCK Risk Management Framework
(1) Asset Allocation Principles
- Conservative Investors: 0.5-1% of crypto portfolio
- Aggressive Investors: 2-3% of crypto portfolio
- Professional Investors: 3-5% of crypto portfolio with active management
(2) Risk Hedging Solutions
- Portfolio Diversification: Allocate across multiple asset classes and avoid overexposure to single meme tokens
- Position Sizing: Limit exposure based on the token's 100% circulating supply and relatively small market cap of approximately $602,896
(3) Secure Storage Solutions
- Web Wallet Recommendation: Gate Web3 Wallet provides native support for Solana-based tokens with user-friendly interface
- Multi-signature Options: Consider additional security layers for larger holdings
- Security Precautions: Never share private keys, enable two-factor authentication, and be cautious of phishing attempts targeting meme token holders
V. BUCK Potential Risks and Challenges
BUCK Market Risks
- High Volatility: The token has experienced significant price decline of 98.97% from its all-time high of $0.05859, indicating extreme volatility
- Limited Liquidity: With 24-hour trading volume of approximately $12,976 against a market cap of $602,896, liquidity constraints may impact larger trades
- Price Correlation: As a meme token associated with GameStop brand, price movements may be influenced by sentiment rather than fundamental value
BUCK Regulatory Risks
- Classification Uncertainty: Meme tokens may face scrutiny regarding their utility and potential classification under securities regulations
- Platform Compliance: Regulatory changes affecting meme token listings could impact trading availability across exchanges
- Brand Association: Potential regulatory actions or statements from GameStop could indirectly affect token perception
BUCK Technical Risks
- Smart Contract Dependency: As a Solana-based token, it relies on the security and stability of the Solana network
- Limited Exchange Presence: Currently available on 1 exchange, which concentrates trading risk and reduces redundancy
- Holder Concentration: With 11,307 holders and 100% circulating supply, potential concentration among early adopters could lead to significant price impacts
VI. Conclusion and Action Recommendations
BUCK Investment Value Assessment
BUCK represents a high-risk speculative asset as the official mascot token of GameStop. While it benefits from brand recognition and a dedicated community of 11,307 holders, the token faces significant challenges including a 98.97% decline from its all-time high, limited exchange availability, and modest trading volumes. The fully diluted market cap of approximately $602,896 suggests a micro-cap asset with substantial volatility potential. Short-term risks include continued price pressure and liquidity constraints, while any long-term value would depend heavily on sustained community engagement and potential GameStop brand developments.
BUCK Investment Recommendations
✅ Beginners: Avoid or limit exposure to less than 0.5% of total portfolio due to extreme volatility and speculative nature
✅ Experienced Investors: Consider small speculative positions (1-2% of crypto portfolio) with strict stop-loss parameters and regular monitoring
✅ Institutional Investors: Exercise extreme caution given limited liquidity, narrow exchange availability, and micro-cap characteristics that may not meet institutional risk parameters
BUCK Trading Participation Methods
- Spot Trading: Access BUCK spot markets on Gate.com with real-time price monitoring
- Gradual Position Building: Utilize limit orders to avoid slippage in lower liquidity conditions
- Community Monitoring: Stay informed through official social channels to track sentiment and potential developments
Cryptocurrency investments carry extremely high risks, and this article does not constitute investment advice. Investors should make prudent decisions based on their own risk tolerance and are advised to consult professional financial advisors. Never invest more than you can afford to lose.
FAQ
What is BUCK token and what is its main use case?
BUCK is a BEP-20 utility token within the CoinBuck ecosystem. Its primary use case is to reward and incentivize users participating in the CoinBuck platform, providing benefits and value to active community members.
What factors influence BUCK token price movements?
BUCK token price is driven by supply and demand dynamics, market sentiment, trading volume, cryptocurrency market trends, and fundamental developments within the BUCK ecosystem.
What is the price prediction for BUCK in 2024 and 2025?
In 2025, BUCK is expected to reach $0.001455 during an upward trend, but could drop to $0.00000895 if momentum weakens. Insufficient data available for 2024 predictions.
What are the risks associated with investing in BUCK?
BUCK faces risks including limited investor interest and concentrated asset holdings. A significant portion of assets held by single entities can create market instability and liquidity challenges, potentially affecting price volatility and investment returns.
How does BUCK compare to other similar tokens in the market?
BUCK outperforms other stablecoins with 0.20% weekly gains while comparable tokens declined 0.70%. Trading at $0.00001320 BTC with $702,921.35 daily volume and $342,008.20 market cap, BUCK demonstrates strong stability and market performance.
* The information is not intended to be and does not constitute financial advice or any other recommendation of any sort offered or endorsed by Gate.