This comprehensive guide provides expert analysis and market forecasts for Celsius Network (CEL) token from 2026 to 2031. CEL currently trades at $0.023 with extreme fear market sentiment (index: 14), facing significant challenges including 85.13% annual decline and limited liquidity ($822K market cap). The article examines CEL's historical trajectory, from its 2018 launch at $0.30 to 2021 peak of $8.05, analyzing key price drivers including token concentration, ecosystem developments, and macroeconomic conditions. Price predictions range from $0.0187-$0.0311 in 2026 to $0.0353-$0.0522 by 2031. Investment strategies include dollar-cost averaging for long-term holders and technical trading approaches, with strict risk management frameworks. The analysis emphasizes CEL as high-risk, suitable for experienced investors only, recommending positions of 1-3% portfolio allocation with careful monitoring of platform developments and regulatory changes on Gate.com.
Introduction: CEL's Market Position and Investment Value
Celsius Network (CEL), as a centralized crypto lending and borrowing platform token, has experienced significant market fluctuations since its launch in 2018. As of February 2026, CEL maintains a market cap of approximately $822,254, with a circulating supply of around 35.72 million tokens and a price hovering near $0.023. This digital asset, which once played a role in the decentralized finance lending sector, has undergone substantial market adjustments following the platform's operational challenges.
This article will comprehensively analyze CEL's price trajectory from 2026 to 2031, incorporating historical patterns, market supply-demand dynamics, ecosystem developments, and macroeconomic conditions to provide investors with professional price forecasts and practical investment strategies.
I. CEL Price History Review and Market Status
CEL Historical Price Evolution Trajectory
- 2018: Celsius Network token (CEL) was officially launched in March with an initial offering price of $0.3, marking the beginning of its market journey in the centralized lending platform sector.
- 2021: CEL reached its all-time high of $8.05 on June 4, reflecting strong market interest in crypto lending platforms during the bull market cycle.
- 2025: The token experienced significant downward pressure, hitting its all-time low of $0.01950224 on December 18, representing a substantial decline from its historical peak.
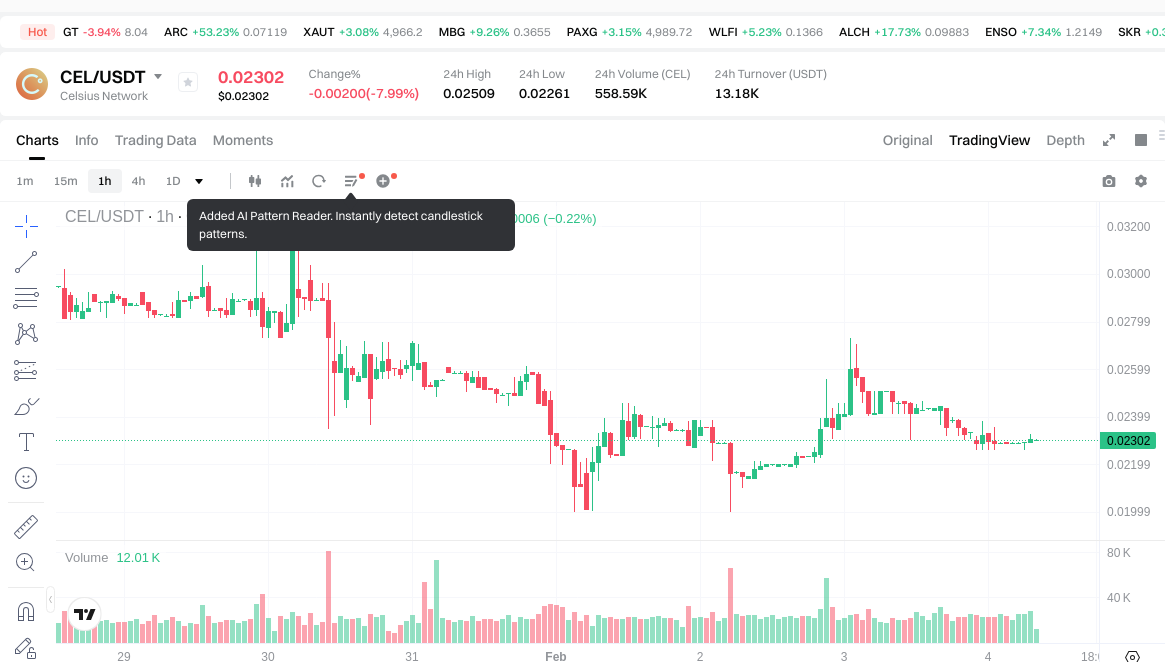
CEL Current Market Status
As of February 4, 2026, CEL is trading at $0.02302, demonstrating recent volatility across multiple timeframes. The token has shown a modest 1-hour gain of 0.83%, while facing downward pressure over longer periods with a 24-hour decline of 7.79%. The 7-day performance indicates a 20.36% decrease, and the 30-day chart reflects a 32.25% drop. Year-over-year data reveals an 85.13% decline, highlighting the challenging market conditions the token has faced.
The current 24-hour trading range spans from $0.02261 to $0.02509, with a total trading volume of approximately $13,173.64. The circulating supply stands at 35,719,125.9003 CEL tokens out of a total supply of 37,720,111, representing a circulation ratio of approximately 5.13%. The market capitalization currently sits at around $822,254, while the fully diluted valuation reaches approximately $868,317.
CEL maintains a market dominance of 0.000032% within the broader cryptocurrency landscape, ranking at position 2647. The token is supported by approximately 30,585 holders and is available for trading on 2 exchanges. The current market sentiment index indicates a reading of 14, corresponding to an "Extreme Fear" classification in market emotion indicators.
Click to view current CEL market price
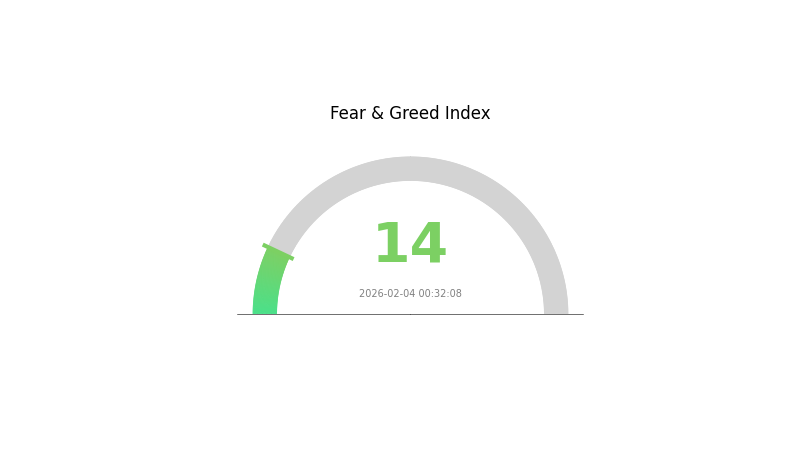
CEL Market Sentiment Indicator
2026-02-04 Fear and Greed Index: 14 (Extreme Fear)
Click to view current Fear & Greed Index
The cryptocurrency market is currently experiencing extreme fear, with the Fear and Greed Index standing at just 14 points. This indicates severe market pessimism and heightened investor anxiety. During periods of extreme fear, long-term investors often view this as a potential buying opportunity, as assets may be undervalued. However, traders should exercise caution and conduct thorough research before making investment decisions. Market volatility remains elevated, and risk management is essential. Monitor market developments closely on Gate.com for real-time data and trading opportunities.
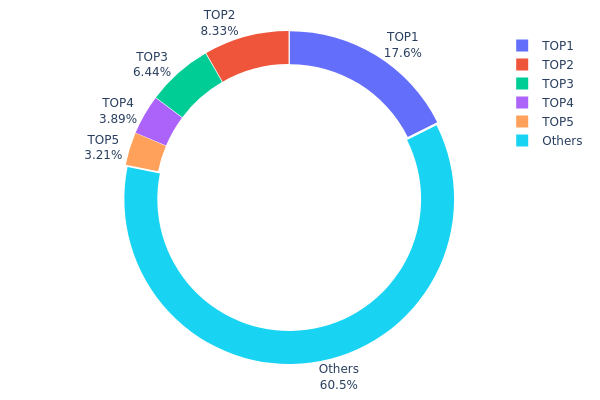
CEL 持仓分布
The address holding distribution chart illustrates how CEL tokens are allocated across different wallet addresses on the blockchain, providing critical insights into the degree of decentralization and potential market control dynamics. This metric is essential for assessing whether token supply is concentrated among a few large holders or distributed more evenly across the network.
Based on the current data, CEL exhibits a moderate concentration pattern with the top holder controlling approximately 17.59% of the total supply (6,285.88K tokens), followed by the second-largest address holding 8.32% (2,974.49K tokens). The top five addresses collectively account for 39.45% of the circulating supply, while the remaining 60.55% is distributed among other addresses. This distribution suggests a semi-concentrated structure where major stakeholders maintain significant influence but do not completely dominate the market.
From a market structure perspective, this concentration level presents both opportunities and risks. While the 60.55% held by smaller addresses indicates reasonable decentralization and community participation, the substantial holdings by top addresses could introduce price volatility during large-scale liquidations or strategic repositioning. Such concentration may amplify price movements in either direction, particularly during periods of low liquidity. However, compared to projects where top holders control over 50% of supply, CEL's distribution demonstrates relatively healthy on-chain fundamentals with reduced susceptibility to single-entity manipulation.
Click to view the current CEL Holding Distribution
| Top |
Address |
Holding Qty |
Holding (%) |
| 1 |
0x4426...46149a |
6285.88K |
17.59% |
| 2 |
0x91dc...20dc92 |
2974.49K |
8.32% |
| 3 |
0x638b...df4756 |
2301.63K |
6.44% |
| 4 |
0x0d07...b492fe |
1390.39K |
3.89% |
| 5 |
0xf89d...5eaa40 |
1146.84K |
3.21% |
| - |
Others |
21619.89K |
60.55% |
II. Core Factors Influencing CEL's Future Price
Supply Mechanism
- Token Concentration Risk: High token concentration poses significant downside risk to price stability, requiring enhanced risk management strategies.
- Liquidity Constraints: Low liquidity levels in the current market structure may limit price discovery efficiency and increase volatility during trading events.
Institutional and Major Holder Dynamics
- Developer Activity: Ongoing developer engagement and activity levels serve as key indicators for project momentum and potential ecosystem growth.
- Exchange Listings: New exchange listings and trading pair additions can significantly impact token accessibility and trading volume.
Macroeconomic Environment
- Market Sentiment: Broader cryptocurrency market sentiment and trends continue to influence CEL's price movements, reflecting correlation with major digital assets.
- Liquidity Events: Market liquidity conditions and major liquidity events can trigger significant price fluctuations.
Technical Development and Ecosystem Building
- Platform Development: Continued platform improvements and feature rollouts may support long-term value proposition.
- Risk Management Framework: Implementation of robust risk management protocols is essential for addressing token concentration concerns and market stability.
III. 2026-2031 CEL Price Prediction
2026 Outlook
- Conservative Forecast: $0.01865 - $0.02302
- Neutral Forecast: $0.02302
- Optimistic Forecast: $0.03108 (contingent on favorable market conditions and potential ecosystem developments)
2027-2029 Mid-term Outlook
- Market Stage Expectation: Potential gradual recovery phase with steady upward momentum, possibly driven by broader crypto market cycles and platform developments
- Price Range Predictions:
- 2027: $0.02191 - $0.03624 (approximately 17% change from 2026 baseline)
- 2028: $0.02563 - $0.04367 (approximately 37% change, indicating accelerated growth potential)
- 2029: $0.03126 - $0.05084 (approximately 63% change, suggesting continued positive trajectory)
- Key Catalysts: Market sentiment shifts, potential regulatory clarity, technological improvements, and increased adoption within the ecosystem
2030-2031 Long-term Outlook
- Baseline Scenario: $0.0239 - $0.04735 in 2030 (assuming sustained market interest and platform stability)
- Optimistic Scenario: $0.03527 - $0.05221 by 2031 (assuming favorable regulatory environment and strong ecosystem growth)
- Transformative Scenario: Potential to reach upper boundaries if exceptional market conditions align with significant platform innovations and widespread adoption
- 2026-02-04: CEL trading within established range as market establishes new support levels
| Year |
Predicted High Price |
Predicted Average Price |
Predicted Low Price |
Price Change |
| 2026 |
0.03108 |
0.02302 |
0.01865 |
0 |
| 2027 |
0.03624 |
0.02705 |
0.02191 |
17 |
| 2028 |
0.04367 |
0.03165 |
0.02563 |
37 |
| 2029 |
0.05084 |
0.03766 |
0.03126 |
63 |
| 2030 |
0.04735 |
0.04425 |
0.0239 |
92 |
| 2031 |
0.05221 |
0.0458 |
0.03527 |
98 |
IV. CEL Professional Investment Strategy and Risk Management
CEL Investment Methodology
(1) Long-term Holding Strategy
- Target Investors: Investors with moderate to high risk tolerance who believe in the fundamental value of decentralized finance lending platforms
- Operational Recommendations:
- Consider dollar-cost averaging (DCA) approach to reduce timing risk, especially given the token's significant volatility with a -85.13% annual decline
- Monitor project developments and platform recovery progress, as Celsius Network has faced operational challenges
- Storage Solution: Utilize Gate Web3 Wallet for secure asset custody with multi-signature protection and cold storage options for long-term holdings
(2) Active Trading Strategy
- Technical Analysis Tools:
- Moving Averages: Use 50-day and 200-day moving averages to identify trend reversals, particularly important given the -20.36% weekly decline
- Volume Analysis: Monitor 24-hour trading volume ($13,173.64) relative to market cap ($822,254.28) to assess liquidity and market interest
- Swing Trading Points:
- Set strict stop-loss orders at 5-8% below entry points due to high volatility (-7.79% in 24 hours)
- Monitor support level near $0.0226 (24-hour low) and resistance at $0.0251 (24-hour high)
CEL Risk Management Framework
(1) Asset Allocation Principles
- Conservative Investors: 0-1% portfolio allocation, considering the high-risk nature and limited liquidity
- Aggressive Investors: 2-5% portfolio allocation, with awareness of significant downside potential
- Professional Investors: Up to 10% allocation with active hedging strategies and continuous monitoring
(2) Risk Hedging Solutions
- Portfolio Diversification: Combine CEL with established blue-chip cryptocurrencies to offset specific project risk
- Position Sizing: Limit individual position size to avoid overexposure to a single centralized lending platform token
(3) Secure Storage Solutions
- Hot Wallet Recommendation: Gate Web3 Wallet for active trading with enhanced security features and multi-chain support
- Cold Storage Solution: Transfer long-term holdings to hardware wallets or cold storage solutions to minimize online exposure risks
- Security Precautions: Enable two-factor authentication, regularly update security protocols, and never share private keys or recovery phrases
V. CEL Potential Risks and Challenges
CEL Market Risks
- Extreme Price Volatility: The token has experienced an 85.13% decline over the past year and -32.25% over 30 days, indicating substantial market risk
- Limited Liquidity: With a market cap of only $822,254.28 and 24-hour volume of $13,173.64, the token faces significant liquidity constraints that may impact exit strategies
- Market Dominance: With only 0.000032% market share, CEL has minimal influence in the broader cryptocurrency market
CEL Regulatory Risks
- Centralized Platform Scrutiny: As a centralized lending platform token, CEL may face increased regulatory oversight in jurisdictions implementing stricter crypto lending regulations
- Compliance Requirements: Evolving regulatory frameworks for crypto lending services may impact platform operations and token utility
- Operational Restrictions: Potential regulatory actions could limit platform functionality or geographic availability
CEL Technical Risks
- Smart Contract Vulnerability: As an ERC-20 token on Ethereum (contract: 0xaaaebe6fe48e54f431b0c390cfaf0b017d09d42d), the token faces inherent smart contract risks
- Platform Dependency: Token value is closely tied to Celsius Network platform performance and operational status
- Limited Exchange Availability: Trading on only 2 exchanges increases concentration risk and potential price manipulation
VI. Conclusion and Action Recommendations
CEL Investment Value Assessment
CEL presents a high-risk investment opportunity with limited near-term upside potential. The token has experienced severe price depreciation (-85.13% annually) and maintains minimal market presence (0.000032% dominance). The circulating supply represents only 5.13% of total supply, indicating potential future dilution risk. While the Celsius Network platform supports 33 cryptocurrencies and provides lending services, investors should approach with extreme caution given the token's current market position, limited liquidity, and significant historical drawdowns from its all-time high of $8.05 to the current price of $0.02302.
CEL Investment Recommendations
✅ Beginners: Avoid investment or limit exposure to less than 0.5% of portfolio as a speculative position only after thorough research and understanding of platform-specific risks
✅ Experienced Investors: Consider small speculative positions (1-3% portfolio allocation) with strict risk management protocols, stop-losses, and continuous monitoring of platform developments
✅ Institutional Investors: Conduct comprehensive due diligence on platform operations, regulatory compliance, and business model sustainability before considering any allocation
CEL Trading Participation Methods
- Spot Trading: Execute purchases on Gate.com with careful attention to order book depth and market liquidity given the limited trading volume
- Dollar-Cost Averaging: Implement systematic purchase plans to mitigate timing risk, particularly relevant given the token's high volatility
- Risk-Adjusted Position Sizing: Calculate position sizes based on portfolio volatility targets and individual risk tolerance, never exceeding predetermined maximum allocation limits
Cryptocurrency investment carries extremely high risks, and this article does not constitute investment advice. Investors should make prudent decisions based on their own risk tolerance and are advised to consult professional financial advisors. Never invest more than you can afford to lose.
FAQ
What is CEL token and what is its use case?
CEL token is the native token of Celsius platform, enabling users to earn discounts on loans and receive enhanced staking rewards. It powers the platform's incentive ecosystem.
What factors influence CEL price movements?
CEL price movements are driven by market demand and supply, trading volume, investor sentiment, regulatory developments, and macroeconomic conditions. Platform performance and tokenomics also significantly impact price dynamics.
What was the historical price of CEL and what caused major fluctuations?
CEL reached $3.21 in July 2022. Major price swings were driven by market sentiment, regulatory developments, DeFi protocol changes, and overall crypto market conditions during bull and bear cycles.
What are expert price predictions for CEL in 2024-2025?
Expert predictions for CEL in 2024-2025 suggest a target range of $0.0058–$0.0071. Analysts focus on Layer-2 scaling developments in DeFi sector as key price drivers.
How does CEL price compare to other cryptocurrency tokens?
CEL has declined 23.90% in the last week, underperforming the broader crypto market down 13.10%. As of February 2026, CEL trades lower than many major cryptocurrencies, reflecting weaker market momentum compared to top-tier tokens.
What are the risks and challenges for CEL price in the future?
CEL price faces regulatory uncertainties, market adoption challenges, and competitive pressures. Token utility expansion and ecosystem growth are critical factors. Macroeconomic conditions and crypto market sentiment also significantly impact CEL's price trajectory.
How can I analyze CEL price trends and technical indicators?
Monitor key technical indicators like RSI, MACD, and moving averages(50-day and 200-day)to identify price momentum and trends. Track trading volume patterns and support/resistance levels for accurate market analysis.
What is the current market cap and trading volume of CEL?
CEL's current market cap and 24-hour trading volume fluctuate based on market conditions. For real-time data, check major tracking platforms. CEL maintains significant liquidity across multiple markets, reflecting strong community engagement and ongoing developments in the Celsius ecosystem.
* The information is not intended to be and does not constitute financial advice or any other recommendation of any sort offered or endorsed by Gate.