This comprehensive CHIRP price prediction analysis evaluates the IoT ecosystem token's trajectory from 2026 through 2031, combining historical performance data with market fundamentals. CHIRP, built on Sui blockchain as a DePIN platform, currently trades at $0.00923 with a market cap of approximately $980,835, down 88.75% from its January 2025 launch price. The article examines core price drivers including ecosystem adoption, DePIN technology advancement, macroeconomic conditions, and token supply dynamics. Professional price forecasts project potential growth to $0.01426 average by 2031, representing 54% cumulative appreciation under favorable conditions. Investment strategies address long-term holding and active trading approaches with risk management frameworks, while detailed analysis covers market risks, regulatory uncertainties, and technical vulnerabilities. The article concludes with tailored recommendations for different investor profiles and provides transparent guidance on CHIRP trading participati
Introduction: CHIRP's Market Position and Investment Value
Chirp (CHIRP) serves as an IoT ecosystem built on the Sui blockchain, combining a Decentralized Physical Infrastructure Network (DePIN) with comprehensive tools for RWA and IoT project deployment. Since its launch in 2025, the project has established a foundation in the decentralized IoT connectivity space through community-owned miners that reward participants with $CHIRP tokens. As of 2026, CHIRP maintains a market capitalization of approximately $980,835, with a circulating supply of around 106.27 million tokens, and the price is trading near $0.00923. This asset, positioned at the intersection of blockchain infrastructure and Internet of Things applications, is playing an increasingly relevant role in connecting physical devices to decentralized networks.
This article will comprehensively analyze CHIRP's price trajectory from 2026 to 2031, combining historical patterns, market supply-demand dynamics, ecosystem development, and macroeconomic conditions to provide investors with professional price projections and practical investment strategies.
I. CHIRP Price History Review and Market Status
CHIRP Historical Price Evolution
- 2025: CHIRP launched at a price of $0.15 on January 19, 2025, experiencing initial trading activity as the token entered the market
- 2025: The token reached an all-time high of $0.7308 on January 20, 2025, representing a significant surge shortly after its market debut
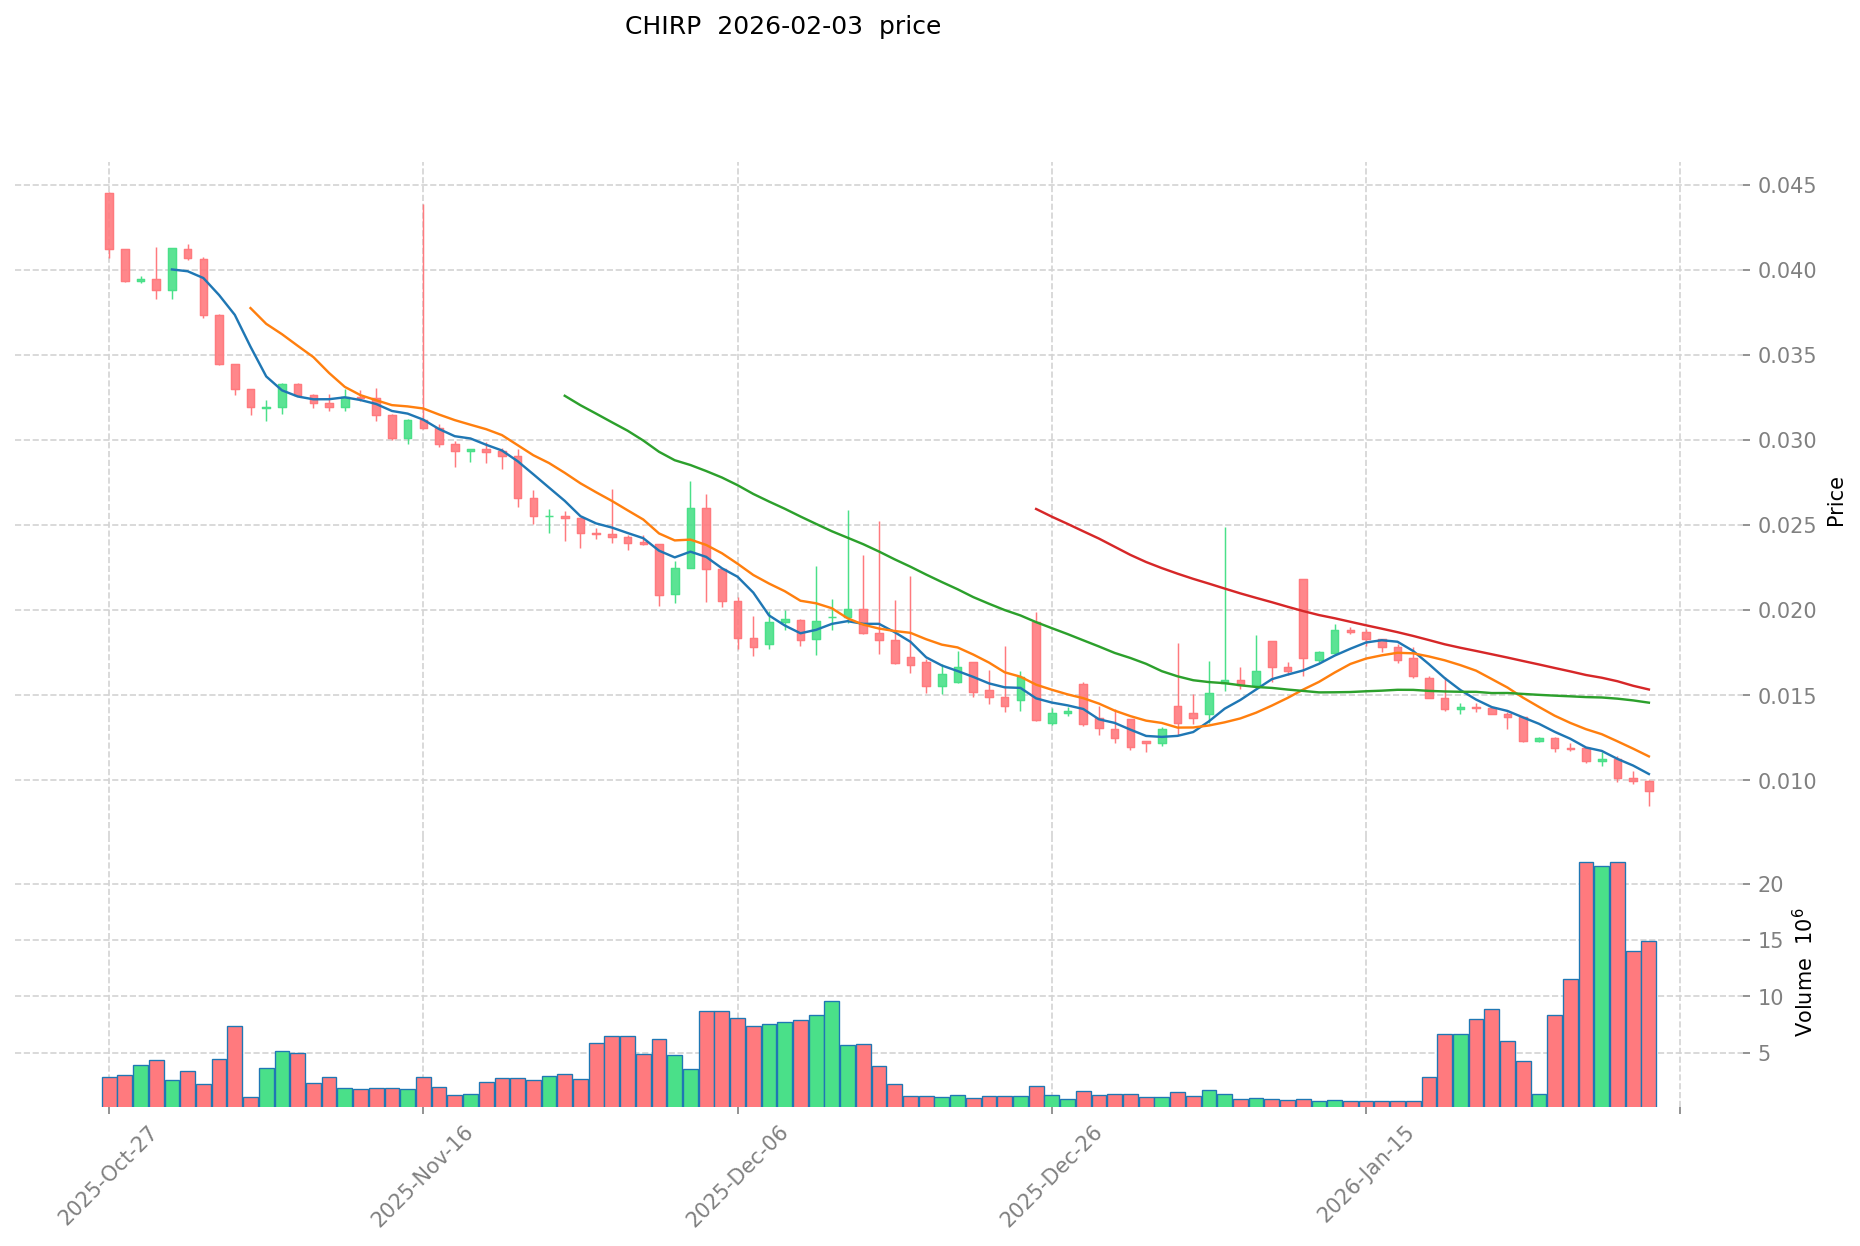
- 2026: Market conditions led to a substantial decline, with CHIRP dropping to an all-time low of $0.008488 on February 2, 2026
CHIRP Current Market Position
As of February 3, 2026, CHIRP is trading at $0.00923, showing a modest 24-hour increase of 2.18%. The token has demonstrated recent short-term volatility, with a 1-hour gain of 0.38%, while facing broader downward pressure over extended timeframes. The 7-day performance shows a decline of 22.06%, and the 30-day period reflects a decrease of 33.19%. Since its launch, CHIRP has experienced an 88.75% decline from its initial offering price.
The token maintains a market capitalization of approximately $980,835, with a circulating supply of 106,266,000 CHIRP tokens out of a maximum supply of 300,000,000. The current market cap represents 35.42% of its fully diluted valuation of $344,740. Trading volume over the past 24 hours reached $117,622, indicating active market participation despite recent price challenges.
CHIRP's market dominance stands at 0.000012%, reflecting its position as an emerging asset within the broader cryptocurrency ecosystem. The token ranks at position 2524 in the overall market. Recent 24-hour price action saw CHIRP fluctuate between a low of $0.009023 and a high of $0.00944. The project currently has 3,685 token holders participating in its ecosystem.
Click to view current CHIRP market price
CHIRP Market Sentiment Index
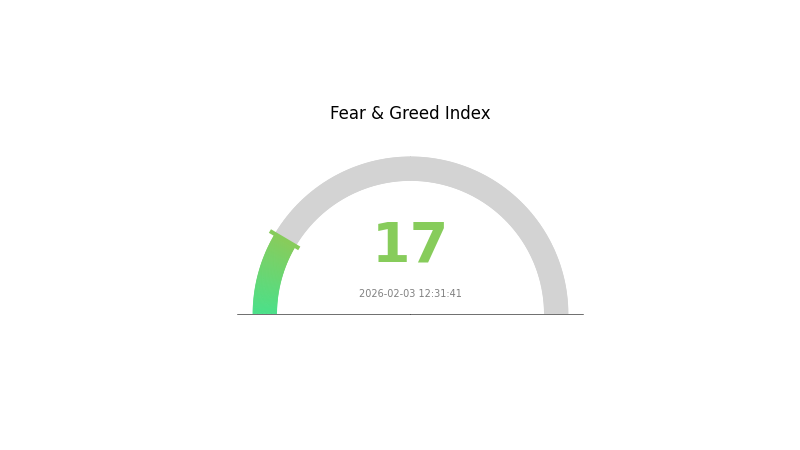
2026-02-03 Fear and Greed Index: 17 (Extreme Fear)
Click to view current Fear & Greed Index
The crypto market is currently experiencing extreme fear, with the Fear and Greed Index at 17. This indicates significant market pessimism and risk aversion among investors. During such periods, panic selling often dominates, and asset prices may decline further. However, extreme fear historically presents contrarian opportunities for long-term investors to accumulate positions at lower valuations. It's crucial to remain rational, conduct thorough research, and avoid making impulsive decisions driven by emotional reactions. Monitor market developments closely and consider your risk tolerance before making any investment moves.
CHIRP Holdings Distribution
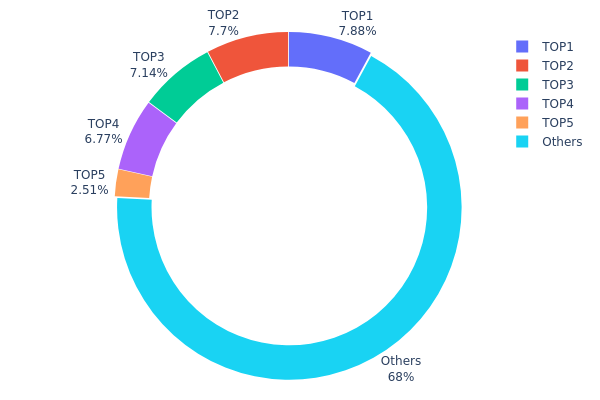
The holdings distribution chart reveals the concentration level of token ownership across different addresses within the CHIRP ecosystem. This metric serves as a critical indicator of decentralization and potential market manipulation risks. By analyzing the distribution pattern, investors can assess whether the token's circulation is dominated by a few large holders (whales) or more evenly distributed among a broader participant base.
Based on the current data, CHIRP demonstrates a moderate level of concentration in its holdings structure. The top 5 addresses collectively control approximately 31.96% of the total supply, with the largest holder possessing 7.87% (6,286.03K tokens) and the second-largest holding 7.69% (6,140.56K tokens). Notably, the remaining 68.04% of tokens are distributed among other addresses, suggesting a relatively diversified ownership pattern compared to many newly launched projects where top holders often exceed 50% of total supply.
This distribution pattern presents both opportunities and risks for market participants. The concentration of nearly 32% among top addresses indicates that coordinated large-scale sell-offs could trigger significant price volatility. However, the fact that no single address controls more than 8% of supply reduces the risk of unilateral market manipulation. The substantial 68.04% held by smaller addresses reflects healthy retail participation and suggests that the token has achieved reasonable community adoption. This balanced structure generally supports more stable price discovery mechanisms, though investors should remain vigilant about potential coordinated movements among the top holders during critical market phases.
Click to view current CHIRP Holdings Distribution
| Top |
Address |
Holding Qty |
Holding (%) |
| 1 |
0xf72d...1ecb9c |
6286.03K |
7.87% |
| 2 |
0x62f3...fa53ad |
6140.56K |
7.69% |
| 3 |
0x2a95...4b5966 |
5700.00K |
7.14% |
| 4 |
0xe745...53e882 |
5400.00K |
6.76% |
| 5 |
0xe53c...7c7505 |
2000.00K |
2.50% |
| - |
Others |
54254.88K |
68.04% |
II. Core Factors Influencing CHIRP's Future Price
Market Sentiment and Trading Dynamics
- Market Sentiment: CHIRP's price is significantly influenced by overall market sentiment within the cryptocurrency sector. Positive sentiment can drive increased buying activity, while negative sentiment may lead to selling pressure.
- Trading Volume: Trading volume serves as a key indicator of market interest and liquidity. Higher trading volumes typically correlate with stronger price movements and market participation.
- User Adoption Trends: The rate at which users adopt CHIRP technology and integrate it into their operations plays a crucial role in determining long-term value appreciation.
Technological Development and Ecosystem Growth
- IoT Ecosystem Integration: CHIRP operates within the Internet of Things (IoT) ecosystem on the Sui blockchain, representing a core component for future IoT infrastructure development. The project's emphasis on quality over quantity helps avoid market saturation while ensuring community engagement.
- DePIN Network Innovation: As part of the Decentralized Physical Infrastructure Network (DePIN), CHIRP connects traditional assets with decentralized systems, potentially transforming the Web3 landscape through its innovative approach.
- Technical Advancement: Ongoing technological developments and improvements to the platform's capabilities can enhance utility and attract additional users, thereby supporting price stability and growth potential.
Macroeconomic Conditions
- Interest Rate Changes: Broader macroeconomic factors, including fluctuations in interest rates, can impact investor appetite for risk assets like cryptocurrencies. Changes in monetary policy may influence capital flows into or out of digital assets.
- Liquidity Conditions: Market liquidity conditions affect the ease with which CHIRP can be traded without significant price impact. Enhanced liquidity generally supports more stable price discovery.
- Regulatory Environment: Regulatory policy changes and government oversight can significantly affect market dynamics. Positive regulatory developments may boost confidence, while restrictive policies could introduce uncertainty.
Supply Dynamics and Token Economics
- Supply Structure: Based on token economics and historical performance, CHIRP's price trajectory can be estimated by analyzing supply dynamics. The project's approach emphasizes controlled supply growth to maintain value.
- Adoption Trends: Sustained user adoption and integration of CHIRP into real-world applications contribute to fundamental demand, which can support price appreciation over time.
- Market Analysis: Analysts and traders typically monitor supply dynamics, adoption trends, and broader crypto market conditions to form expectations about future price movements.
Risk Notice: The cryptocurrency market experiences significant volatility. CHIRP's price may be influenced by market sentiment, regulatory policy changes, and other factors. Investment requires caution and thorough research.
III. 2026-2031 CHIRP Price Prediction
2026 Outlook
- Conservative Prediction: $0.00535 - $0.00922
- Neutral Prediction: Around $0.00922
- Optimistic Prediction: Up to $0.01088 (requires favorable market conditions and increased adoption)
2027-2029 Outlook
- Market Stage Expectation: CHIRP may enter a gradual growth phase, with the market potentially showing signs of recovery and expansion during this period
- Price Range Predictions:
- 2027: $0.00844 - $0.01146, with an average price around $0.01005
- 2028: $0.00946 - $0.01312, with an average price around $0.01075
- 2029: $0.00847 - $0.01576, with an average price around $0.01194
- Key Catalysts: The projected price changes of 8%, 16%, and 29% for these respective years suggest potential drivers including ecosystem development, technological improvements, and broader market sentiment shifts
2030-2031 Long-term Outlook
- Baseline Scenario: $0.01066 - $0.01468 in 2030 (assuming steady market conditions and continued project development)
- Optimistic Scenario: $0.01355 - $0.01711 by 2031 (assuming strong adoption growth and favorable crypto market environment)
- Transformative Scenario: Prices could potentially exceed $0.01711 (under exceptionally favorable conditions including mass adoption and significant technological breakthroughs)
- 2026-02-03: CHIRP is positioned at the beginning of a potential multi-year growth trajectory, with price predictions showing a cumulative increase of approximately 50-54% by 2030-2031
| Year |
Predicted High Price |
Predicted Average Price |
Predicted Low Price |
Price Change |
| 2026 |
0.01088 |
0.00922 |
0.00535 |
0 |
| 2027 |
0.01146 |
0.01005 |
0.00844 |
8 |
| 2028 |
0.01312 |
0.01075 |
0.00946 |
16 |
| 2029 |
0.01576 |
0.01194 |
0.00847 |
29 |
| 2030 |
0.01468 |
0.01385 |
0.01066 |
50 |
| 2031 |
0.01711 |
0.01426 |
0.01355 |
54 |
IV. CHIRP Professional Investment Strategy and Risk Management
CHIRP Investment Methodology
(I) Long-term Holding Strategy
- Suitable for: Investors seeking exposure to the DePIN and IoT sectors with a multi-year horizon
- Operational Recommendations:
- Consider accumulating positions during market corrections when CHIRP trades significantly below historical levels
- Monitor ecosystem development milestones, including miner network expansion and IoT platform adoption metrics
- Utilize Gate Web3 Wallet for secure storage with multi-signature protection enabled
(II) Active Trading Strategy
- Technical Analysis Tools:
- Moving Averages: Track 50-day and 200-day moving averages to identify trend reversals and momentum shifts
- Volume Analysis: Monitor 24-hour trading volume patterns to confirm price movements and detect potential breakouts
- Swing Trading Key Points:
- Establish clear entry and exit thresholds based on support and resistance levels identified through price action analysis
- Implement stop-loss orders to limit downside exposure given CHIRP's observed volatility patterns
CHIRP Risk Management Framework
(I) Asset Allocation Principles
- Conservative Investors: 1-3% of crypto portfolio
- Aggressive Investors: 5-8% of crypto portfolio
- Professional Investors: Up to 10% with active hedging strategies
(II) Risk Hedging Solutions
- Portfolio Diversification: Combine CHIRP exposure with established layer-1 tokens and stablecoins to reduce concentration risk
- Position Sizing: Scale positions based on market capitalization rank and liquidity metrics, avoiding overexposure to lower-ranked assets
(III) Secure Storage Solutions
- Hot Wallet Recommendation: Gate Web3 Wallet for convenient trading access with multi-layer security features
- Cold Storage Solution: Hardware wallet storage for long-term holdings exceeding immediate trading needs
- Security Precautions: Never share private keys or recovery phrases; enable two-factor authentication; verify contract addresses before transactions on the Sui blockchain
V. CHIRP Potential Risks and Challenges
CHIRP Market Risks
- High Volatility: CHIRP has demonstrated significant price fluctuations, with recent 30-day decline of 33.19% and 1-year decline of 88.75%, indicating substantial downside potential
- Limited Liquidity: With a 24-hour trading volume of approximately $117,622 and availability on a limited number of exchanges, large orders may experience significant slippage
- Market Capitalization Risk: Ranked #2524 with a market cap below $1 million, CHIRP carries elevated delisting and sustainability concerns compared to established projects
CHIRP Regulatory Risks
- DePIN Classification Uncertainty: Evolving regulatory frameworks for decentralized physical infrastructure networks may impact operational models and token utility
- Cross-jurisdictional Compliance: IoT device deployments across multiple regions may face varying regulatory requirements affecting network expansion
- Token Security Classification: Potential regulatory scrutiny regarding token distribution mechanisms and rewards structure could influence future operations
CHIRP Technical Risks
- Smart Contract Vulnerabilities: As with all blockchain projects, potential undiscovered bugs in the token contract on Sui could pose security threats
- Network Dependency: CHIRP's infrastructure relies on the Sui blockchain's continued performance, scalability, and security
- Technology Adoption Risk: Success depends on achieving sufficient miner network density and IoT device integration, which remains uncertain in early stages
VI. Conclusion and Action Recommendations
CHIRP Investment Value Assessment
CHIRP represents a speculative investment opportunity in the emerging DePIN and IoT integration sectors built on Sui blockchain infrastructure. The project's dual-component approach combining decentralized connectivity infrastructure with IoT management tools addresses growing demand for blockchain-integrated physical networks. However, investors should carefully weigh the significant price volatility, limited liquidity, and early-stage development risks against potential long-term upside from successful ecosystem expansion. The substantial distance from all-time high prices and limited market capitalization suggest elevated risk profiles suitable only for investors with high risk tolerance.
CHIRP Investment Recommendations
✅ Beginners: Avoid allocation until gaining experience with established cryptocurrencies; if interested in the sector, limit exposure to less than 1% of total portfolio and prioritize educational research
✅ Experienced Investors: Consider small speculative positions not exceeding 3-5% of crypto portfolio, implementing strict stop-loss parameters and monitoring ecosystem development metrics regularly
✅ Institutional Investors: Conduct thorough due diligence on miner network economics, IoT platform traction, and competitive positioning before considering strategic allocation with appropriate hedging mechanisms
CHIRP Trading Participation Methods
- Spot Trading: Purchase CHIRP directly on Gate.com with immediate settlement and withdrawal to secure storage
- Dollar-Cost Averaging: Implement systematic periodic purchases to reduce timing risk and average entry prices over extended periods
- Limit Orders: Utilize limit order functionality on Gate.com to target specific price levels aligned with technical analysis strategies
Cryptocurrency investment carries extreme risk, and this article does not constitute investment advice. Investors should make cautious decisions based on their own risk tolerance and are advised to consult professional financial advisors. Never invest more than you can afford to lose.
FAQ
What is CHIRP token? What are its basic functions and uses?
CHIRP token incentivizes Chirp antenna operators to maintain equipment and support the network. It serves as payment for network usage and governance token in the Chirp ecosystem.
What are the main factors affecting CHIRP price?
CHIRP price is primarily influenced by market sentiment and news, regulatory environment and legal clarity, trading volume, adoption rate, and macroeconomic factors. Cryptocurrency markets are highly sensitive to sentiment shifts and policy changes.
How to predict CHIRP token price? What are the prediction methods?
Predict CHIRP price using technical analysis with moving averages and trend lines, or fundamental analysis by monitoring market trading volume and sentiment. Historical data patterns and on-chain metrics also guide predictions.
What are the risks in CHIRP price prediction and how should I avoid them?
CHIRP price predictions involve market volatility and liquidity risks. Mitigate by diversifying investments, setting stop-loss orders, analyzing market trends carefully, and only investing capital you can afford to lose. Monitor trading volume and adjust strategies based on real-time data.
How are CHIRP's investment prospects compared to similar tokens?
CHIRP demonstrates strong potential with unique tokenomics and growing community adoption. Technical analysis indicates upward momentum, suggesting competitive advantages over similar projects. Long-term growth trajectory appears promising with solid fundamentals supporting future value appreciation.
* The information is not intended to be and does not constitute financial advice or any other recommendation of any sort offered or endorsed by Gate.