2026 CRU Price Prediction: Expert Analysis and Market Forecast for Crust Network Token


Introduction: CRU's Market Position and Investment Value
Crust (CRU), as a decentralized storage network for the Web3 ecosystem, has been developing its infrastructure since its launch in 2020. As of 2026, CRU maintains a market capitalization of approximately $593,097, with a circulating supply of around 26.72 million tokens, and its price is trading at approximately $0.0222. This asset, designed to support IPFS-based storage protocols and provide storage interfaces for application layers, is playing an increasingly important role in the distributed cloud ecosystem that values data privacy and ownership.
This article will comprehensively analyze CRU's price trends from 2026 to 2031, combining historical patterns, market supply and demand dynamics, ecosystem development, and macroeconomic conditions to provide professional price forecasts and practical investment strategies for investors.
I. CRU Price History Review and Market Status
CRU Historical Price Evolution Trajectory
- 2020: Crust Network launched on September 21, 2020, with an initial publish price of $4.3541
- 2021: The token reached its all-time high of $179.24 on April 12, 2021, representing a significant appreciation from its launch price
- 2022-2025: The price experienced a substantial correction following the broader crypto market downturn
- 2026: The token hit its all-time low of $0.02160223 on February 1, 2026, marking a decline of over 99.98% from its peak
CRU Current Market Status
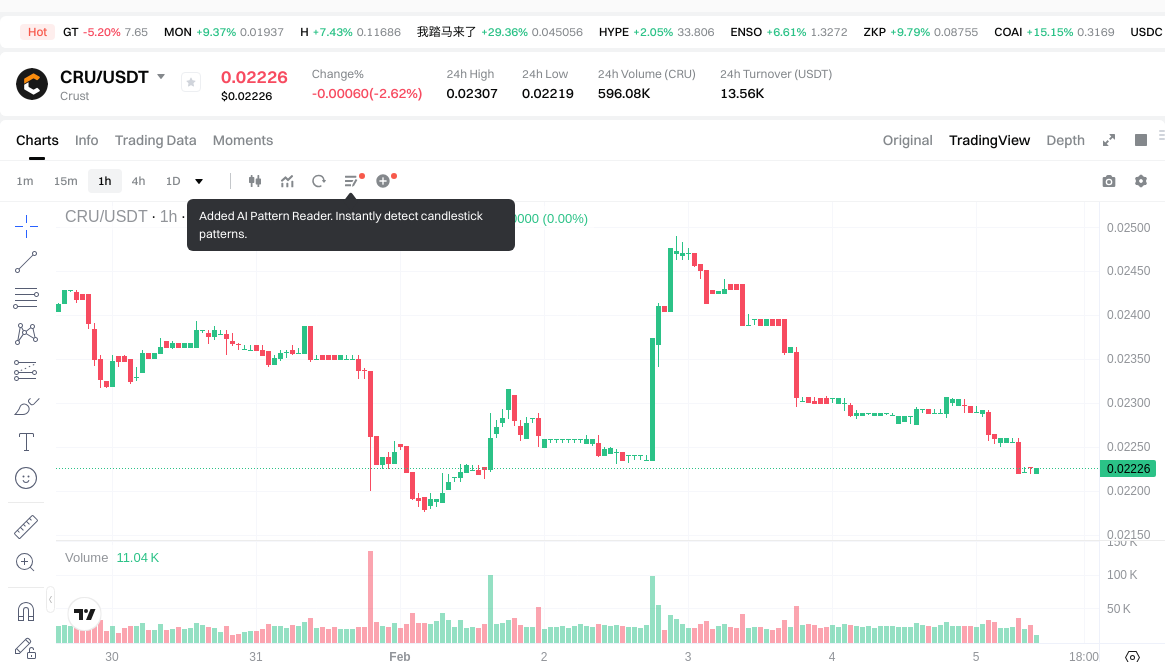
As of February 5, 2026, CRU is trading at $0.0222, showing a slight recovery from its recent all-time low. The token has experienced negative momentum across multiple timeframes, with a 0.27% decrease over the past hour, a 2.97% decline in the last 24 hours, and an 8.53% drop over the past week. The 30-day performance shows a 49.28% decrease, while the one-year performance indicates a 90.85% decline.
The 24-hour trading volume stands at approximately $13,569.99, with the price ranging between $0.02219 (low) and $0.02307 (high) during this period. The current market capitalization is approximately $593,097.14, with a circulating supply of 26,716,087.33 CRU tokens. The total supply is recorded at 35,025,067.04 CRU, while the maximum supply is listed as unlimited. The circulating supply represents approximately 76.28% of the total supply.
CRU currently ranks at position 2905 in the cryptocurrency market, with a market dominance of 0.000030%. The fully diluted market cap equals the current market cap at $777,556.49, suggesting that a portion of the total supply is already in circulation. The token is listed on 2 exchanges and has approximately 7,395 token holders. The current Crypto Fear & Greed Index stands at 12, indicating "Extreme Fear" in the broader cryptocurrency market.
Click to view current CRU market price
CRU Market Sentiment Indicator
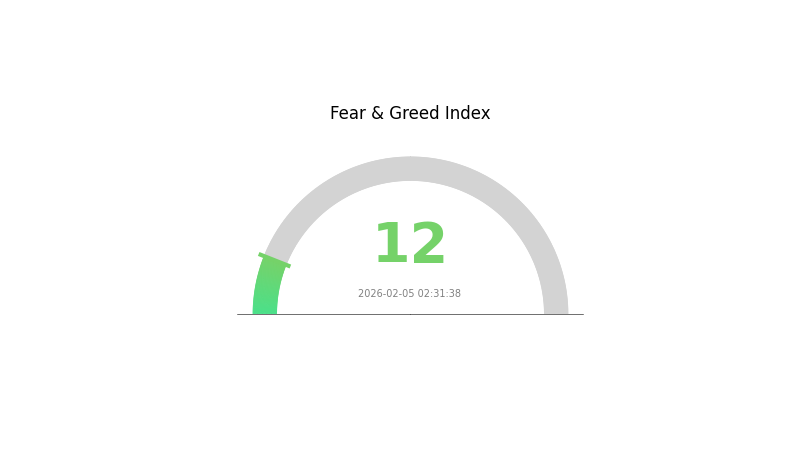
2026-02-05 Fear and Greed Index: 12 (Extreme Fear)
Click to view the current Fear & Greed Index
The crypto market is experiencing extreme fear, with the Fear and Greed Index at 12. This indicates significant market pessimism and risk aversion among investors. Such extreme fear often presents contrarian opportunities, as markets typically recover after panic selling. However, traders should exercise caution and conduct thorough analysis before entering positions. Consider dollar-cost averaging strategies to mitigate downside risks during volatile periods. Monitor key support levels and wait for stabilization signals before making substantial investments.
CRU Token Holding Distribution
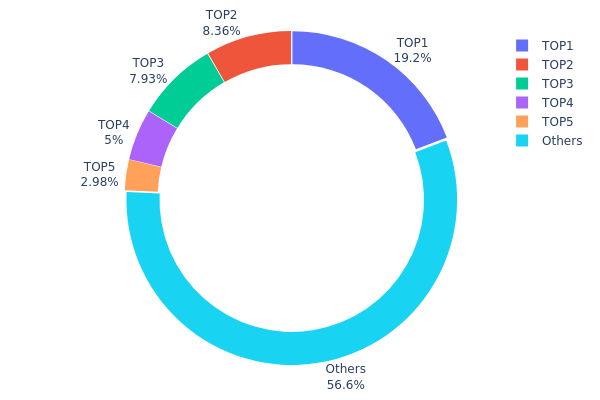
The token holding distribution chart illustrates the allocation of CRU tokens across different wallet addresses, providing critical insights into the degree of decentralization and potential concentration risks within the ecosystem. This metric serves as a fundamental indicator for assessing market structure stability and the susceptibility to price manipulation by large holders.
According to the current data, CRU exhibits a moderate concentration pattern with the top 5 addresses collectively holding 43.4% of the total supply. The largest address controls 3,833.33K tokens (19.16%), followed by the second-largest holder with 1,671.89K tokens (8.35%). Notably, the third position is occupied by a burn address (0x0000...000001) containing 1,585.74K tokens (7.92%), which effectively reduces the circulating supply and indicates a deflationary mechanism within the tokenomics. The remaining top addresses hold between 2.97% and 5.00%, while the "Others" category accounts for 56.6% of the distribution, representing a relatively dispersed holding pattern among smaller participants.
This distribution structure reveals a balanced ecosystem where no single entity exercises dominant control, yet significant influence remains concentrated among major stakeholders. The presence of a substantial burn address demonstrates the project's commitment to long-term value preservation. The 56.6% holding by smaller addresses suggests healthy retail participation and adequate liquidity depth, which contributes to market resilience and reduces the likelihood of coordinated price manipulation. This configuration supports moderate on-chain structural stability while maintaining sufficient decentralization to align with blockchain principles.
Click to view the current CRU Holding Distribution
| Top | Address | Holding Qty | Holding (%) |
|---|---|---|---|
| 1 | 0x6e3d...e40bdd | 3833.33K | 19.16% |
| 2 | 0xb81e...825a38 | 1671.89K | 8.35% |
| 3 | 0x0000...000001 | 1585.74K | 7.92% |
| 4 | 0x1d19...5a2cec | 1000.00K | 5.00% |
| 5 | 0x4695...23351f | 595.81K | 2.97% |
| - | Others | 11313.23K | 56.6% |
II. Core Factors Influencing CRU Future Prices
Supply Mechanism
-
Optical Fiber Preform Production Capacity: As the core raw material in optical fiber and cable manufacturing, the supply status of optical fiber preform is one of the key factors affecting market prices. Since January 2026, optical fiber preform has remained in short supply, directly driving substantial price increases. Global production capacity has approached full utilization, with major Chinese optical fiber manufacturers operating their preform production lines at maximum capacity, while overseas manufacturers maintain capacity utilization rates at 100%.
-
Historical Patterns: The optical fiber and cable industry has experienced cyclical price fluctuations driven by capacity adjustments. Given the extended expansion cycle required for optical fiber preform production capacity, supply constraints tend to support sustained price levels during periods of tight supply.
-
Current Impact: The current supply shortage is difficult to significantly alleviate in the short term, which is expected to support optical fiber and cable prices remaining at elevated levels. The structural adjustment of various optical fiber production capacities in the mid-stream sector has further amplified supply gaps for certain optical fiber types, consequently pushing market prices higher.
Institutional and Major Player Dynamics
-
Institutional Procurement: Major telecommunications operators including China Mobile and China Unicom continue to release procurement demand for optical fiber and cable. China Telecom's procurement expectations for 2026-2027 are warming up, while AI-driven infrastructure construction has stimulated surging demand for new optical fiber types such as G.654.E fiber, hollow-core fiber, and multimode fiber, collectively driving market demand growth.
-
Enterprise Adoption: In overseas markets, technology giants including Meta and Microsoft are accelerating the construction of hyperscale data centers, driven by AI computing power development. Their optical fiber procurement volume has exceeded local operator markets in regions such as North America and Europe.
-
Policy Environment: Large-scale infrastructure projects in regions including Europe, India, and Brazil have been implemented, promoting optical fiber demand growth in these areas. China's data center market is in an active cultivation phase, and once scaled production is achieved, it will significantly drive bulk procurement of optical fiber products.
Macroeconomic Environment
-
Demand Growth Impact: The multi-dimensional explosion of downstream market demand for optical fiber and cable provides strong support for price increases. In the domestic market, telecommunications operators are prioritizing the deployment of new infrastructure including national integrated computing power networks and intelligent computing centers, with G.652.D and G.654.E optical fiber and cable products experiencing rapid demand growth.
-
Industry Transformation: Intelligence, green development, and integration have become core development trends, with the industry's supply and demand structure undergoing deep restructuring. The business model relying solely on low-price procurement and low-price competition has become difficult to sustain, as tight supply-demand balance, product premiumization, and comprehensive competition gradually become the norm.
-
Market Structure: In non-operator markets, driven by AI computing power explosion, data center construction has become a growth pole for demand. The Chinese data center market, once scaled up, is expected to significantly drive bulk procurement of optical fiber products. Market forecasts suggest that optical fiber and cable market demand will continue to be in shortage over the next two years, with an annual gap approaching 100 million core-kilometers.
Technology Development and Ecosystem Construction
-
Product Differentiation: The global optical fiber and cable price structure in 2026 is expected to maintain an overall high-level oscillation pattern, with further intensification of price differentiation among products and regions. Standard optical fiber prices will continue to rise under the combined effects of capacity and market demand factors, while the low-price market conditions before 2025 may be difficult to replicate.
-
High-End Product Premium: Some high-end optical fibers, driven by the dual forces of technological barriers and demand explosion, will continue to enjoy price premiums. Annual increases are expected to reach the 20%-30% range, with some products not only facing tight order backlogs but also requiring advance payments.
-
Application Expansion: The short-term demand for G.657.A optical fiber continues to rise driven by applications such as AI data centers, leading multiple domestic second-tier manufacturers to adjust production capacity allocation among various optical fiber types including G.657.A1, G.657.A2, and G.652.D, resulting in reduced G.652.D optical fiber output. Although some enterprises can quickly restart idle capacity, considering upstream optical fiber preform supply conditions and existing optical fiber order scheduling impacts, the recovery of standard optical fiber production will still require time.
III. 2026-2031 CRU Price Forecast
2026 Outlook
- Conservative forecast: $0.01848 - $0.02226
- Neutral forecast: $0.02226 average price level
- Optimistic forecast: up to $0.02693 (requires favorable market conditions and increased adoption)
2027-2029 Outlook
- Market stage expectation: Potential gradual growth phase with steady accumulation and ecosystem development
- Price range forecast:
- 2027: $0.01992 - $0.03542, representing approximately 10% growth
- 2028: $0.02161 - $0.03721, with a potential 35% increase
- 2029: $0.02521 - $0.04268, showing continued upward momentum with 51% growth potential
- Key catalysts: Network expansion, technological improvements, and broader market recovery could drive price appreciation during this period
2030-2031 Long-term Outlook
- Baseline scenario: $0.03815 average price in 2030, ranging from $0.0351 to $0.05608 (assuming continued ecosystem development and stable market conditions)
- Optimistic scenario: $0.04711 average price in 2031, with a range of $0.03722 to $0.06878 (assuming accelerated adoption and favorable regulatory environment)
- Transformative scenario: prices could potentially reach the upper bounds of forecasted ranges (requires exceptional market conditions, significant protocol upgrades, and widespread industry integration)
- February 5, 2026: CRU price prediction begins with an expected range of $0.01848 - $0.02693 (establishing baseline for multi-year growth trajectory)
| Year | Predicted High Price | Predicted Average Price | Predicted Low Price | Price Change |
|---|---|---|---|---|
| 2026 | 0.02693 | 0.02226 | 0.01848 | 0 |
| 2027 | 0.03542 | 0.0246 | 0.01992 | 10 |
| 2028 | 0.03721 | 0.03001 | 0.02161 | 35 |
| 2029 | 0.04268 | 0.03361 | 0.02521 | 51 |
| 2030 | 0.05608 | 0.03815 | 0.0351 | 71 |
| 2031 | 0.06878 | 0.04711 | 0.03722 | 112 |
IV. CRU Professional Investment Strategies and Risk Management
CRU Investment Methodology
(1) Long-term Holding Strategy
- Target Investors: Investors interested in decentralized storage infrastructure with a long-term vision for Web3 ecosystem development
- Operational Recommendations:
- Consider accumulating positions during market downturns, given CRU's significant decline from historical highs
- Monitor developments in IPFS adoption and decentralized storage demand trends
- Utilize Gate Web3 Wallet for secure storage with multi-signature capabilities
(2) Active Trading Strategy
- Technical Analysis Tools:
- Volume Analysis: Monitor 24-hour trading volume (currently $13,569.99) for liquidity assessment
- Support/Resistance Levels: Track 24-hour range ($0.02219-$0.02307) for entry/exit points
- Swing Trading Considerations:
- Current market volatility shows -2.97% (24H) and -8.53% (7D), suggesting potential short-term opportunities
- Consider risk-reward ratios carefully given the token's 90.85% decline over the past year
CRU Risk Management Framework
(1) Asset Allocation Principles
- Conservative Investors: 1-2% of crypto portfolio allocation
- Aggressive Investors: 3-5% of crypto portfolio allocation
- Professional Investors: May allocate up to 5-8% with active monitoring and hedging strategies
(2) Risk Hedging Solutions
- Portfolio Diversification: Combine CRU with established cryptocurrencies to balance high-risk exposure
- Stop-Loss Implementation: Set protective stop-losses given recent price volatility
(3) Secure Storage Solutions
- Recommended Wallet: Gate Web3 Wallet for integrated trading and secure custody
- Hardware Wallet Option: For long-term holders seeking maximum security
- Security Precautions: Enable two-factor authentication, regularly update security protocols, and never share private keys
V. CRU Potential Risks and Challenges
CRU Market Risks
- Extreme Volatility: CRU has experienced a 90.85% decline over the past year and 49.28% drop in 30 days
- Liquidity Concerns: Relatively low 24-hour trading volume may impact execution of large orders
- Market Cap Position: Ranked #2905 with only 0.000030% market dominance, indicating limited mainstream adoption
CRU Regulatory Risks
- Decentralized Storage Regulations: Evolving regulatory frameworks for decentralized data storage may impact project operations
- Token Classification: Potential regulatory changes regarding utility token classifications across jurisdictions
- Compliance Requirements: Increasing scrutiny on crypto projects may necessitate enhanced compliance measures
CRU Technical Risks
- Network Development: Technical execution risks related to supporting multiple storage protocols and decentralized computing layers
- Competition: Intense competition in the decentralized storage sector from alternative solutions
- Adoption Challenges: Uncertainty regarding mainstream adoption of decentralized storage infrastructure
VI. Conclusion and Action Recommendations
CRU Investment Value Assessment
CRU represents a high-risk investment in decentralized storage infrastructure with significant volatility. While the project's focus on Web3 storage solutions and IPFS integration aligns with emerging trends in data privacy and decentralized cloud ecosystems, the token's substantial price decline (90.85% over one year) and low market positioning (#2905) reflect considerable market challenges. Long-term value proposition depends heavily on increased adoption of decentralized storage solutions and successful technical execution, while short-term risks remain elevated due to market volatility and limited liquidity.
CRU Investment Recommendations
✅ Beginners: Avoid or limit exposure to less than 1% of crypto portfolio until market stabilization and clearer adoption trends emerge ✅ Experienced Investors: Consider small speculative positions (2-3% of crypto allocation) with strict risk management protocols ✅ Institutional Investors: Conduct thorough due diligence on technical roadmap and market dynamics before any allocation decision
CRU Trading Participation Methods
- Spot Trading: Available on Gate.com with CRU trading pairs for direct purchase and sale
- Dollar-Cost Averaging: Systematic accumulation strategy to mitigate timing risk in volatile markets
- Position Management: Implement trailing stops and take-profit levels to manage downside exposure
Cryptocurrency investments carry extremely high risks. This article does not constitute investment advice. Investors should make prudent decisions based on their own risk tolerance and are advised to consult professional financial advisors. Never invest more than you can afford to lose.
FAQ
What is CRU token and what is its purpose?
CRU is the native token of Crust Network, used for staking, paying transaction fees, and purchasing decentralized storage services. It leverages IPFS and blockchain technology to enhance data security and privacy protection in the ecosystem.
What is CRU's historical price trend?
CRU has shown fluctuating price movements over time. Currently trading at $0.0221 USD, the token's historical data reveals varying market dynamics. Detailed price records including opening, high, low, and closing prices across different timeframes are available for analysis, helping traders track performance and identify market patterns for informed decision-making.
What is the CRU price prediction for 2024?
2024 CRU price prediction was not officially released. However, analysis indicates significant copper supply gaps are expected by 2035, which may influence copper prices. Latest data as of February 2026.
What are the main factors affecting CRU price?
CRU price is primarily influenced by global demand, supply dynamics, market competition, economic conditions, and policy changes. China's demand, aluminum and copper market trends, and recycling rates are key drivers.
What are the development prospects and technical advantages of Crust Network project?
Crust Network demonstrates strong development prospects with significant technical advantages in decentralized storage and dynamic gateway management. The latest SManager v2.0.4 upgrade enhances data retrieval success rates, strengthening ecosystem capabilities and market competitiveness.
What are the risks to pay attention to when investing in CRU tokens?
CRU token investments carry market volatility and price fluctuation risks. Investors should understand project fundamentals, assess personal financial capacity, and consider risk tolerance before investing.
Share
Content
Introduction: CRU's Market Position and Investment Value
I. CRU Price History Review and Market Status
II. Core Factors Influencing CRU Future Prices
III. 2026-2031 CRU Price Forecast
IV. CRU Professional Investment Strategies and Risk Management
V. CRU Potential Risks and Challenges
VI. Conclusion and Action Recommendations
FAQ
How to Buy Cryptocurrency


Trending Cryptocurrencies


XZXX: A Comprehensive Guide to the BRC-20 Meme Token in 2025

What Is a Phantom Wallet: A Guide for Solana Users in 2025

Ethereum 2.0 in 2025: Staking, Scalability, and Environmental Impact

2025 Layer-2 Solution: Ethereum Scalability and Web3 Performance Optimization Guide

What is BOOP: Understanding the Web3 Token in 2025

Altcoin Season Index 2025: How to Use and Invest in Web3

4 Crypto Apps Offering Free Money for Sign-Up
What Is EIP-4488?
What is Bitcoin dominance and why does this metric matter

Cryptocurrency Tax Calculation Methods and Recommended Tools

Comprehensive Guide to Recession Preparation