This comprehensive GARI price prediction guide analyzes the social token's market position and future trajectory from 2026 to 2031. GARI, the native token of Chingari's Web3 short-video platform, currently trades at $0.0008415 with extreme market fear sentiment. The article evaluates historical price evolution, supply dynamics, and institutional activity to forecast price ranges: $0.00049-$0.00095 in 2026, with potential growth to $0.00109-$0.00139 by 2031 under optimistic scenarios. Key sections cover macroeconomic impacts, ecosystem development, professional investment strategies, and risk management frameworks. Essential for investors seeking systematic approaches to GARI trading on Gate, featuring dollar-cost averaging tactics and portfolio allocation recommendations across investor profiles.
Introduction: GARI's Market Position and Investment Value
GARI Network (GARI), as a social token designed for short-video content creators, has been serving the Chingari App ecosystem since its launch in 2022. As of 2026, GARI maintains a market capitalization of approximately $555,683, with a circulating supply of around 660.35 million tokens, and the price hovering near $0.0008415. This asset, described as a "blockchain gateway for content creators," is playing an increasingly important role in connecting creators and audiences through decentralized social economies.
This article will comprehensively analyze GARI's price trajectory from 2026 to 2031, combining historical patterns, market supply and demand dynamics, ecosystem development, and macroeconomic conditions to provide investors with professional price forecasts and practical investment strategies.
I. GARI Price History Review and Current Market Status
GARI Historical Price Evolution Trajectory
- 2022: GARI reached its all-time high on February 22, with a price of $0.982499
- 2022-2026: The token experienced a significant correction phase, with price declining over an extended period
- 2026: On February 5, GARI recorded its all-time low at $0.00083063, representing a substantial decline from its historical peak
GARI Current Market Conditions
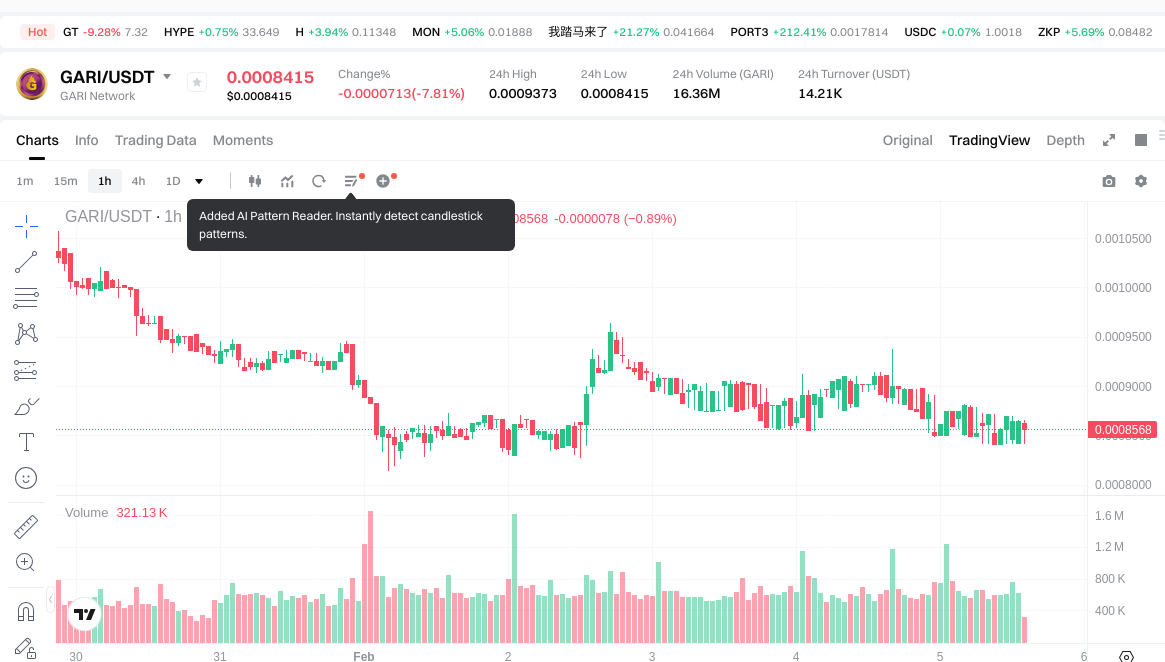
As of February 5, 2026, GARI is trading at $0.0008415, with a 24-hour trading volume of $14,172.34. The token has demonstrated notable volatility across multiple timeframes, with a 1-hour decline of 1.6%, a 24-hour decrease of 6.97%, and a 7-day decline of 15.43%. Over the past 30 days, the price has decreased by 30.97%, while the 1-year performance shows a decline of 90.84%.
The token's market capitalization stands at approximately $555,683.49, with a fully diluted valuation of $839,312.75. GARI's circulating supply is 660,348,764.80 tokens, representing 66.03% of the total supply of 997,400,772.79 tokens, with a maximum supply capped at 1 billion tokens. The current market cap to fully diluted valuation ratio is 66.03%, and the token holds a market dominance of 0.000033%.
The 24-hour price range has fluctuated between a low of $0.0008415 and a high of $0.0009373. GARI is currently ranked #2957 in the cryptocurrency market, with a holder base of 2,843,163 addresses. The token is available for trading on 3 exchanges, including Gate.com.
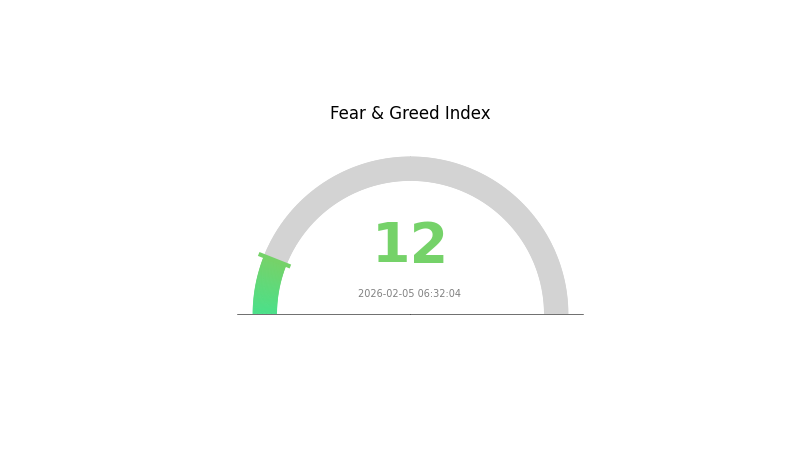
The broader cryptocurrency market sentiment indicator shows an extreme fear reading of 12, reflecting a cautious market environment.
Click to view the current GARI market price
GARI Market Sentiment Index
2026-02-05 Fear and Greed Index: 12 (Extreme Fear)
Click to view the current Fear & Greed Index
The cryptocurrency market is currently experiencing extreme fear, with the Fear and Greed Index standing at just 12. This reading indicates significant market pessimism and risk aversion among investors. Such extreme fear levels often present contrarian buying opportunities for long-term investors, as markets tend to recover from oversold conditions. However, traders should exercise caution and conduct thorough risk assessment before entering positions. This sentiment typically reflects negative news, price declines, or broader economic concerns affecting the crypto ecosystem. Monitor market developments closely for potential reversal signals.
GARI Holdings Distribution
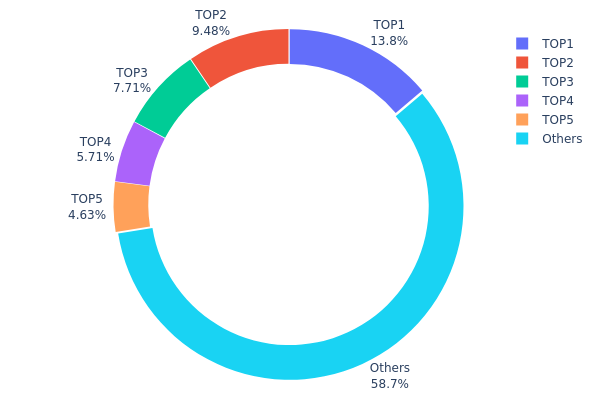
The holdings distribution chart illustrates the allocation of GARI tokens across different wallet addresses, serving as a crucial indicator of decentralization and market structure stability. Based on the current data, GARI exhibits a moderate concentration pattern, with the top five addresses collectively holding 41.31% of the total supply, while the remaining 58.69% is distributed among other addresses.
The largest holder controls approximately 134.22 million GARI tokens (13.80% of total supply), followed by the second and third largest holders with 9.48% and 7.70% respectively. This concentration level suggests a relatively balanced distribution compared to many emerging crypto assets, where top addresses often control over 50% of the supply. The relatively dispersed ownership among the top five addresses, rather than being dominated by a single entity, indicates a healthier market structure that reduces the risk of unilateral market manipulation.
From a market dynamics perspective, this distribution pattern presents both opportunities and risks. The moderate concentration provides sufficient liquidity depth while maintaining reasonable decentralization. However, the combined 41.31% held by top addresses still represents significant potential selling pressure, which could impact price volatility during major market movements. The current structure reflects a maturing on-chain ecosystem with improving decentralization characteristics, though continued monitoring of large holder behavior remains essential for understanding potential market shifts.
Click to view current GARI Holdings Distribution
| Top |
Address |
Holding Qty |
Holding (%) |
| 1 |
6GGQLF...WftN6r |
134221.37K |
13.80% |
| 2 |
E2RvJg...qnatYy |
92197.17K |
9.48% |
| 3 |
EFE3j1...o4ewqR |
74932.90K |
7.70% |
| 4 |
u6PJ8D...ynXq2w |
55573.21K |
5.71% |
| 5 |
AGVhmr...gHAk8N |
45000.00K |
4.62% |
| - |
Others |
570504.28K |
58.69% |
II. Core Factors Influencing GARI's Future Price
Supply Mechanism
The supply dynamics of GARI remain a fundamental factor in its price formation. The token's distribution and circulation patterns directly affect market liquidity and price stability. Changes in token unlock schedules, staking mechanisms, or burn rates could potentially alter the supply-demand equilibrium and influence price trajectories.
Institutional and Major Holder Activity
Institutional participation and large holder behavior play significant roles in GARI's price movement. The accumulation or distribution patterns of major addresses can signal market sentiment shifts. Additionally, any strategic partnerships or adoption by Web3 platforms could enhance GARI's utility and market perception, potentially driving demand.
Macroeconomic Environment
- Monetary Policy Impact: Global monetary policy decisions, particularly from major central banks, affect risk appetite in cryptocurrency markets. Tightening monetary conditions typically lead to reduced liquidity in crypto assets, while accommodative policies may support price growth.
- Inflation Hedge Characteristics: During periods of elevated inflation, cryptocurrencies may attract investors seeking alternative stores of value, though this relationship varies across different market cycles.
- Geopolitical Factors: International tensions and regulatory developments in key markets can create volatility and influence investor sentiment toward digital assets.
Technological Development and Ecosystem Building
- Decentralized Platform Evolution: GARI's core design focuses on empowering creators through a decentralized platform. Continued improvements to platform functionality, user experience, and creator tools could enhance adoption and drive network effects.
- Community Support and Engagement: The strength of GARI's community remains crucial for its long-term sustainability. Active community participation in governance, content creation, and ecosystem development contributes to the platform's value proposition.
- Ecosystem Applications: The development and adoption of decentralized applications within the GARI ecosystem could expand use cases and utility, potentially supporting price appreciation through increased network activity and token demand.
III. 2026-2031 GARI Price Forecast
2026 Outlook
- Conservative forecast: $0.00049 - $0.00086
- Neutral forecast: $0.00086 average price level
- Optimistic forecast: $0.00095 (requires favorable market conditions and increased adoption)
2027-2029 Outlook
- Market stage expectation: Gradual growth phase with moderate volatility
- Price range forecast:
- 2027: $0.00071 - $0.00099
- 2028: $0.00091 - $0.0012
- 2029: $0.00082 - $0.00127
- Key catalysts: Platform ecosystem development, user base expansion, and broader crypto market sentiment
2030-2031 Long-term Outlook
- Baseline scenario: $0.00063 - $0.00134 (assuming steady market development)
- Optimistic scenario: $0.00109 - $0.00139 (assuming accelerated adoption and positive regulatory environment)
- Transformative scenario: Potential to reach upper price ranges (contingent upon breakthrough partnerships and significant platform innovations)
- 2026-02-05: GARI trading within early-year price discovery phase
| Year |
Predicted High Price |
Predicted Average Price |
Predicted Low Price |
Price Change |
| 2026 |
0.00095 |
0.00086 |
0.00049 |
1 |
| 2027 |
0.00099 |
0.0009 |
0.00071 |
7 |
| 2028 |
0.0012 |
0.00095 |
0.00091 |
12 |
| 2029 |
0.00127 |
0.00107 |
0.00082 |
27 |
| 2030 |
0.00134 |
0.00117 |
0.00063 |
38 |
| 2031 |
0.00139 |
0.00126 |
0.00109 |
49 |
IV. GARI Professional Investment Strategy and Risk Management
GARI Investment Methodology
(I) Long-term Holding Strategy
- Suitable for: Investors who believe in the creator economy and blockchain-based social platforms
- Operational Recommendations:
- Consider accumulating positions during market corrections to achieve a lower average cost
- Monitor Chingari app user growth and platform engagement metrics as key indicators
- Utilize secure storage solutions such as Gate Web3 Wallet for asset custody
(II) Active Trading Strategy
- Technical Analysis Tools:
- Moving Averages: Track 50-day and 200-day moving averages to identify potential trend reversals
- Volume Analysis: Monitor trading volume changes to confirm price movements and identify accumulation or distribution phases
- Swing Trading Key Points:
- Set clear entry and exit points based on support and resistance levels
- Implement stop-loss orders to limit potential downside risk
GARI Risk Management Framework
(I) Asset Allocation Principles
- Conservative Investors: 1-2% of crypto portfolio
- Aggressive Investors: 3-5% of crypto portfolio
- Professional Investors: 5-8% of crypto portfolio with active monitoring
(II) Risk Hedging Solutions
- Diversification: Combine GARI with other creator economy tokens and mainstream cryptocurrencies
- Position Sizing: Avoid overconcentration in a single asset, especially given GARI's volatility profile
(III) Secure Storage Solutions
- Software Wallet Recommendation: Gate Web3 Wallet provides convenient access for active traders
- Hardware Wallet Solution: For long-term holdings, consider transferring assets to cold storage devices
- Security Considerations: Enable two-factor authentication, never share private keys, and be cautious of phishing attempts
V. GARI Potential Risks and Challenges
GARI Market Risks
- High Volatility: GARI has experienced significant price fluctuations, with a 90.84% decline over the past year
- Limited Liquidity: With a 24-hour trading volume of approximately $14,172, liquidity constraints may impact execution during volatile periods
- Market Cap Concentration: The relatively small market cap of approximately $555,683 suggests susceptibility to price manipulation
GARI Regulatory Risks
- Jurisdictional Uncertainty: Regulatory frameworks for creator tokens and social platforms vary across regions
- Compliance Evolution: Changes in cryptocurrency regulations, particularly in major markets, could impact GARI's utility and adoption
- Platform Regulatory Risk: Regulatory actions affecting the Chingari app could indirectly impact GARI token value
GARI Technical Risks
- Smart Contract Vulnerability: Potential security flaws in token contracts could expose holders to exploitation risks
- Network Dependency: GARI operates on multiple chains including Solana and Aptos, introducing cross-chain complexity
- Platform Integration Risk: Technical issues with Chingari app integration could affect token utility and user adoption
VI. Conclusion and Action Recommendations
GARI Investment Value Assessment
GARI represents an innovative approach to the creator economy by providing blockchain-based incentives for content creators on the Chingari platform. The token's long-term value proposition depends on the platform's user growth and adoption of blockchain features. However, significant short-term risks include high price volatility, limited liquidity, and the token's substantial decline from its historical high. Investors should carefully weigh the potential of the creator economy narrative against the current market challenges.
GARI Investment Recommendations
✅ Beginners: Consider allocating only a minimal portion of your portfolio to GARI after thoroughly understanding the project and associated risks
✅ Experienced Investors: Monitor platform metrics and trading volume trends; consider strategic accumulation if fundamentals improve
✅ Institutional Investors: Conduct comprehensive due diligence on platform partnerships and user engagement before considering larger allocations
GARI Trading Participation Methods
- Spot Trading: Purchase GARI directly on Gate.com and other supporting exchanges
- Dollar-Cost Averaging: Implement systematic purchases to reduce timing risk and average entry costs
- Risk-Adjusted Approach: Start with small positions and gradually increase exposure as you gain confidence in the project's trajectory
Cryptocurrency investment carries extremely high risks, and this article does not constitute investment advice. Investors should make prudent decisions based on their own risk tolerance and are advised to consult professional financial advisors. Never invest more than you can afford to lose.
FAQ
What is GARI token and what are its use cases and applications?
GARI is the native token of Chingari, a Web3 short-video social platform. It rewards content creators and users for their contributions. GARI enables access to platform privileges, premium features, and incentivizes community participation in the social ecosystem.
What are the main factors affecting GARI price?
GARI price is primarily influenced by market sentiment, trading volume, regulatory news, and overall crypto market conditions. Network adoption, technology updates, and macroeconomic factors also play significant roles in price movements.
How to predict and analyze the future price of GARI?
GARI price prediction relies on tokenomics, supply dynamics, adoption trends, and broader crypto market sentiment. Analysts use technical and fundamental analysis to forecast potential price movements based on market data and historical performance.
What are the advantages and disadvantages of GARI compared to other cryptocurrencies?
GARI's advantages include deep integration with Chingari platform and user asset control. Disadvantages include lower market recognition and limited liquidity compared to major cryptocurrencies, requiring time to build ecosystem adoption.
What is GARI's historical price trend? What are the recent important market dynamics?
GARI has traded between $0.000837 and $0.000846 in the last 24 hours. Current market capitalization stands at approximately $54,000. Recent market dynamics show GARI price declining, reflecting broader market sentiment adjustments in the micro-cap token segment.
What are the risks to consider when investing in GARI?
GARI investment involves market volatility, regulatory uncertainty, and technology risks. Consider your risk tolerance, financial situation, and investment goals carefully. Past performance doesn't guarantee future results. Consult financial advisors before investing.
* The information is not intended to be and does not constitute financial advice or any other recommendation of any sort offered or endorsed by Gate.