This comprehensive analysis examines GOZ (Göztepe S.K. Fan Token) price dynamics from 2026 to 2031, providing investors with professional forecasts and strategic guidance. The article evaluates GOZ's current market position at $0.1459 with a $607,527 market cap, reviews historical performance patterns since its 2021 launch, and analyzes core factors including supply mechanics, institutional dynamics, and macroeconomic conditions. Price predictions range from conservative estimates of $0.12264 to optimistic scenarios approaching $0.30639 by 2031, supported by ecosystem development and institutional adoption. The article details investment strategies for different investor profiles, establishes a comprehensive risk management framework addressing liquidity constraints and regulatory uncertainties, and provides actionable recommendations for trading GOZ on Gate. While highlighting substantial opportunities within the sports fan token sector, the analysis emphasizes that cryptocurrency investments carry extreme r
Introduction: GOZ's Market Position and Investment Value
Göztepe S.K. Fan Token (GOZ), as a blockchain-based fan engagement and rewards token, has been facilitating fan participation since its launch in 2021. As of 2026, GOZ maintains a market capitalization of approximately $607,527, with a circulating supply of around 4.164 million tokens, and the price stands at approximately $0.1459. This fan token asset, developed through collaboration between Turkish football club Göztepe and Chiliz on the Socios.com platform, is playing an increasingly important role in sports fan engagement and blockchain-powered community governance.
This article will comprehensively analyze GOZ's price trajectory from 2026 to 2031, combining historical patterns, market supply and demand dynamics, ecosystem development, and macroeconomic environment factors to provide investors with professional price predictions and practical investment strategies.
I. GOZ Price History Review and Market Status
GOZ Historical Price Evolution Trajectory
- 2021: The token was launched on May 13, 2021, with an initial price of $2.1783, marking the beginning of its trading journey on the Socios.com platform
- 2022: On March 22, 2022, GOZ reached its all-time high of $5.93, representing a significant milestone in the token's price performance
- 2025: The token experienced considerable volatility, reaching its all-time low of $0.118724 on December 19, 2025, reflecting a substantial decline from its peak
GOZ Current Market Status
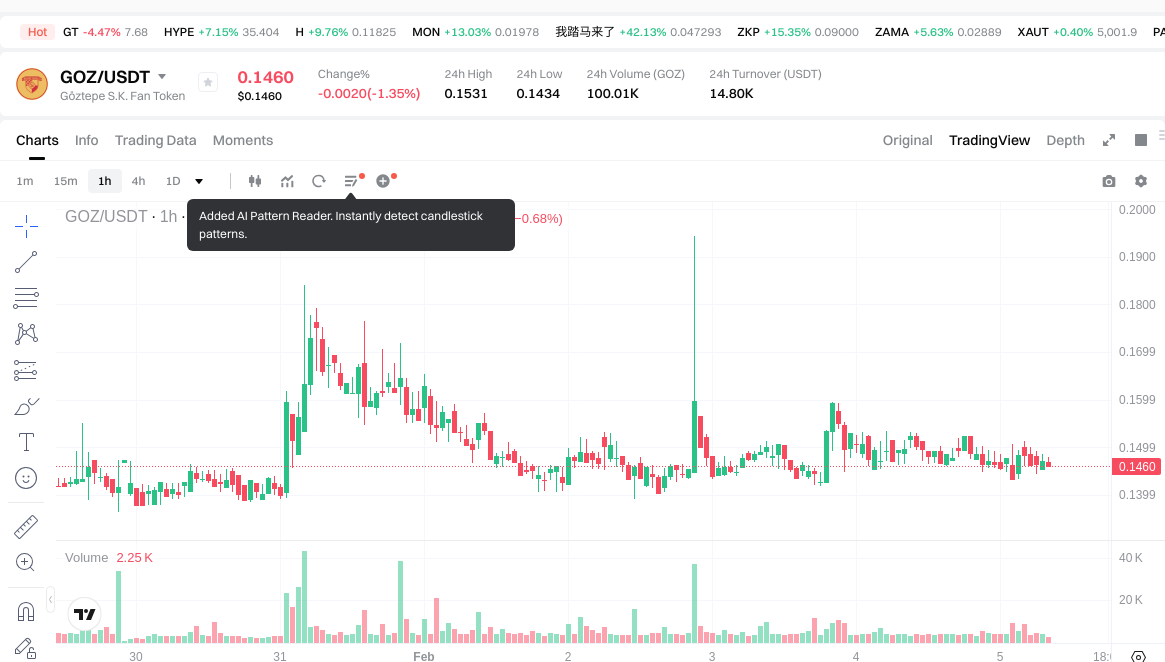
As of February 5, 2026, GOZ is trading at $0.1459, showing a slight decrease of 0.33% over the past 24 hours. The token has demonstrated mixed short-term performance, with a 1-hour decline of 0.27% but a 7-day gain of 1.51%. Over the past 30 days, GOZ has experienced a notable increase of 10.89%, suggesting some recovery momentum in recent weeks.
The trading volume over the past 24 hours stands at $14,785.70, with the price fluctuating between a 24-hour high of $0.1531 and a low of $0.1434. The token's market capitalization is approximately $607,527.60, with a circulating supply of 4,164,000 GOZ tokens out of a maximum supply of 7,000,000 tokens, representing a circulation ratio of approximately 59.49%.
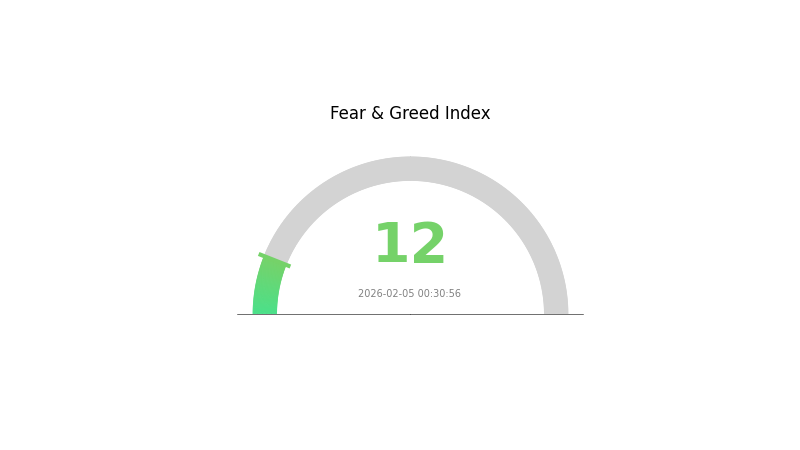
The fully diluted market cap is calculated at $1,021,300.00, and the token maintains a market dominance of 0.000039%. GOZ is currently ranked at position 2881 in the overall cryptocurrency market. The current market sentiment index indicates extreme fear at a level of 12, reflecting cautious investor attitudes in the broader crypto market environment.
Click to view the current GOZ market price
GOZ Market Sentiment Index
2026-02-05 Fear and Greed Index: 12 (Extreme Fear)
Click to view current Fear & Greed Index
The cryptocurrency market is currently experiencing extreme fear with an index reading of 12. This exceptionally low sentiment level indicates heightened investor anxiety and pessimism across the market. During such periods, risk-averse traders typically reduce positions while contrarian investors may identify potential buying opportunities. Market participants should exercise caution and conduct thorough risk assessments before making trading decisions.
GOZ 持仓分布
The address holding distribution chart illustrates the concentration of GOZ tokens across different wallet addresses, providing critical insights into the token's ownership structure and potential market dynamics. This metric serves as a key indicator of decentralization levels and can reveal whether the token is susceptible to price manipulation or controlled by a limited number of entities.
Based on the current distribution data, GOZ exhibits a relatively concentrated holding pattern among top addresses. The degree of concentration directly impacts market liquidity and price stability. When a significant portion of total supply is held by a small number of addresses, it creates potential risks including reduced trading depth, increased volatility during large transactions, and vulnerability to coordinated selling pressure. Conversely, a more dispersed distribution typically indicates healthier market participation and stronger resistance to single-entity influence.
The current holding structure reflects certain characteristics regarding GOZ's on-chain ecosystem maturity. The proportion held by top addresses compared to the broader distribution provides valuable context for assessing whether the token has achieved sufficient circulation among retail participants and institutional holders. This distribution pattern also influences the token's ability to maintain price stability during market stress periods and affects the overall trust level among potential investors evaluating entry positions.
Click to view current GOZ Holdings Distribution

| Top |
Address |
Holding Qty |
Holding (%) |
II. Core Factors Influencing GOZ's Future Price
Supply Mechanism
-
Global Commodity Price Dynamics: GOZ's price trajectory is significantly influenced by international commodity market movements. Historical patterns indicate that major commodities have maintained elevated price levels entering 2022, with ongoing concerns about sustained high prices. In 2024-2025, global commodity markets experienced divergent trends, particularly in energy and agricultural sectors. Oil markets witnessed substantial rebounds driven by geopolitical tensions, with Brent crude and WTI futures showing week-on-week increases of 2.52-2.58% despite year-on-year declines of 10-12%. These fluctuations reflect supply disruption concerns stemming from international sanctions and geopolitical risks.
-
Historical Patterns: Commodity price volatility has consistently impacted related assets. During the 2022 period, elevated commodity prices generated multiple concerns about future market directions. The current environment shows continued uncertainty, with analysis suggesting short-term commodity prices may maintain volatile upward trajectories. Agricultural commodities demonstrated differentiated movements, with soybeans showing robust performance (up 7.06% week-on-week) driven by improved US-China trade expectations, while corn markets faced pressure from record US production estimates.
-
Current Impact: Present supply dynamics are shaped by multiple factors including production capacity, international trade policies, and regional supply chain conditions. Energy markets face particular pressure from geopolitical developments, with sanctions on major oil producers creating potential supply gaps that could reach 1.5 million barrels per day. This supply-side tightening provides upward price support, though offset by concerns about global economic growth deceleration and strong US dollar headwinds.
Institutional and Major Holder Dynamics
-
Institutional Holdings: Major institutional positioning reflects strategic responses to global economic uncertainties and policy expectations. Chinese enterprises and financial institutions have demonstrated adaptive strategies in international markets, particularly in emerging economies. Export data reveals that China's intermediate goods exports to emerging markets like Vietnam and Mexico have grown rapidly, with annual compound growth rates of 12% and 16% respectively from 2017-2023, indicating deepening supply chain integration.
-
Corporate Adoption: Chinese enterprises have accelerated overseas expansion across manufacturing, energy, mining, agriculture, infrastructure, and digital technology sectors. In Brazil's market specifically, Chinese investments span traditional resources, green energy, and high-tech manufacturing. The business presence extends to trade facilitation needs, with bilateral trade reaching $188.214 billion in 2024, up 3.57% year-on-year. Major state-owned enterprises constitute the investment backbone, with business activities requiring sophisticated foreign exchange risk management.
-
National Policies: Government-level policies continue shaping market fundamentals through fiscal, monetary, and trade measures. China's 2025 fiscal policy adopts a more proactive stance, with deficit rate increasing to approximately 4%, representing a 1 percentage point increase. The policy framework emphasizes supporting domestic demand expansion, developing new productive forces, and promoting urban-rural coordination. International cooperation frameworks, including Belt and Road Initiative alignment with partner countries' development strategies, create institutional support for cross-border economic activities.
Macroeconomic Environment
-
Monetary Policy Impact: Major central banks' policy trajectories significantly influence market conditions. The US Federal Reserve's approach to inflation management remains crucial, with December 2024 core CPI data showing moderation (3.2% year-on-year versus 3.3% expected), providing room for potential rate cuts. Analysis suggests the Fed may implement two rate reductions in the first half of 2025, though January likely sees a pause. Brazil's central bank maintains a tightening stance, with benchmark rates reaching 15% to address inflation exceeding target ranges (4.7% versus 4.5% ceiling), creating interest rate differentials exceeding 10 percentage points with major economies.
-
Inflation Hedge Attributes: Asset performance under inflationary conditions varies by category. While precious metals like gold traditionally serve as inflation hedges, recent market dynamics show complex interactions. Gold experienced sharp corrections in late 2024 despite year-on-year gains exceeding 44%, reflecting profit-taking after nine consecutive weekly gains and reaching $4,381/ounce historic highs. The pullback stemmed from geopolitical risk easing, improved risk appetite, and strong US dollar pressure. However, fundamental demand remained robust, with Q3 global gold investment demand surging 47% and Chinese investors purchasing 74 tons of gold bars and coins.
-
Geopolitical Factors: International situation developments create market volatility and risk premiums. Escalating tensions in specific regions drove oil price rebounds, with US sanctions on major Russian oil companies triggering supply disruption fears and supporting energy prices. Simultaneously, easing signals in certain conflict zones reduced safe-haven demand for traditional defensive assets. US-China trade relationship dynamics particularly impact commodity flows, with market expectations for trade agreement announcements supporting agricultural product prices, especially soybeans. Trade policy uncertainties, including potential tariff measures, add complexity to price formation.
Technology Development and Ecosystem Building
-
Cross-Border Payment Infrastructure: Financial technology advancements facilitate international transactions and risk management. Development of direct currency exchange mechanisms, such as initiatives for RMB-Brazilian Real trading, aims to reduce transaction costs and third-party currency dependencies. Chinese commercial banks have established foreign exchange derivative products including non-deliverable forwards (NDF) and cross-border settlement services to support enterprises managing currency volatility. These infrastructure improvements enhance market efficiency and accessibility.
-
Digital Economy Integration: Technology sector innovations reshape competitive landscapes and value creation patterns. Chinese technology companies demonstrate rapid advancement in artificial intelligence, semiconductor design, and production equipment. The emergence of cost-effective, high-performance AI models accelerates application penetration across industries including autonomous driving, robotics, and cloud computing. This technological progress triggers reassessment of competitive positioning and valuation frameworks, with implications for broader asset pricing.
-
Ecosystem Applications: Industrial ecosystem development supports fundamental value growth. Chinese enterprises' global expansion in high-value-added sectors creates demand for supporting services and infrastructure. Manufacturing sector investments emphasize intelligent transformation and green transition, supported by policy measures including equipment upgrade subsidies and technical renovation programs. Emerging industries such as commercial aerospace and low-altitude economy receive development support, while traditional sectors undergo modernization through AI-enabled transformation. These ecosystem activities generate sustained economic activity and productivity improvements.
III. 2026-2031 GOZ Price Forecast
2026 Outlook
- Conservative Prediction: $0.12264 - $0.146
- Neutral Prediction: $0.146
- Optimistic Prediction: $0.18542 (subject to favorable market conditions and increased adoption)
2027-2029 Mid-term Outlook
- Market Stage Expectation: The token may enter a gradual growth phase as the project matures and expands its ecosystem, with potential volatility reflecting broader crypto market cycles
- Price Range Predictions:
- 2027: $0.12428 - $0.21377 (approximately 13% average growth)
- 2028: $0.11384 - $0.22769 (approximately 30% average growth)
- 2029: $0.13566 - $0.26506 (approximately 43% average growth)
- Key Catalysts: Sustained ecosystem development, partnership expansions, and potential technological upgrades could serve as primary drivers for price appreciation during this period
2030-2031 Long-term Outlook
- Baseline Scenario: $0.18003 - $0.29137 (assuming steady project development and market stability)
- Optimistic Scenario: $0.23689 - $0.30639 (contingent on accelerated adoption and favorable regulatory environment)
- Transformative Scenario: Approaching $0.30639 with sustained growth through 2031 (requiring exceptional market conditions, breakthrough partnerships, and widespread institutional adoption)
- 2026-02-05: GOZ trading within its projected annual range ($0.12264 - $0.18542)
Note: These projections represent potential price scenarios based on historical data patterns and should not be considered financial advice. Cryptocurrency markets remain highly volatile and subject to numerous unpredictable factors.
| Year |
Predicted High Price |
Predicted Average Price |
Predicted Low Price |
Price Change |
| 2026 |
0.18542 |
0.146 |
0.12264 |
0 |
| 2027 |
0.21377 |
0.16571 |
0.12428 |
13 |
| 2028 |
0.22769 |
0.18974 |
0.11384 |
30 |
| 2029 |
0.26506 |
0.20871 |
0.13566 |
43 |
| 2030 |
0.29137 |
0.23689 |
0.18003 |
62 |
| 2031 |
0.30639 |
0.26413 |
0.2113 |
81 |
IV. GOZ Professional Investment Strategies and Risk Management
GOZ Investment Methodology
(I) Long-term Holding Strategy
- Target Audience: Fan token enthusiasts and Göztepe S.K. supporters who believe in the long-term value of blockchain-based fan engagement platforms
- Operational Recommendations:
- Consider accumulating GOZ tokens during market corrections when trading below historical averages
- Monitor the development of Socios.com platform and Göztepe S.K. club performance to assess long-term utility value
- Storage Solution: Utilize Gate Web3 Wallet for secure storage with multi-signature protection and regular backup of recovery phrases
(II) Active Trading Strategy
- Technical Analysis Tools:
- Volume Analysis: Monitor 24-hour trading volume fluctuations (current daily volume around $14,785) to identify potential breakout or breakdown patterns
- Support and Resistance Levels: Track key price levels including the recent low at $0.1434 and high at $0.1531 within the 24-hour period
- Swing Trading Key Points:
- Consider the token's relatively low liquidity (trading on 2 exchanges) which may result in higher volatility and slippage
- Pay attention to seasonal factors related to football club performance and fan engagement cycles
GOZ Risk Management Framework
(I) Asset Allocation Principles
- Conservative Investors: 1-2% of crypto portfolio allocation
- Aggressive Investors: 3-5% of crypto portfolio allocation
- Professional Investors: May allocate up to 5-8% depending on sport fan token sector exposure strategy
(II) Risk Hedging Solutions
- Diversification Strategy: Combine GOZ with other established cryptocurrencies to reduce sector-specific risk exposure
- Stop-Loss Implementation: Set stop-loss orders at 10-15% below entry price to limit potential downside
(III) Secure Storage Solutions
- Hot Wallet Recommendation: Gate Web3 Wallet offers convenient access for active traders with enhanced security features
- Cold Storage Solution: For long-term holders, consider transferring significant holdings to hardware wallets after accumulation
- Security Precautions: Never share private keys, enable two-factor authentication, and verify contract addresses (0x0E469D1C78421C7952E4D9626800DAd22F45361D on Chiliz Chain) before transactions
V. GOZ Potential Risks and Challenges
GOZ Market Risks
- Low Liquidity Risk: With trading availability on only 2 exchanges and daily volume of approximately $14,785, the token faces significant liquidity constraints that may impact execution prices
- High Volatility: The token has experienced substantial price fluctuations, with current price at $0.1459 representing a decline of approximately 56.28% over the past year
- Limited Market Depth: The circulating supply of 4,164,000 tokens (59.49% of maximum supply) may result in sharp price movements during large transactions
GOZ Regulatory Risks
- Fan Token Classification Uncertainty: Regulatory frameworks for fan tokens remain evolving across different jurisdictions, potentially affecting token utility and trading accessibility
- Sports Industry Regulations: Changes in sports governance policies regarding fan engagement and tokenization could impact the token's use cases
- Cross-border Compliance: International nature of fan bases may subject the token to multiple regulatory regimes with varying compliance requirements
GOZ Technical Risks
- Platform Dependency: Token utility is primarily tied to Socios.com platform functionality and continued partnership with Göztepe S.K. club
- Smart Contract Risks: Despite deployment on Chiliz Chain, potential vulnerabilities in smart contract code could pose security concerns
- Network Performance: Token functionality depends on the stability and performance of the underlying Chiliz blockchain infrastructure
VI. Conclusion and Action Recommendations
GOZ Investment Value Assessment
GOZ represents a niche investment opportunity within the sports fan token sector, offering utility through fan engagement and voting rights on Göztepe S.K. club decisions. The token's long-term value proposition is tied to the growth of blockchain-based fan engagement platforms and the club's performance. However, investors should carefully consider the substantial short-term risks, including high price volatility (56.28% decline over one year), limited liquidity, and the relatively small market capitalization of approximately $607,527. The token's utility-driven model provides some fundamental support, but market dynamics remain highly speculative.
GOZ Investment Recommendations
✅ Beginners: Start with minimal allocation (not exceeding 1% of total crypto portfolio) to understand fan token mechanics and platform functionality before increasing exposure
✅ Experienced Investors: Consider position sizing between 2-3% of crypto portfolio with clear entry and exit strategies, monitoring both technical indicators and club-related developments
✅ Institutional Investors: Evaluate GOZ as part of a broader sports fan token sector allocation strategy, considering liquidity constraints and conducting thorough due diligence on platform partnerships
GOZ Trading Participation Methods
- Spot Trading: Purchase GOZ directly on Gate.com with various trading pairs, suitable for both short-term trading and long-term accumulation
- Platform Engagement: Acquire tokens to participate in Socios.com ecosystem activities and exercise voting rights on club decisions
- Dollar-Cost Averaging: Implement systematic purchasing strategy to mitigate timing risk in volatile market conditions
Cryptocurrency investment carries extremely high risks, and this article does not constitute investment advice. Investors should make prudent decisions based on their own risk tolerance and are advised to consult professional financial advisors. Never invest more than you can afford to lose.
FAQ
What is GOZ? What are its practical application scenarios?
GOZ is a Go language library designed for efficient HTTP requests. It supports RESTful API calls, web scraping, and microservice communication, providing developers with streamlined solutions for modern application development.
How to analyze GOZ's historical price trends? What technical indicators can be referenced?
Analyze GOZ's historical price trends using moving averages(MA)to identify long-term direction and RSI to spot overbought/oversold conditions. Combine MACD for momentum signals and Bollinger Bands for volatility assessment. Cross-reference multiple indicators with trading volume data for comprehensive analysis.
What are the main factors affecting GOZ price fluctuations?
GOZ price fluctuations are primarily driven by market sentiment, trading volume, token utility adoption, macroeconomic conditions, and regulatory developments. Increased institutional interest and positive ecosystem announcements typically push prices higher, while market corrections and negative news tend to trigger downward pressure on valuations.
What are the 2024 GOZ price predictions? How do professional institutions view it?
For 2024, GOZ price predictions suggest stable market conditions with slight increases driven by economic growth. Professional institutions expect moderate upward movement supported by international trade expansion and favorable investment policies.
What risks should I pay attention to when investing in GOZ for price prediction trading?
GOZ price prediction trading involves market volatility risk, liquidity risk, and potential losses. Price fluctuations can be significant, and market instability may result in substantial losses. Trade carefully and manage your position size.
GOZ与其他同类代币相比有什么优势和劣势?
GOZ focuses on decentralized governance with lower transaction fees, offering advantages over established competitors. However, it faces challenges from tokens with larger ecosystems and higher liquidity. Its unique positioning provides growth potential despite limited mainstream adoption compared to market leaders.
* The information is not intended to be and does not constitute financial advice or any other recommendation of any sort offered or endorsed by Gate.