This comprehensive analysis examines Housecoin (HOUSE) price dynamics and investment opportunities through 2031. The article reviews HOUSE's market position, currently trading at $0.0007894 with extreme market fear conditions, and analyzes core valuation drivers including real estate-linked narratives, supply mechanisms, and macroeconomic factors. It projects price ranges from $0.00054-$0.00086 in 2026, gradually appreciating to $0.00118-$0.00232 by 2031 under favorable conditions. The guide provides tailored investment strategies for different investor profiles on Gate platform, emphasizing strict risk management given HOUSE's meme token volatility. Essential risk factors include extreme volatility, limited liquidity, and regulatory uncertainty. This resource equips investors with professional forecasts and actionable strategies for navigating this emerging digital asset's potential.
Introduction: HOUSE's Market Position and Investment Value
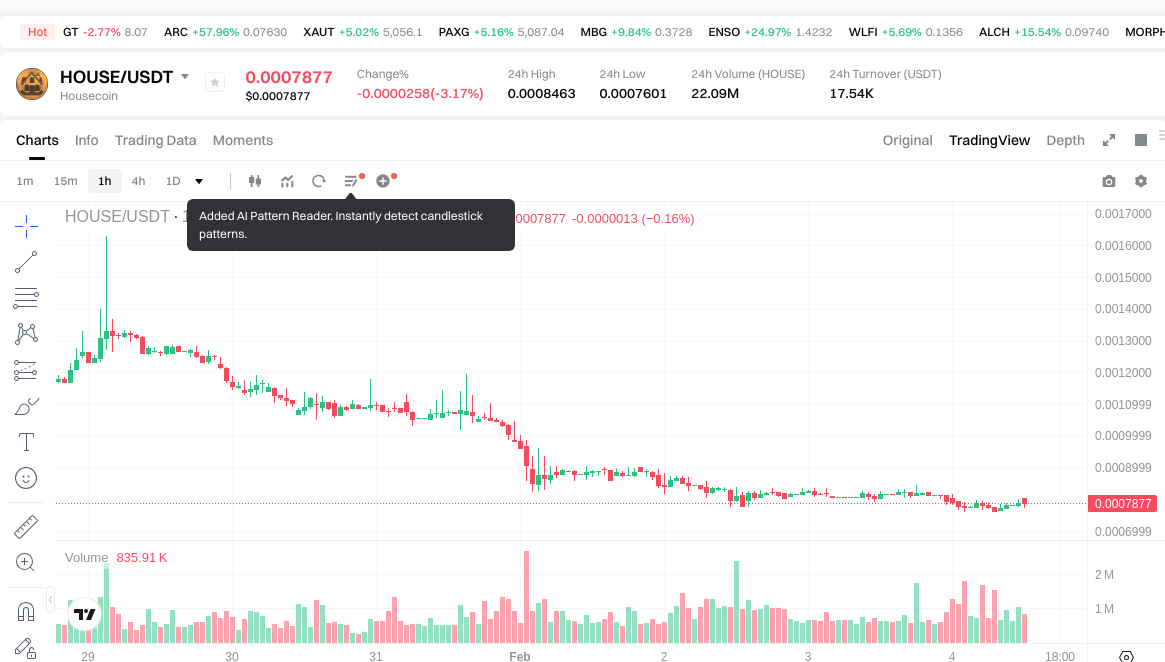
Housecoin (HOUSE), positioned as a meme cryptocurrency themed on hedging the real estate market with the ambitious concept that 1 HOUSE token will be worth 1 house, has emerged as a distinctive digital asset since its launch in 2025. As of February 4, 2026, HOUSE maintains a market capitalization of approximately $788,421, with a circulating supply of around 998.76 million tokens, and trades at roughly $0.0007894. This unique asset, characterized by its real estate-linked narrative, is drawing attention within the meme cryptocurrency ecosystem and speculative investment circles.
This article provides a comprehensive analysis of HOUSE's potential price trajectory from 2026 to 2031, examining historical patterns, market dynamics, ecosystem developments, and broader macroeconomic conditions to offer investors professional price projections and practical investment strategies. Given the token's recent volatility—including a 33% decline over the past week and a 65.41% drop over the past month—understanding the underlying factors driving HOUSE's valuation becomes essential for informed decision-making in this emerging digital asset.
I. HOUSE Price History Review and Market Status
HOUSE Historical Price Evolution Trajectory
- 2025: Token launched in January, reaching an all-time high of $0.33 in May, demonstrating significant early market interest
- 2025-2026: Price experienced substantial correction, declining from the May peak to current levels
- 2026: Token reached an all-time low of $0.0007601 in early February, reflecting challenging market conditions
HOUSE Current Market Situation
As of February 04, 2026, HOUSE is trading at $0.0007894, representing a position near its historical low. The token has experienced negative price momentum across multiple timeframes, with a 2.96% decline over the past 24 hours, a 33.019% decrease over the past 7 days, and a 65.41% drop over the past 30 days. The only positive movement appears in the 1-hour timeframe, showing a 1.47% uptick.
The token maintains a market capitalization of $788,421.85, ranking 2684 in the cryptocurrency market with a 0.000029% market dominance. Trading volume over the past 24 hours stands at $17,560.41. The 24-hour price range has fluctuated between $0.0007601 and $0.0008463.
HOUSE has achieved full circulation with 998,760,897 tokens in circulation, matching its maximum supply, resulting in a 100% market cap to fully diluted valuation ratio. The token is held by approximately 22,148 addresses and is available on 12 exchanges. The current market sentiment index indicates a reading of 14, characterized as "Extreme Fear" conditions.
Housecoin operates on the Solana blockchain with the contract address DitHyRMQiSDhn5cnKMJV2CDDt6sVct96YrECiM49pump. The project positions itself as a meme token themed around hedging the real estate market, with the concept that 1 $HOUSE token will be worth 1 house.
Click to view the current HOUSE market price
HOUSE Market Sentiment Indicator
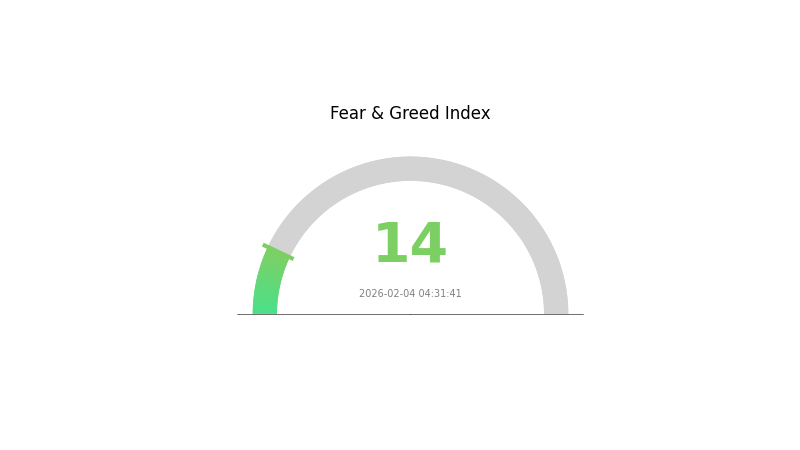
2026-02-04 Fear and Greed Index: 14 (Extreme Fear)
Click to view the current Fear & Greed Index
The cryptocurrency market is currently experiencing extreme fear, with the Fear and Greed Index reaching just 14 points. This exceptionally low reading indicates that market participants are overwhelmingly pessimistic and risk-averse. During such periods, panic selling often dominates, creating significant downward pressure on asset prices. However, extreme fear historically presents contrarian opportunities for strategic investors, as assets may become oversold relative to their fundamental value. Traders should exercise caution, conduct thorough research, and consider dollar-cost averaging strategies rather than making reactive decisions during heightened volatility.
HOUSE Holding Distribution
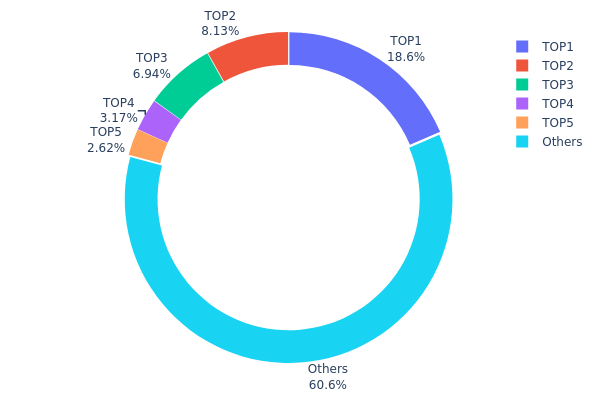
The holding distribution chart represents the concentration of tokens across different wallet addresses, revealing how HOUSE tokens are distributed among major holders and the broader community. This metric serves as a critical indicator of market decentralization and potential concentration risks that could impact price stability and market dynamics.
Based on the current data, HOUSE exhibits a moderate level of concentration with the top 5 addresses controlling approximately 39.41% of the total supply. The largest holder controls 18.57% of tokens (185,523.55K HOUSE), while the second and third largest addresses hold 8.12% and 6.94% respectively. The remaining addresses in the top 5 collectively account for 5.78%. Notably, 60.59% of tokens are distributed among other addresses, suggesting a relatively broad base of smaller holders. This distribution pattern indicates neither extreme centralization nor complete decentralization, positioning HOUSE in a middle ground that balances major stakeholder influence with community participation.
The current holding structure presents both opportunities and risks for market stability. The presence of a dominant holder with nearly one-fifth of the supply creates potential vulnerability to large-scale selling pressure, which could trigger significant price volatility if this address decides to liquidate positions. However, the substantial 60.59% held by smaller addresses provides a cushion effect and suggests genuine community engagement. This distribution reflects a market structure where major holders maintain significant influence over price movements, yet the dispersed nature of the majority holdings prevents complete market manipulation by any single entity. The on-chain structure demonstrates moderate stability, though investors should remain aware that coordinated actions by the top addresses could materially impact short-term price dynamics.
Click to view current HOUSE Holding Distribution
| Top |
Address |
Holding Qty |
Holding (%) |
| 1 |
Gj5t6K...f96HNH |
185523.55K |
18.57% |
| 2 |
BmFdpr...WTymy6 |
81138.83K |
8.12% |
| 3 |
u6PJ8D...ynXq2w |
69322.31K |
6.94% |
| 4 |
ASTyfS...g7iaJZ |
31701.69K |
3.17% |
| 5 |
8bEfPK...Howub5 |
26135.40K |
2.61% |
| - |
Others |
604776.34K |
60.59% |
II. Core Factors Influencing HOUSE's Future Price
Supply Mechanism
- Inventory Management: Current real estate inventory levels serve as a key determinant of future price trajectories. The balance between available housing stock and market demand directly influences pricing dynamics.
- Historical Patterns: Past supply fluctuations have significantly impacted housing prices. During periods of tight inventory, prices have tended to rise, demonstrating the critical relationship between supply constraints and valuation.
- Current Impact: The existing inventory situation continues to play a pivotal role in shaping near-term price expectations, with supply-demand imbalances potentially driving market movements.
Macroeconomic Environment
- Monetary Policy Impact: Macroeconomic conditions, interest rate levels, and inflation rates affect purchaser buying power and investment sentiment. During economic prosperity periods, rising income levels typically increase housing demand, while government monetary policy adjustments can indirectly influence price trends through interest rate regulation.
- Inflation Considerations: Economic environmental changes affect development costs, supply-demand relationships, and consumer psychology. Currency supply dynamics and broader economic growth patterns remain fundamental drivers of long-term price trends.
- Geopolitical Factors: Domestic and international economic trends, capital market movements, investment channel development, and urbanization processes contribute to the overall economic environment affecting valuations.
Demographic and Industry Dynamics
- Population Growth: Population increase represents one of the primary drivers of price appreciation. Migration patterns and new population influx create additional housing demand, which can support upward price pressure.
- Industry Development: Industry development determines demand quality, complementing population factors that determine demand quantity. Economic growth within urban centers serves as a fundamental driver of price trends, with sustained economic expansion typically supporting upward price momentum.
- Regional Factors: Community characteristics, local development initiatives, and regional economic performance influence specific market segments and contribute to differentiated pricing across locations.
III. 2026-2031 HOUSE Price Forecast
2026 Outlook
- Conservative forecast: $0.00054 - $0.00079
- Neutral forecast: $0.00079 average
- Optimistic forecast: $0.00086 (requires favorable market conditions)
2027-2029 Outlook
- Market stage expectation: The token is anticipated to enter a gradual growth phase, with increasing adoption and market recognition potentially driving upward momentum.
- Price range forecast:
- 2027: $0.00063 - $0.00107
- 2028: $0.00074 - $0.00124
- 2029: $0.00098 - $0.00153
- Key catalysts: Market maturation, expanding user base, and broader ecosystem development could serve as primary drivers for price appreciation during this period.
2030-2031 Long-term Outlook
- Baseline scenario: $0.00108 - $0.00182 (assuming steady market growth and sustained project development)
- Optimistic scenario: $0.00118 - $0.00232 (contingent on accelerated adoption and favorable regulatory environment)
- Transformative scenario: Potential to reach upper ranges if breakthrough partnerships or significant technological advancements materialize
- 2026-02-04: HOUSE maintains early-stage valuation with anticipated price range of $0.00054 - $0.00086
| Year |
Predicted High Price |
Predicted Average Price |
Predicted Low Price |
Price Change |
| 2026 |
0.00086 |
0.00079 |
0.00054 |
0 |
| 2027 |
0.00107 |
0.00082 |
0.00063 |
4 |
| 2028 |
0.00124 |
0.00095 |
0.00074 |
19 |
| 2029 |
0.00153 |
0.00109 |
0.00098 |
38 |
| 2030 |
0.00182 |
0.00131 |
0.00108 |
66 |
| 2031 |
0.00232 |
0.00157 |
0.00118 |
98 |
IV. HOUSE Professional Investment Strategy and Risk Management
HOUSE Investment Methodology
(1) Long-term Holding Strategy
- Suitable for: Risk-tolerant investors interested in meme token speculation and real estate market hedging concepts
- Operational Recommendations:
- Consider HOUSE as a highly speculative allocation within a diversified crypto portfolio
- Monitor market sentiment and social media activity around the project's unique value proposition
- Utilize secure storage solutions like Gate Web3 Wallet for asset custody
(2) Active Trading Strategy
- Technical Analysis Tools:
- Volume Analysis: Track the 24-hour trading volume (currently $17,560) to identify liquidity patterns and potential entry/exit points
- Price Action Indicators: Monitor support levels (recent low at $0.0007601) and resistance zones (24-hour high at $0.0008463)
- Swing Trading Considerations:
- Given the high volatility (-33.019% over 7 days, -65.41% over 30 days), implement strict stop-loss orders
- Scale positions gradually rather than entering with full allocation at once
HOUSE Risk Management Framework
(1) Asset Allocation Principles
- Conservative Investors: 0.5-1% of crypto portfolio
- Aggressive Investors: 2-5% of crypto portfolio
- Professional Traders: Up to 10% with active monitoring
(2) Risk Hedging Solutions
- Portfolio Diversification: Balance HOUSE exposure with established cryptocurrencies and stablecoins
- Position Sizing: Limit individual trade exposure to minimize impact from adverse price movements
(3) Secure Storage Solutions
- Software Wallet Recommendation: Gate Web3 Wallet provides convenient access for active trading while maintaining security
- Multi-signature Options: Consider multi-sig solutions for larger holdings to enhance security
- Security Precautions: Never share private keys, enable two-factor authentication, and verify contract addresses (DitHyRMQiSDhn5cnKMJV2CDDt6sVct96YrECiM49pump on Solana) before transactions
V. HOUSE Potential Risks and Challenges
HOUSE Market Risks
- Extreme Volatility: The token has experienced significant price fluctuations, with a 65.41% decline over 30 days, indicating high speculative risk
- Limited Liquidity: With a market cap of approximately $788,421 and 24-hour volume of $17,560, the token may face liquidity constraints during market stress
- Meme Token Dynamics: As a meme-themed asset, HOUSE is highly susceptible to social media sentiment shifts and speculative trading patterns
HOUSE Regulatory Risks
- Meme Token Classification: Regulatory bodies may scrutinize meme tokens more closely, potentially impacting trading availability
- Compliance Uncertainty: The evolving regulatory landscape for cryptocurrency assets could affect HOUSE's accessibility on various platforms
- Real Estate Market Claims: The project's stated connection to real estate market hedging may attract regulatory attention regarding asset backing representations
HOUSE Technical Risks
- Smart Contract Dependency: As a Solana-based token, HOUSE relies on the underlying blockchain's security and performance
- Concentrated Supply: With 100% of the maximum supply (998,760,897 tokens) already in circulation, token economics depend entirely on demand dynamics
- Project Development Risk: The long-term viability depends on the project team's ability to execute on stated objectives and maintain community engagement
VI. Conclusion and Action Recommendations
HOUSE Investment Value Assessment
HOUSECOIN presents as a highly speculative meme token with a thematic focus on real estate market hedging. The project's unique value proposition of "1 $HOUSE token will be worth 1 house" represents an aspirational concept rather than a guaranteed outcome. With a relatively small market cap of $788,421 and significant recent price declines, the token carries substantial short-term volatility risk. The 100% circulating supply provides transparency, but the concentration of 22,148 holders suggests limited distribution. While the Solana blockchain provides technical infrastructure, investors should approach HOUSE primarily as a speculative asset with meme characteristics rather than a direct real estate investment vehicle.
HOUSE Investment Recommendations
✅ Beginners: Consider HOUSE only after establishing positions in major cryptocurrencies; limit exposure to less than 1% of total portfolio; focus on education about meme token dynamics before investing
✅ Experienced Investors: Employ strict risk management with position sizing under 5% of crypto allocation; utilize technical analysis to identify entry points during consolidation phases; set predetermined exit strategies
✅ Institutional Investors: Evaluate HOUSE within the context of alternative meme token exposure; conduct thorough due diligence on project sustainability and community engagement metrics; consider strategic small-cap allocation if aligned with speculative investment mandates
HOUSE Trading Participation Methods
- Spot Trading on Gate.com: Access HOUSE trading pairs with competitive fees and liquidity on the Gate.com platform
- DCA Strategy: Implement dollar-cost averaging to mitigate timing risk given the token's high volatility profile
- Community Monitoring: Follow the project's Twitter (@HousecoinOnSol) and official channels to stay informed about developments and sentiment shifts
Cryptocurrency investment carries extremely high risk, and this article does not constitute investment advice. Investors should make prudent decisions based on their own risk tolerance and are advised to consult professional financial advisors. Never invest more than you can afford to lose.
FAQ
What factors affect the accuracy of house price predictions?
House price prediction accuracy is influenced by community average price, property size, decoration condition, attention count, and transaction timing. These factors directly determine price fluctuations and forecast reliability.
How to use historical data to predict future house price trends?
Analyze historical transaction data using machine learning models to identify patterns and market trends. The system evaluates factors like transaction volume, price movements, and market demand to forecast future price changes, helping investors make informed decisions.
What are the common methods and algorithms for housing price prediction models?
Common methods include ARIMA, SVM, LSTM, and deep neural networks. These models analyze factors like economic indicators and property attributes. Machine learning approaches such as random forests and ensemble learning also show strong predictive performance. The choice depends on data availability and accuracy requirements.
How effective is machine learning in house price prediction?
Machine learning shows excellent performance in house price prediction. XGBoost models typically outperform other methods with higher accuracy and lower prediction errors. Research demonstrates that XGBoost delivers superior fitting quality and significantly reduces forecasting deviation in real estate valuation.
How do location, school districts, and transportation affect housing prices?
Prime locations, quality school districts, and convenient transportation significantly boost property values. Strong infrastructure and population growth further drive prices higher, making these factors key predictors in real estate markets.
How does house price prediction help homebuyers and investors?
House price prediction empowers buyers and investors to make informed decisions by identifying market trends and investment opportunities. It provides future price forecasts, enabling strategic planning and maximizing returns on real estate investments.
What are the limitations and risks of house price prediction?
House price prediction models face limitations including overlooking nonlinear relationships, external market factors like policy changes, and data quality constraints. Prediction accuracy depends on historical data availability and market volatility, which may affect investment outcomes.
* The information is not intended to be and does not constitute financial advice or any other recommendation of any sort offered or endorsed by Gate.