This comprehensive analysis examines K21's price trajectory from 2026 to 2031, combining historical patterns and market dynamics. Currently trading at $0.01792 with extreme market fear conditions, K21 faces challenges including limited liquidity on Gate and concentrated holder distribution. The article projects 2026 price range of $0.01093-$0.02061, with long-term potential reaching $0.03762 by 2031 under optimistic scenarios. Key influencing factors include macroeconomic conditions, supply-demand dynamics, and regulatory developments. Professional investment strategies cover long-term holding for art-focused investors and active trading approaches, with asset allocation recommendations from 0.5% to 5% depending on risk tolerance. Significant risks include low trading volume, extreme price volatility, and smart contract dependencies requiring careful risk management and portfolio diversification.
Introduction: K21's Market Position and Investment Value
K21 (K21), as a unique digital asset representing fractional ownership in an NFT art vault collection, has been operating since its launch in 2021. As of February 2026, K21 maintains a market capitalization of approximately $323,000 with a circulating supply of around 18.03 million tokens, with the current price hovering at $0.01792. This asset, which bridges the intersection of art curation and blockchain technology, is playing a role in democratizing access to high-value NFT collections through tokenized ownership.
This article will comprehensively analyze K21's price trajectory from 2026 to 2031, combining historical patterns, market supply and demand dynamics, ecosystem development, and macroeconomic conditions to provide investors with professional price forecasts and practical investment strategies.
I. K21 Price History Review and Market Status
K21 Historical Price Evolution Trajectory
- 2021: K21 token launched in March, reaching an all-time high of 11.59 USD on March 27, representing the project's initial market enthusiasm
- 2021-2025: The token experienced significant volatility, with price declining substantially from its peak during the broader crypto market cycles
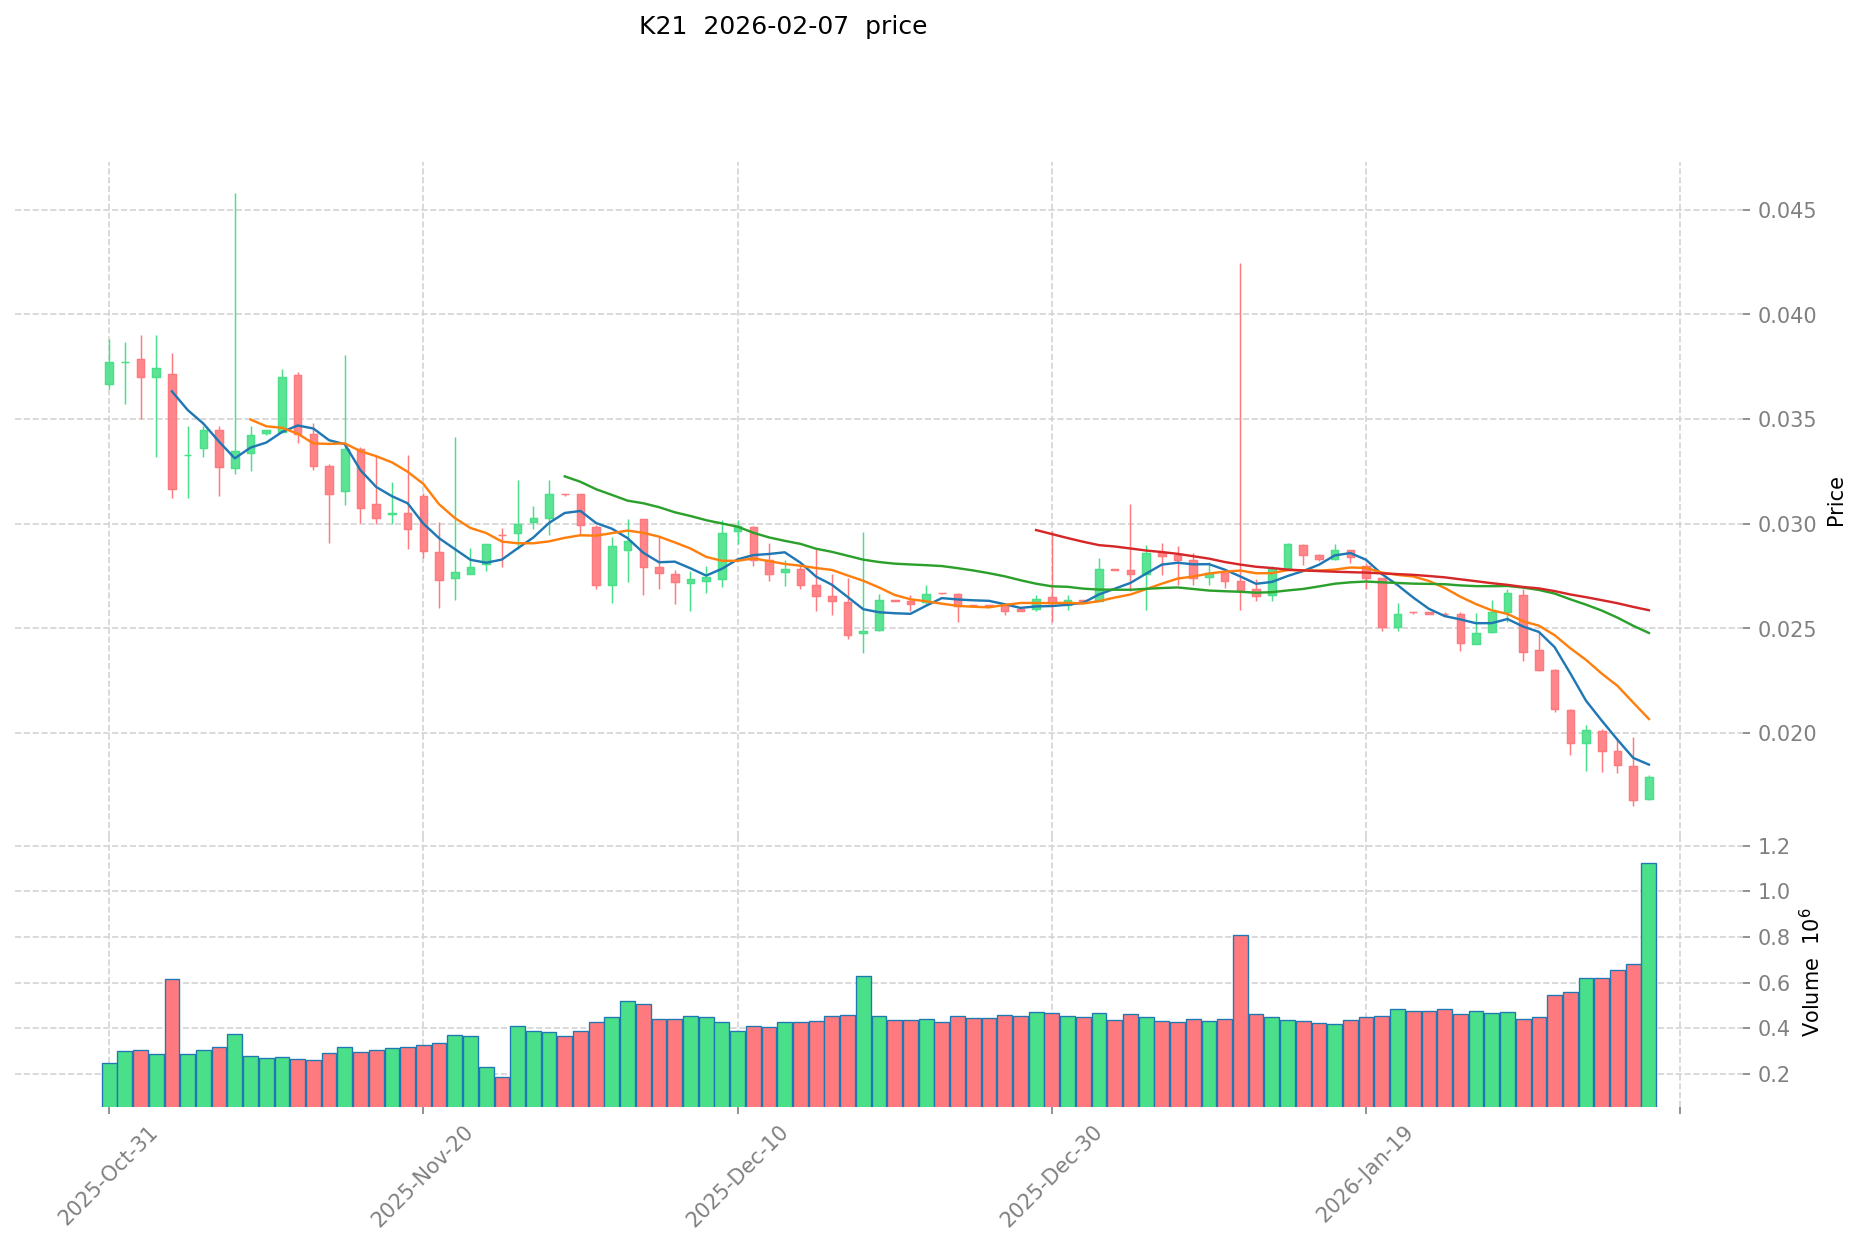
- 2026: Price reached an all-time low of 0.01649066 USD on February 6, reflecting prolonged bearish pressure
K21 Current Market Status
As of February 7, 2026, K21 is trading at 0.01792 USD with a 24-hour trading volume of 19,561.29 USD. The token has shown a 6.3% increase over the past 24 hours, with intraday price ranging between 0.01682 USD and 0.01798 USD.
The circulating supply stands at 18,026,697.92 tokens, representing approximately 85.84% of the maximum supply of 21,000,000 tokens. The current market capitalization is 323,038.43 USD, with a fully diluted market cap of 376,320 USD. The token is held by 3,769 addresses.
Over different time periods, K21 has exhibited varied performance: a 0.0097% increase in the past hour, a 22.33% decline over the past week, a 36.78% decrease over the past month, and a 64.3% decline over the past year. The current price represents a 99.85% decrease from its all-time high.
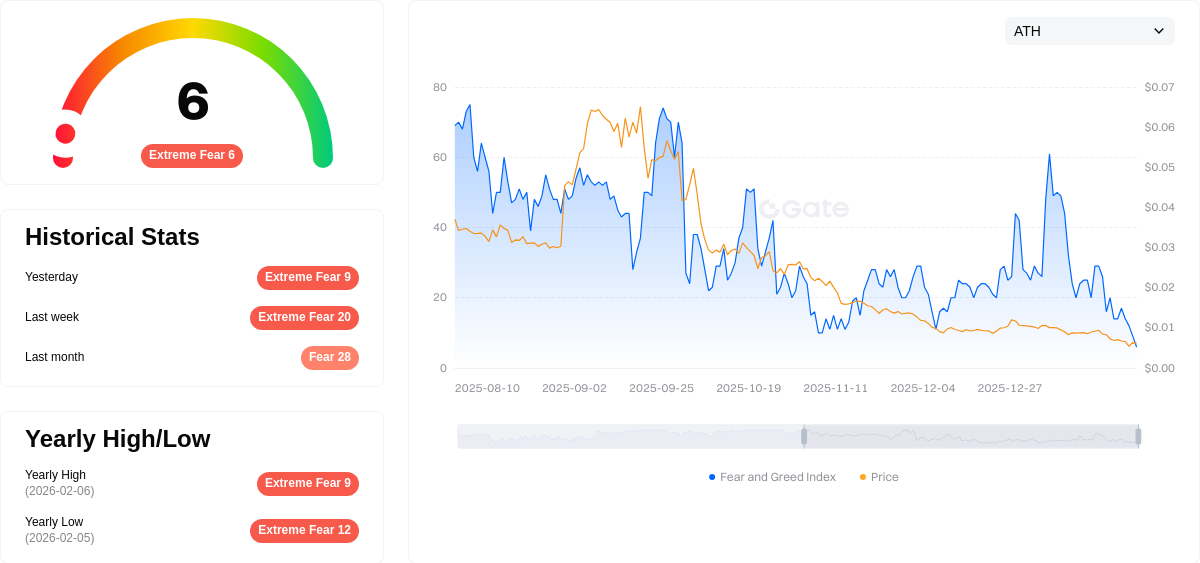
The market sentiment index currently stands at 6, indicating extreme fear in the broader crypto market environment.
Click to view current K21 market price
K21 Market Sentiment Indicator
2026-02-07 Fear and Greed Index: 6 (Extreme Fear)
Click to view the current Fear & Greed Index
The cryptocurrency market is currently experiencing extreme fear, with the Fear and Greed Index plummeting to 6. This indicates widespread investor pessimism and heightened market anxiety. Such extreme readings often signal potential capitulation phases where panic selling dominates. Experienced traders may view this as a contrarian buying opportunity, as historically, extreme fear levels have preceded market reversals. However, caution is advised as further downside pressure could still occur. Monitoring key support levels and market fundamentals remains crucial during this highly volatile period.
K21 Holding Distribution
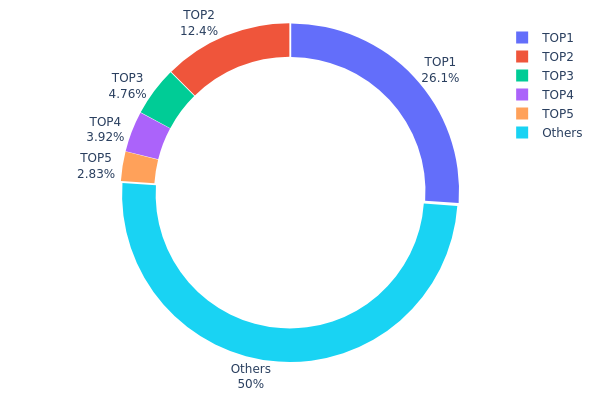
Based on the current on-chain data, K21's holding distribution reveals a moderate concentration pattern. The top 5 addresses collectively hold approximately 50.02% of the total supply, with the largest holder controlling 26.11% (5,483.23K tokens), followed by the second-largest address holding 12.42% (2,608.36K tokens). The remaining addresses outside the top 5 account for 49.98% of the supply, indicating a relatively balanced distribution between major holders and the broader community.
This concentration level suggests K21 maintains a semi-decentralized structure. While the dominance of the top address at over one-quarter of total supply poses potential risks for price manipulation or sudden market movements, the presence of a substantial "Others" category holding nearly 50% demonstrates meaningful token distribution across the ecosystem. The gradual decline in holdings from the third to fifth positions (4.75%, 3.91%, and 2.83% respectively) indicates a healthy tiering of stakeholders rather than extreme whale concentration.
From a market structure perspective, this distribution pattern creates both stability and vulnerability. The diversified lower-tier holdings can provide liquidity cushioning during market volatility, while the significant concentration in top addresses means major sell-offs or strategic moves by these entities could trigger substantial price fluctuations. Investors should monitor movements from these top addresses closely, as their trading activities may serve as leading indicators for broader market sentiment shifts.
Click to view current K21 Holding Distribution
| Top |
Address |
Holding Qty |
Holding (%) |
| 1 |
0x3bf8...5aa7f3 |
5483.23K |
26.11% |
| 2 |
0xa4fc...dec59a |
2608.36K |
12.42% |
| 3 |
0x3a5e...661af1 |
999.33K |
4.75% |
| 4 |
0x573f...507ef5 |
822.35K |
3.91% |
| 5 |
0x478a...599735 |
594.82K |
2.83% |
| - |
Others |
10491.91K |
49.98% |
II. Core Factors Influencing K21's Future Price
Supply Mechanism
- US Dollar-Gold Relationship: The relationship between the US dollar and gold follows a general pattern where a stronger dollar weakens gold prices, while a weaker dollar strengthens gold prices.
- Historical Pattern: Historical data shows an inverse correlation between dollar strength and gold valuations, with gold often serving as a hedge against dollar depreciation.
- Current Impact: As K21 appears to be linked to gold pricing dynamics, current US dollar strength trends and monetary policy expectations will likely continue to influence its price trajectory through the traditional dollar-gold relationship.
Market Demand and Supply Dynamics
- Supply-Demand Balance: Market demand and supply dynamics play a crucial role in determining K21's price movements.
- Market Conditions: Current market conditions reflect the ongoing interplay between available supply and investor demand for gold-backed assets.
- Price Sensitivity: K21's price remains sensitive to shifts in both physical gold demand and broader commodity market sentiment.
Macroeconomic Environment
- Monetary Policy Impact: Central bank policies, particularly US Federal Reserve decisions, directly affect gold prices through their influence on dollar strength and real interest rates.
- Inflation Hedge Attributes: Gold historically serves as an inflation hedge, with K21 likely benefiting from similar dynamics during periods of elevated inflation concerns.
- Currency Strength Factors: Global currency movements, especially the US dollar index performance, remain key determinants of gold-related asset valuations.
Economic Factors
- Global Economic Conditions: Broader economic stability and growth prospects influence investor appetite for safe-haven assets like gold-backed tokens.
- Market Sentiment: Risk appetite in global financial markets affects capital flows into or out of gold-related investments.
- Geopolitical Considerations: International uncertainties and geopolitical tensions typically drive increased demand for gold as a store of value.
III. 2026-2031 K21 Price Prediction
2026 Outlook
- Conservative forecast: $0.01093 - $0.01792
- Neutral forecast: $0.01792 (average price level)
- Optimistic forecast: Up to $0.02061 (requires favorable market conditions and increased adoption)
2027-2029 Medium-Term Outlook
- Market stage expectation: Gradual growth phase with moderate volatility, characterized by increasing mainstream recognition and ecosystem expansion
- Price range predictions:
- 2027: $0.01214 - $0.02851, representing approximately 7% growth from 2026 baseline
- 2028: $0.01768 - $0.02508, with 33% cumulative appreciation potential
- 2029: $0.01518 - $0.02865, reaching 36% growth trajectory
- Key catalysts: Technology infrastructure improvements, broader market participation, regulatory clarity developments, and strategic partnership formations
2030-2031 Long-Term Outlook
- Baseline scenario: $0.0186 - $0.02657 by 2030 (assumes steady ecosystem development and sustained market interest)
- Optimistic scenario: $0.02727 - $0.03135 by 2031 (requires accelerated adoption rates and enhanced utility integration)
- Transformative scenario: Potential to reach $0.03762 (contingent upon breakthrough innovations, significant institutional participation, and favorable macroeconomic conditions)
- 2026-02-07: K21 trading within the $0.01093 - $0.02061 range (early-stage price discovery with 48% potential upside by 2030 and 74% by 2031 from current baseline levels)
| Year |
Predicted High Price |
Predicted Average Price |
Predicted Low Price |
Price Change |
| 2026 |
0.02061 |
0.01792 |
0.01093 |
0 |
| 2027 |
0.02851 |
0.01926 |
0.01214 |
7 |
| 2028 |
0.02508 |
0.02389 |
0.01768 |
33 |
| 2029 |
0.02865 |
0.02448 |
0.01518 |
36 |
| 2030 |
0.03613 |
0.02657 |
0.0186 |
48 |
| 2031 |
0.03762 |
0.03135 |
0.02727 |
74 |
IV. K21 Professional Investment Strategy and Risk Management
K21 Investment Methodology
(I) Long-term Holding Strategy
- Suitable for: Art-focused crypto investors and NFT collectors interested in fractional art ownership
- Operational Recommendations:
- Consider K21 as part of a diversified alternative asset portfolio given its unique art-backed value proposition
- Monitor the vault's art collection performance and community governance decisions regarding potential buyout proposals
- Utilize Gate Web3 Wallet for secure self-custody storage with multi-signature protection enabled
(II) Active Trading Strategy
- Technical Analysis Tools:
- Volume Analysis: K21's daily trading volume of approximately $19,561 reflects relatively limited liquidity, requiring careful order size management
- Support/Resistance Levels: Current price near $0.01792 shows significant distance from historical high of $11.59, suggesting high volatility potential
- Swing Trading Considerations:
- Monitor the 21% consensus threshold mechanism which could create significant price movements during buyout proposals
- Be aware of the token's limited exchange availability (currently traded on 1 exchange) which may impact exit liquidity
K21 Risk Management Framework
(I) Asset Allocation Principles
- Conservative Investors: 0.5-1% allocation as experimental exposure to art-backed tokens
- Aggressive Investors: 2-3% allocation with recognition of high volatility and limited liquidity
- Professional Investors: Up to 5% allocation with active monitoring of vault governance and art market trends
(II) Risk Hedging Approaches
- Portfolio Diversification: Balance K21 exposure with established cryptocurrencies and traditional NFT holdings
- Position Sizing: Limit individual position to amount comfortable with potential total loss given token's 64.3% decline over past year
(III) Secure Storage Solutions
- Recommended Wallet: Gate Web3 Wallet supporting ERC-20 tokens with hardware wallet integration option
- Cold Storage Approach: Transfer tokens to hardware wallet for long-term holdings exceeding short-term trading needs
- Security Precautions: Verify contract address (0xb9d99c33ea2d86ec5ec6b8a4dd816ebba64404af on Ethereum) before any transactions; beware of phishing attempts targeting art-focused token holders
V. K21 Potential Risks and Challenges
K21 Market Risks
- Limited Liquidity: Trading on only 1 exchange with daily volume of approximately $19,561 may result in significant slippage and difficulty executing large orders
- Price Volatility: Token has experienced 64.3% decline over the past year and remains 99.85% below its historical high, indicating substantial downside risk
- Market Cap Concentration: With only $323,038 in circulating market cap and 3,769 holders, the token faces concentration risk and potential for price manipulation
K21 Regulatory Risks
- Art-backed Token Classification: Regulatory uncertainty surrounding fractional art ownership tokens and potential securities classification in various jurisdictions
- NFT Regulatory Evolution: Changing regulatory frameworks for NFT and digital art assets could impact the token's legal status and operational model
- Cross-border Compliance: The vault's international art collection may face compliance challenges as different countries develop digital asset regulations
K21 Technical Risks
- Smart Contract Dependency: The vault buyout mechanism and 21% consensus voting system rely on smart contract execution without traditional legal recourse
- Ethereum Network Exposure: As an ERC-20 token, K21 is subject to Ethereum network congestion and high gas fees during periods of network stress
- Governance Mechanism Risks: The 21% veto threshold could potentially lead to governance deadlocks or be exploited by large token holders
VI. Conclusion and Action Recommendations
K21 Investment Value Assessment
K21 represents an experimental approach to fractional art ownership through blockchain technology, offering exposure to curated NFT collections. However, the token faces significant challenges including limited liquidity, substantial price decline from historical levels, and concentrated holder base. The long-term value proposition depends heavily on the appreciation of the underlying art vault and successful community governance. Current market conditions suggest high short-term risk with uncertain recovery prospects, requiring investors to carefully weigh the innovative art-backed model against practical liquidity and volatility concerns.
K21 Investment Recommendations
✅ Beginners: Approach with extreme caution; K21's limited liquidity and complex art-backed mechanism make it unsuitable for most new investors. If interested, limit exposure to less than 1% of portfolio and prioritize learning about NFT markets first
✅ Experienced Investors: Consider small speculative position (1-3% allocation) if interested in art-backed crypto experiments; maintain strict stop-loss discipline and monitor vault governance developments closely
✅ Institutional Investors: Evaluate as part of alternative digital asset research with focus on fractional art ownership models; conduct thorough due diligence on vault holdings and legal structure before considering allocation
K21 Trading Participation Methods
- Spot Trading: Execute purchases through Gate.com with careful attention to order book depth and potential slippage due to limited liquidity
- Dollar-Cost Averaging: For long-term holders, consider gradual accumulation strategy to mitigate timing risk in volatile market conditions
- Vault Governance Monitoring: Stay informed about potential buyout proposals through official Kanon channels, as these events could create significant price movements
Cryptocurrency investment carries extremely high risk, and this article does not constitute investment advice. Investors should make prudent decisions based on their own risk tolerance and are advised to consult professional financial advisors. Never invest more than you can afford to lose.
FAQ
What is K21? What is its purpose?
K21 is a plant-based probiotic strain designed to reduce inflammation, support weight management, and enhance metabolism. It helps prevent and improve metabolic syndrome while promoting overall digestive and metabolic health.
What is the historical price trend of K21?
K21 has shown volatility in recent trading. Over the past 24 hours, the price ranged from $0.024284 to $0.02531, with current price at $0.02500 as of February 7, 2026. The token demonstrates dynamic market movement with a -0.23% daily change.
How to predict K21 price? What analysis methods are available?
K21 price prediction uses two main methods: Technical analysis examines moving averages and relative strength index from price charts. Fundamental analysis evaluates market demand, supply dynamics, and project developments. Combining both approaches provides comprehensive price forecasting insights.
What are the main factors influencing K21 price prediction?
K21 price is primarily influenced by supply and demand dynamics, market sentiment driven by news and social media, regulatory developments such as ETF approvals, and institutional investor behavior.
What are the advantages of K21 compared to similar assets?
K21 stands out with its unique asset management model and stable high returns. It features transparent management mechanisms, strategic NFT portfolio holding, and consistent yield generation that outperforms comparable assets in the market.
What are the risks to pay attention to when investing in K21?
K21 investment risks include market volatility, liquidity fluctuations, regulatory changes, and technology uncertainties. Conduct thorough research before investing. Diversify your portfolio and only invest what you can afford to lose.
K21的未来前景和发展潜力如何?
K21 in probiotics research demonstrates strong future potential with ongoing clinical trials and industry backing. Aligned with global microbiome science trends, it's positioned for significant growth in health and wellness markets over coming years.
Where can I buy K21?
K21 is available on major centralized and decentralized exchanges. You can trade K21 on multiple platforms with active trading pairs like K21/USDT. Check leading crypto exchanges for the best liquidity and trading volume.
How is K21 price prediction accuracy assessed?
K21 price prediction accuracy is evaluated through technical indicators and market data analysis. We utilize RSI (Relative Strength Index) to assess momentum, MACD (Moving Average Convergence Divergence) to identify trends, and integrate latest market information into our predictive models for enhanced reliability.
* The information is not intended to be and does not constitute financial advice or any other recommendation of any sort offered or endorsed by Gate.