This comprehensive analysis examines MOONEY (MoonDAO) token dynamics through 2031, providing investors with data-driven price forecasts and strategic guidance. The article reviews MOONEY's market trajectory from January 2022 launch through February 2026, analyzing current market position including $257K market cap and 61.26% circulating supply ratio. Core analysis covers macroeconomic factors, regulatory landscape, and technological developments influencing price volatility. Price predictions range from $0.00013-$0.00017 in 2026, with growth potential approaching $0.00044 by 2031 under optimistic scenarios. Strategic recommendations include position sizing guidelines (0.5-10% based on risk tolerance), portfolio diversification approaches, and secure storage solutions via Gate Web3 Wallet. Risk assessment addresses extreme volatility, limited liquidity, and micro-cap status. Suitable for speculative investors understanding decentralized space exploration concepts.
Introduction: MOONEY's Market Position and Investment Value
MoonDAO (MOONEY), positioned as an international collective dedicated to democratizing access to space research and exploration, has been developing since its launch in January 2022. As of February 2026, MOONEY maintains a market capitalization of approximately $257,262, with a circulating supply of around 1.55 billion tokens and a price level near $0.0001661. This asset, emerging at the intersection of decentralized governance and space exploration, represents a unique niche within the broader cryptocurrency ecosystem.
This article provides a comprehensive analysis of MOONEY's price trajectory from 2026 through 2031, integrating historical patterns, market supply-demand dynamics, ecosystem development, and macroeconomic conditions to deliver professional price forecasting and practical investment strategies for interested parties.
I. MOONEY Price History Review and Market Status
MOONEY Historical Price Evolution Trajectory
- 2022: Token launched in January with initial trading activity, price reached peak level at $0.089878 in April, showing significant early-stage volatility
- 2023-2025: Market experienced extended correction phase, price gradually declined from previous highs
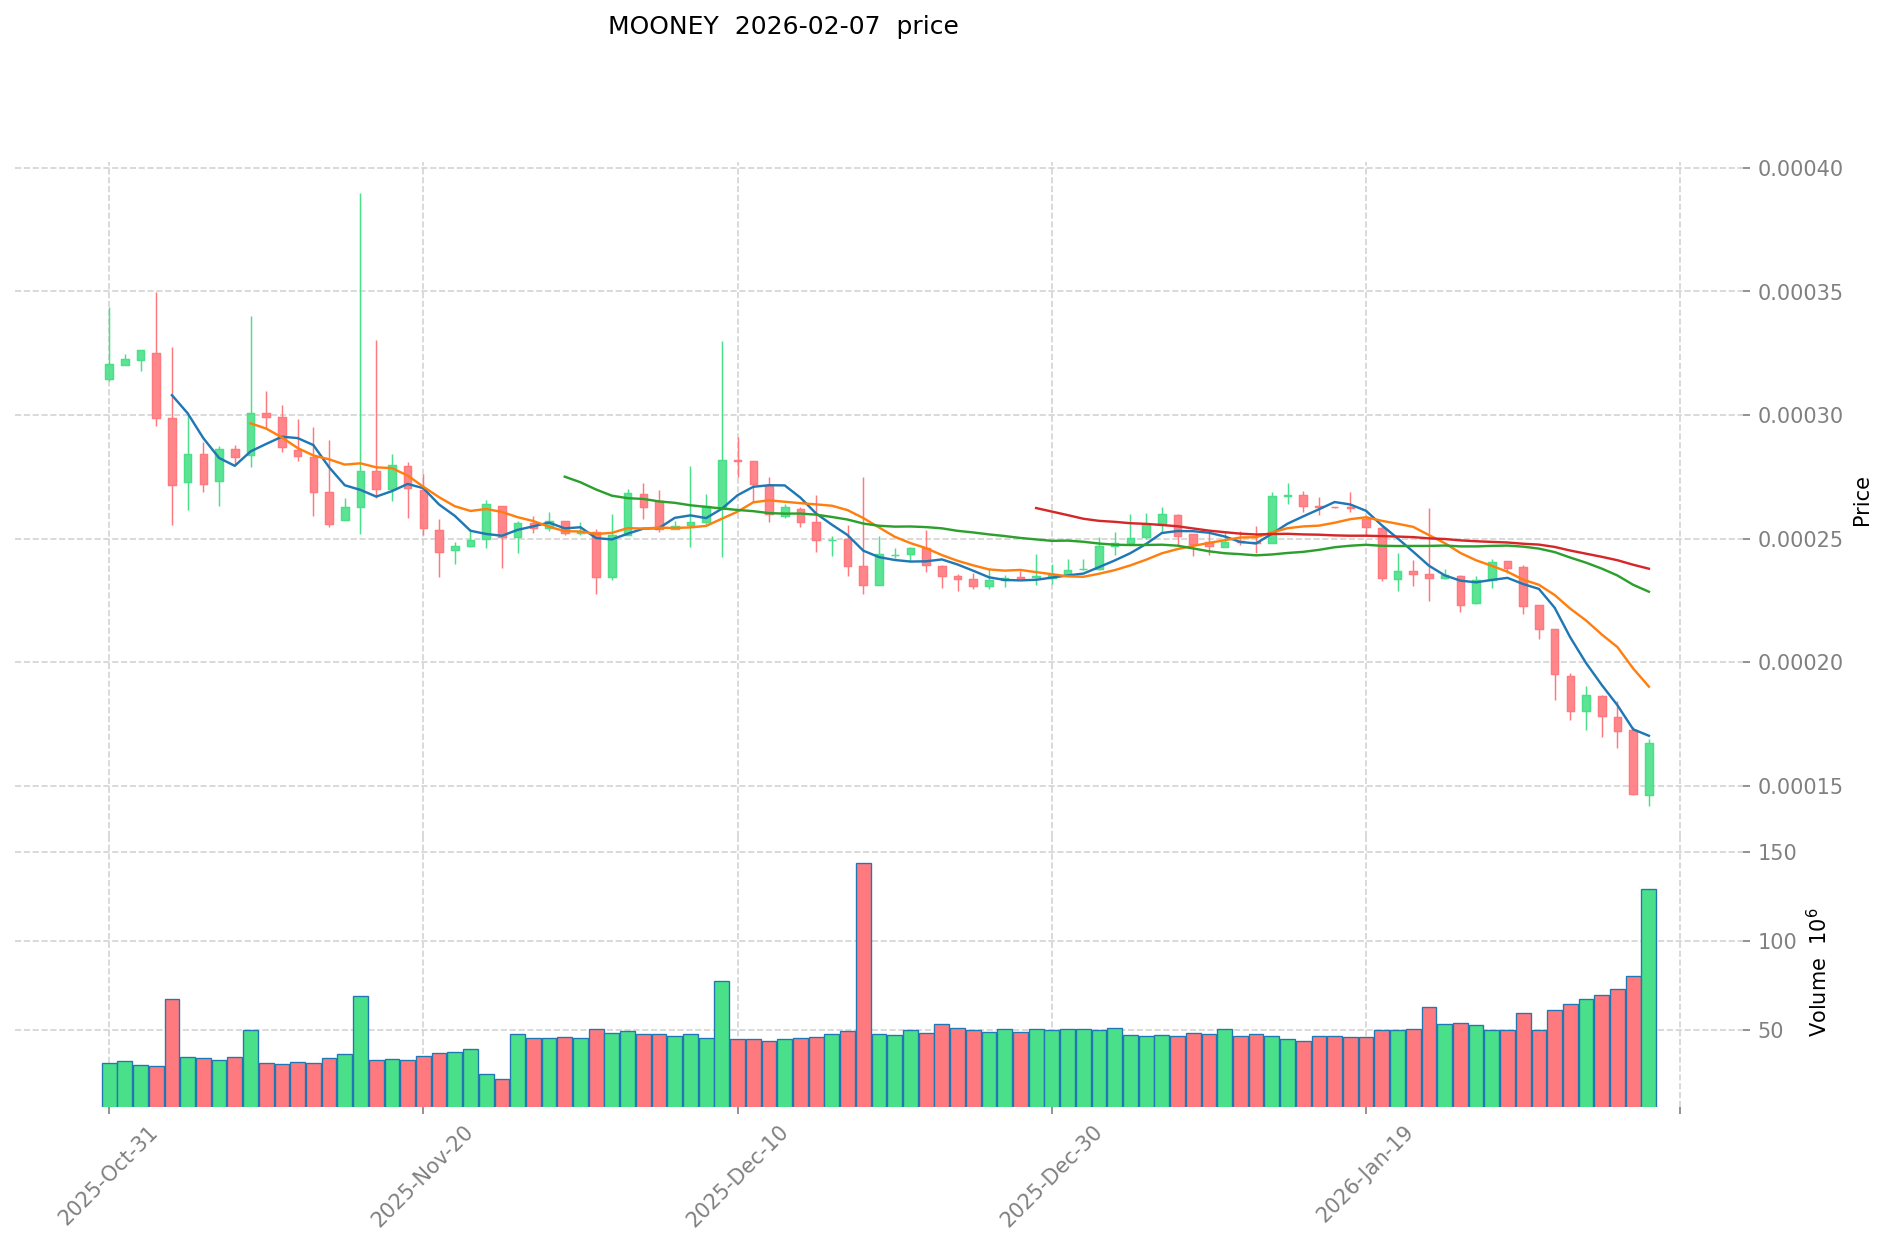
- 2026: Price reached record low at $0.00014268 in early February, reflecting challenging market conditions
MOONEY Current Market Situation
As of February 8, 2026, MOONEY is trading at $0.0001661, representing a recovery from its recent low point. The token has shown mixed short-term performance, with a 0.79% increase over the past hour and 1.28% gain in the last 24 hours. However, broader timeframe data indicates sustained downward pressure, with losses of 17.69% over 7 days, 32.12% over 30 days, and 45.12% year-over-year.
The market capitalization stands at approximately $257,262, with a circulating supply of 1.55 billion tokens out of a total supply of 2.62 billion tokens, resulting in a circulation ratio of 61.26%. The fully diluted market cap is estimated at $434,975. Trading volume over the past 24 hours reached $22,520, while the token maintains a holder base of 11,503 addresses. MOONEY's market dominance remains minimal at 0.000017% of the overall cryptocurrency market.
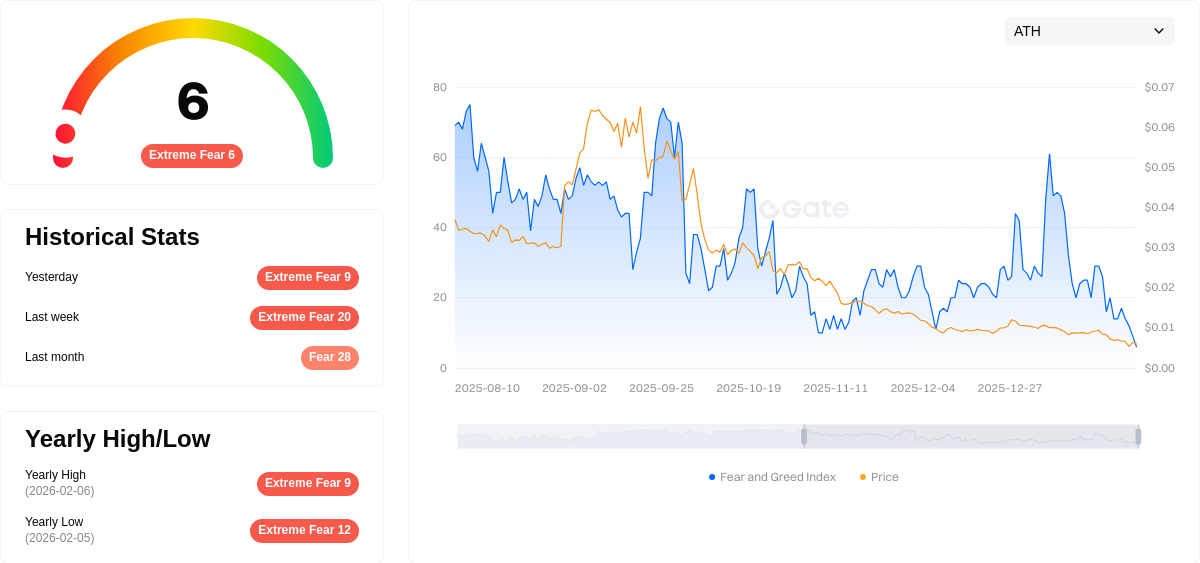
The cryptocurrency market sentiment index currently registers at 6, indicating extreme fear conditions among market participants, which may contribute to the token's recent price pressure.
Click to view current MOONEY market price
MOONEY Market Sentiment Index
2026-02-07 Fear and Greed Index: 6 (Extreme Fear)
Click to view the current Fear & Greed Index
The crypto market is experiencing extreme fear with the Fear and Greed Index at 6, indicating panic selling and significant market pessimism. During such periods, risk-averse investors typically reduce positions while contrarian traders may view extreme lows as potential entry opportunities. Market volatility remains elevated, and investor sentiment has turned decidedly negative. This extreme fear phase often precedes market stabilization or potential recovery phases. Traders should exercise caution and manage risk carefully during such volatile market conditions.
MOONEY Holding Distribution
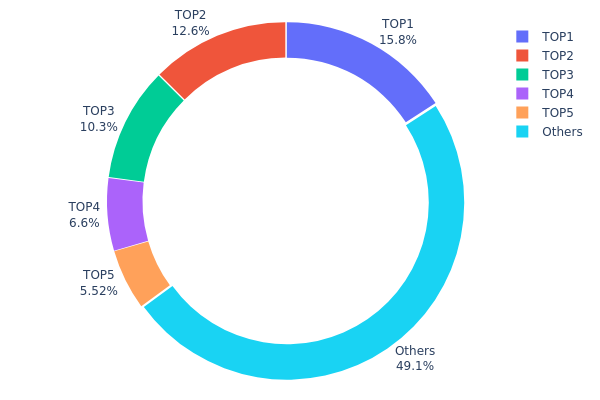
The holding distribution chart provides a clear view of token concentration across different wallet addresses, serving as a crucial indicator for assessing market structure and decentralization level. By analyzing the percentage of tokens held by top addresses, investors can better understand potential market risks and the health of the token ecosystem.
According to the latest on-chain data, MOONEY exhibits a relatively high concentration pattern. The top address holds 415,013.31K tokens, accounting for 15.84% of the total supply, while the top five addresses collectively control 50.84% of all tokens in circulation. This concentration level suggests that a significant portion of MOONEY's supply is concentrated in the hands of a few major holders, which may indicate the presence of project teams, early investors, or institutional participants.
Such a distribution structure presents both opportunities and risks. On one hand, if these large holders are project teams or long-term investors, their stable holding behavior may provide price support during market downturns. On the other hand, excessive concentration could lead to increased price volatility, as any selling action by major holders could significantly impact market prices. Additionally, with nearly half of the supply controlled by the top five addresses, the market faces potential manipulation risks, and retail investors should maintain heightened awareness of sudden price movements. From a decentralization perspective, MOONEY's current distribution structure suggests room for improvement in achieving broader token distribution, which is an important consideration for long-term ecosystem health and stability.
Click to view current MOONEY Holding Distribution
| Top |
Address |
Holding Qty |
Holding (%) |
| 1 |
0x6de2...be157f |
415013.31K |
15.84% |
| 2 |
0xa3a7...d60eec |
329112.80K |
12.56% |
| 3 |
0xce4a...cab2c9 |
270947.91K |
10.34% |
| 4 |
0x0000...e08a90 |
172810.83K |
6.59% |
| 5 |
0xcc71...db1740 |
144548.03K |
5.51% |
| - |
Others |
1286324.37K |
49.16% |
II. Core Factors Influencing MOONEY's Future Price
Macroeconomic Environment
-
Monetary Policy Impact: Federal Reserve monetary policy plays a significant role in shaping market conditions for cryptocurrencies like MOONEY. Current macroeconomic factors, including decisions around interest rates and monetary easing or tightening, create fluctuations in investor sentiment and liquidity in crypto markets.
-
Global Economic Trends: International economic cycles and structural factors contribute to market pressure. Economic challenges, trade dynamics, and cross-border capital flows affect the overall investment environment for digital assets.
-
Market Sentiment: Investor confidence and market psychology respond to broader economic indicators, creating periods of volatility or stability that impact MOONEY's price trajectory.
Regulatory and Policy Landscape
-
Regulatory Changes: Evolving regulations surrounding cryptocurrencies and digital assets influence market participation and institutional adoption. Policy clarity or uncertainty in major markets can create significant price movements.
-
Compliance Requirements: Changes in reporting standards, tax treatment, and operational requirements for crypto projects affect the investment landscape and project sustainability.
Technological Advancements
-
Innovation Trends: Technological developments within the blockchain space, including scalability solutions and infrastructure improvements, shape the competitive environment and utility prospects for projects like MOONEY.
-
Ecosystem Development: Progress in decentralized applications and platform capabilities influences long-term value propositions and adoption potential.
III. 2026-2031 MOONEY Price Prediction
2026 Outlook
- Conservative prediction: $0.00013 - $0.00017
- Neutral prediction: Around $0.00017
- Optimistic prediction: Up to $0.00017 (requiring stable market conditions)
2027-2029 Outlook
- Market stage expectation: The token may enter a gradual growth phase, with volatility gradually decreasing and market participants gradually increasing recognition
- Price range prediction:
- 2027: $0.00016 - $0.00019
- 2028: $0.00015 - $0.00025
- 2029: $0.00016 - $0.0003
- Key catalysts: Potential ecosystem development, community expansion, and possible new use case implementations could drive price appreciation
2030-2031 Long-term Outlook
- Baseline scenario: $0.00023 - $0.00034 (assuming steady ecosystem development and sustained community engagement)
- Optimistic scenario: $0.00024 - $0.00044 (assuming significant partnerships and broader adoption)
- Transformative scenario: Approaching $0.00044 (requiring breakthrough innovations in use cases and substantial market recognition)
- 2026-02-08: MOONEY approximately $0.00013 - $0.00017 (early stage with potential for gradual appreciation)
| Year |
Predicted High Price |
Predicted Average Price |
Predicted Low Price |
Price Change |
| 2026 |
0.00017 |
0.00017 |
0.00013 |
0 |
| 2027 |
0.00019 |
0.00017 |
0.00016 |
2 |
| 2028 |
0.00025 |
0.00018 |
0.00015 |
8 |
| 2029 |
0.0003 |
0.00022 |
0.00016 |
29 |
| 2030 |
0.00034 |
0.00026 |
0.00023 |
56 |
| 2031 |
0.00044 |
0.0003 |
0.00024 |
80 |
IV. MOONEY Professional Investment Strategy and Risk Management
MOONEY Investment Methodology
(I) Long-Term Holding Strategy
- Suitable for: Believers in decentralized space exploration and patient investors with high risk tolerance
- Operational Recommendations:
- Consider accumulating positions during market downturns, given the current price proximity to the all-time low of $0.00014268
- Set clear exit strategies based on project milestone achievements
- Utilize secure storage solutions such as Gate Web3 Wallet for long-term holdings
(II) Active Trading Strategy
- Technical Analysis Tools:
- Volume Analysis: Monitor the 24-hour trading volume of $22,520.50 to identify potential trend reversals
- Support and Resistance Levels: Track the 24-hour range between $0.0001615 (low) and $0.00017 (high) for short-term entry and exit points
- Swing Trading Key Points:
- Focus on the significant volatility demonstrated by the 7-day decline of 17.69%
- Set stop-loss orders to manage downside risk in this highly volatile asset
MOONEY Risk Management Framework
(I) Asset Allocation Principles
- Conservative Investors: 0.5-1% of crypto portfolio
- Aggressive Investors: 2-5% of crypto portfolio
- Professional Investors: Up to 10% with active risk management
(II) Risk Hedging Solutions
- Portfolio Diversification: Balance MOONEY exposure with more established crypto assets
- Position Sizing: Limit individual position size to acceptable loss levels given the 30-day decline of 32.12%
(III) Secure Storage Solutions
- Hot Wallet Recommendation: Gate Web3 Wallet for active trading and staking participation
- Cold Storage Solution: Hardware wallet storage for long-term holdings exceeding $1,000
- Security Considerations: Never share private keys, enable two-factor authentication, and regularly verify contract addresses (0x20d4DB1946859E2Adb0e5ACC2eac58047aD41395 on Ethereum)
V. MOONEY Potential Risks and Challenges
MOONEY Market Risks
- High Volatility: The token has experienced a 45.12% decline over the past year, indicating significant price instability
- Limited Liquidity: With only $22,520.50 in 24-hour trading volume and listing on one exchange, liquidity constraints may impact large trades
- Low Market Capitalization: A market cap of approximately $257,262 positions MOONEY as a micro-cap asset with heightened volatility risk
MOONEY Regulatory Risks
- Space Industry Oversight: Potential regulatory developments in commercial space exploration may impact MoonDAO's operations
- Securities Classification: DAO governance tokens face ongoing regulatory scrutiny regarding their classification
- International Compliance: As an international collective, MoonDAO must navigate multiple jurisdictions' regulatory frameworks
MOONEY Technical Risks
- Smart Contract Vulnerability: Ethereum-based tokens carry inherent smart contract risk despite established infrastructure
- Governance Centralization: With 11,503 holders and 61.26% circulating supply, voting power concentration may affect decentralization
- Project Execution Risk: The ambitious mission of democratizing space access faces significant technical and operational challenges
VI. Conclusion and Action Recommendations
MOONEY Investment Value Assessment
MOONDAO (MOONEY) represents a unique investment opportunity at the intersection of cryptocurrency and space exploration. The project's long-term value proposition centers on democratizing access to space research, an innovative concept with significant potential. However, investors must carefully weigh this against substantial short-term risks, including severe price depreciation (down 98.15% from all-time high), limited liquidity, and uncertain execution timelines. The current price near historical lows may present a speculative entry point for risk-tolerant investors who believe in the project's mission, but the volatile performance and micro-cap status demand cautious position sizing.
MOONEY Investment Recommendations
✅ Beginners: Avoid or allocate no more than 0.5% of total crypto portfolio. Prioritize learning about DeFi and DAO governance before investing in niche projects like MOONEY.
✅ Experienced Investors: Consider a small speculative position (1-3% of crypto portfolio) if aligned with the space exploration thesis. Monitor project developments and community engagement metrics closely.
✅ Institutional Investors: Conduct thorough due diligence on MoonDAO's operational roadmap and legal structure. Consider strategic partnership opportunities rather than pure financial investment.
MOONEY Trading Participation Methods
- Spot Trading: Purchase MOONEY directly on Gate.com with appropriate risk management protocols
- Dollar-Cost Averaging: Implement systematic purchasing over time to mitigate volatility impact
- Community Participation: Engage with MoonDAO governance and community initiatives to better understand project direction before committing significant capital
Cryptocurrency investment carries extremely high risks, and this article does not constitute investment advice. Investors should make prudent decisions based on their own risk tolerance and are advised to consult professional financial advisors. Never invest more than you can afford to lose.
FAQ
What is MOONEY token? What are its uses and characteristics?
MOONEY is an emerging cryptocurrency designed for secure and convenient transactions. It features fast settlement, low fees, and strong community support. The token has significant growth potential in the Web3 ecosystem.
MOONEY的历史价格表现如何?
MOONEY reached its all-time high of $0.089878 in April 2022 and hit its lowest point of $0.00017005 in April 2025. Currently trading between $0.00025288 and $0.00026868, showing significant price volatility over its lifetime.
What are the main factors affecting MOONEY price fluctuations?
MOONEY price changes are primarily driven by supply mechanisms, market demand, and investor sentiment. Token scarcity, trading volume, and broader market dynamics also significantly influence its price movements.
How to predict MOONEY price? What analysis methods are available?
Analyze MOONEY price through technical analysis, studying candlestick patterns and trading volume. Use time series analysis and regression models to identify trends. Monitor market sentiment, on-chain metrics, and historical price movements for comprehensive forecasting.
What are the advantages and disadvantages of MOONEY compared to similar tokens?
MOONEY offers transparent development roadmap and strong community support with high stability and security. However, it lacks market liquidity and widespread use cases compared to competitors, limiting its competitive advantage in the market.
What are the risks to pay attention to when investing in MOONEY?
MOONEY investment carries market volatility and price fluctuation risks. Investors should implement proper risk management, diversify portfolios, and only invest what they can afford to lose. Monitor market conditions closely and stay informed.
What is MOONEY's project team and development roadmap?
MOONEY's team comprises experienced developers focused on blockchain innovation. The roadmap includes protocol enhancements, ecosystem expansion, and community-driven growth initiatives planned through 2026-2027.
Where can MOONEY be traded? How is the liquidity?
MOONEY is available for trading with strong liquidity. The primary trading pair is MOONEY/USDT, featuring significant daily trading volume and reliable market depth for seamless transactions.
* The information is not intended to be and does not constitute financial advice or any other recommendation of any sort offered or endorsed by Gate.