2026 NBOT Price Prediction: Expert Analysis and Market Forecast for the Next Generation Token
Introduction: NBOT's Market Position and Investment Value
NBOT, the native token of Naka Chain, serves as a cornerstone within the decentralized finance (DeFi) prediction market ecosystem since its launch in 2019. As of February 2026, NBOT maintains a market capitalization of approximately $183,458.88, with a circulating supply of around 21,332,428 tokens, and a current price hovering near $0.0086. This asset, recognized for its integration within the Deerfi synthetic asset exchange platform, plays a growing role in enabling coin-margined financial derivatives trading and liquidity provision.
This article will comprehensively analyze NBOT's price trajectory from 2026 through 2031, incorporating historical patterns, market supply-demand dynamics, ecosystem developments, and macroeconomic conditions to provide investors with professional price forecasts and practical investment strategies.
I. NBOT Price History Review and Market Status
NBOT Historical Price Evolution Trajectory
- 2019: Naka chain independent blockchain platform launched in January, NBOT token merged from previous BOT and BOE projects, price reached historical high of $0.076389 in June
- 2020: Market experienced significant correction, price dropped to historical low of $0.00190929 in March
- 2021-2025: Price remained relatively stable within a range, demonstrating resilience through various market cycles
NBOT Current Market Situation
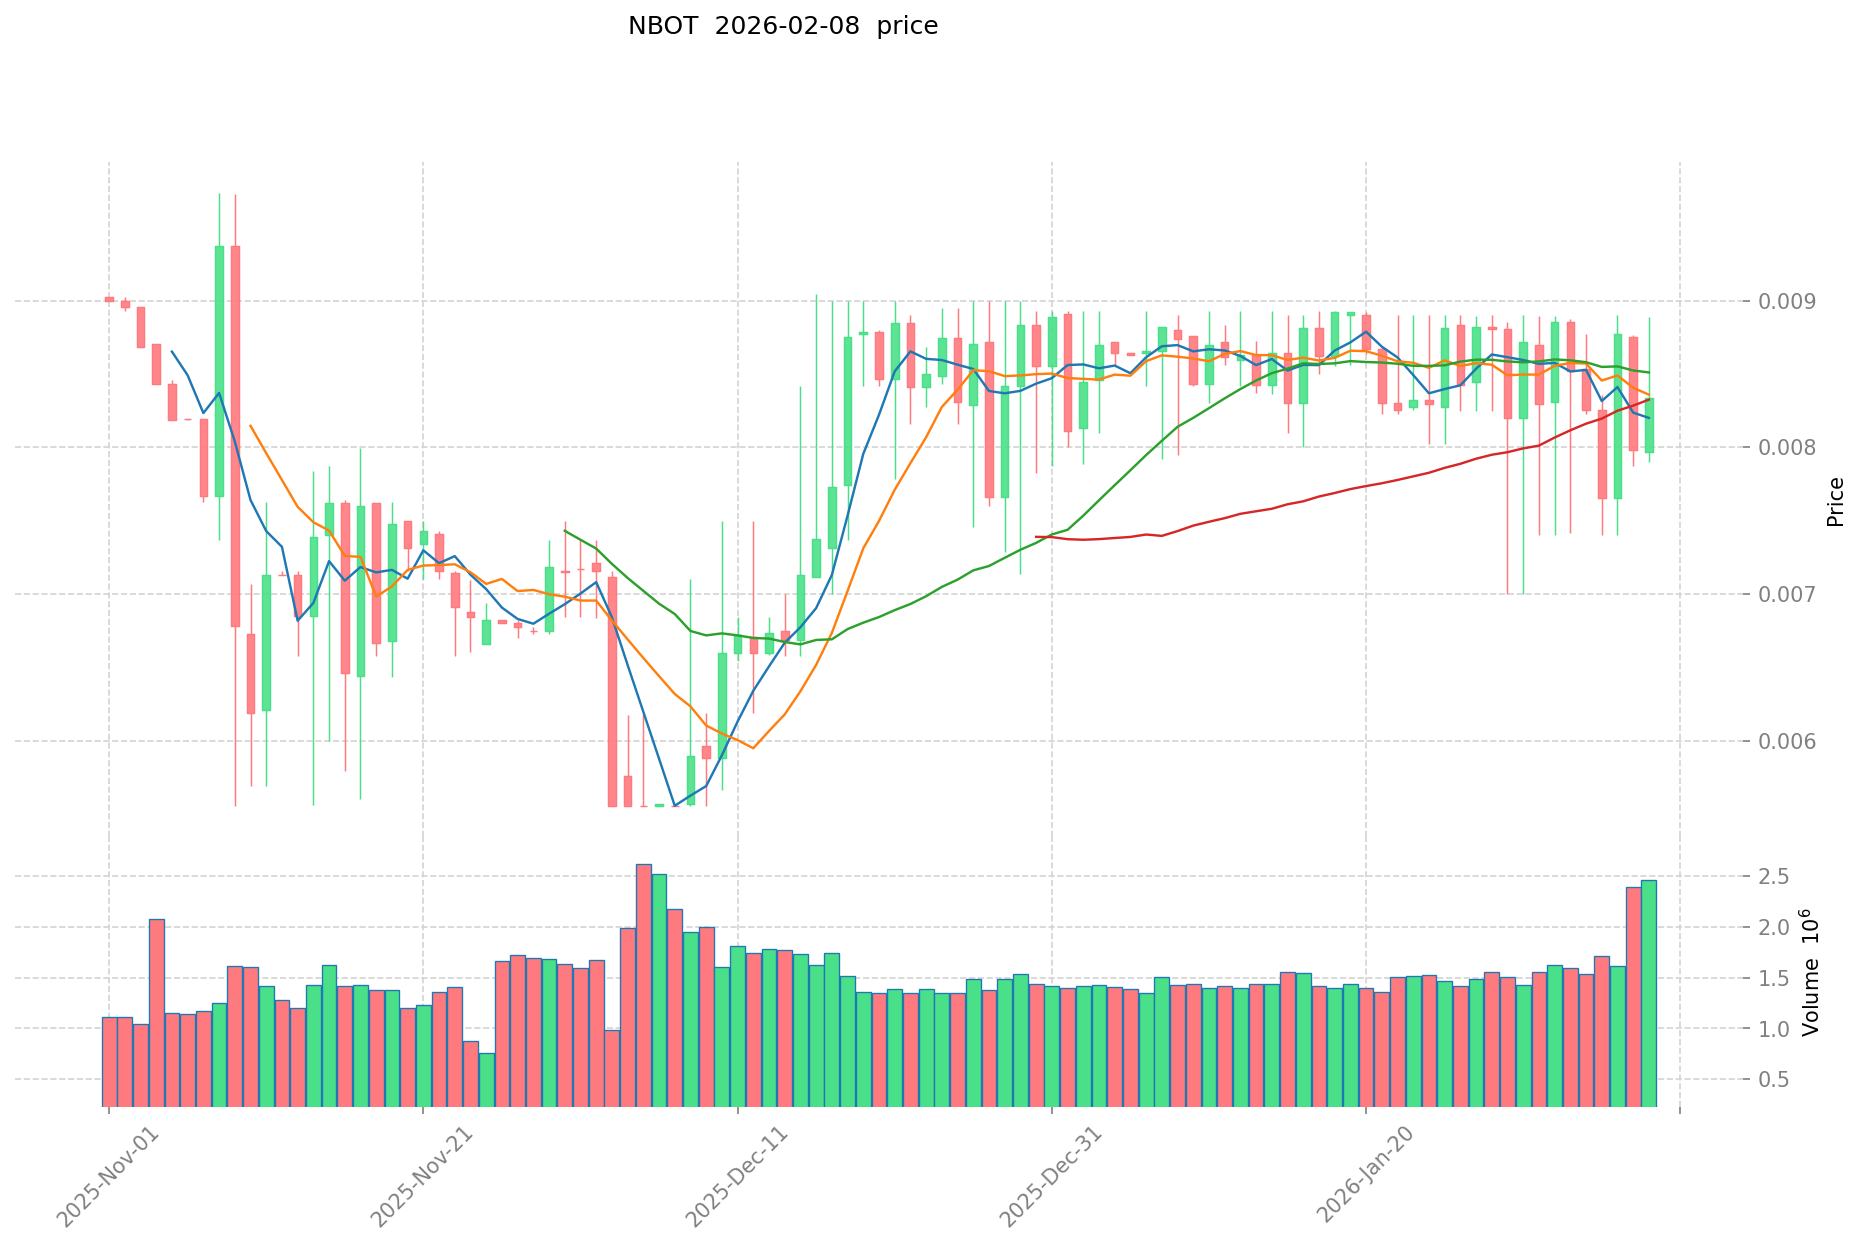
As of February 09, 2026, NBOT is trading at $0.0086, showing a slight decline of 2.47% over the past 24 hours. The token demonstrated modest positive momentum with a 1.18% increase over the past 7 days and 1.87% gain over the past 30 days. Notably, NBOT has shown substantial growth over the past year with a 127.45% increase.
The current market capitalization stands at approximately $183,458, with a 24-hour trading volume of $11,436. The circulating supply represents 21.33% of the maximum supply of 100 million tokens, with 21.33 million NBOT currently in circulation. The market cap to fully diluted valuation ratio of 21.33% indicates significant potential token supply yet to enter circulation.
NBOT's intraday trading range fluctuated between $0.007631 and $0.008885, reflecting moderate volatility. The token holder count stands at 787, suggesting a relatively concentrated community base. Current market sentiment indicator shows extreme fear at level 7.
Click to view current NBOT market price
NBOT Market Sentiment Index
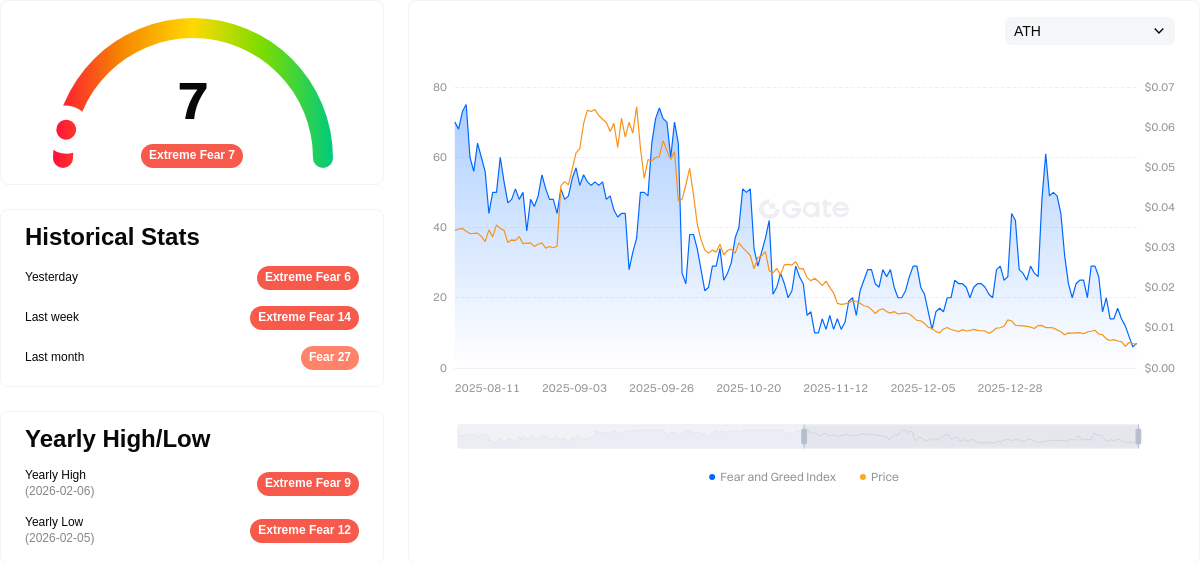
2026-02-08 Fear and Greed Index: 7 (Extreme Fear)
Click to view current Fear & Greed Index
The cryptocurrency market is currently experiencing extreme fear, with the Fear and Greed Index plummeting to just 7. This reading indicates widespread investor panic and significant market pessimism. During such periods, risk assets typically face heavy selling pressure as traders rush to reduce exposure. However, extreme fear often presents contrarian opportunities for long-term investors, as market dislocations can create attractive entry points. It's crucial to remain disciplined, conduct thorough research, and avoid making emotionally-driven decisions. Consider dollar-cost averaging strategies to mitigate timing risks during volatile market conditions.
NBOT Holding Distribution
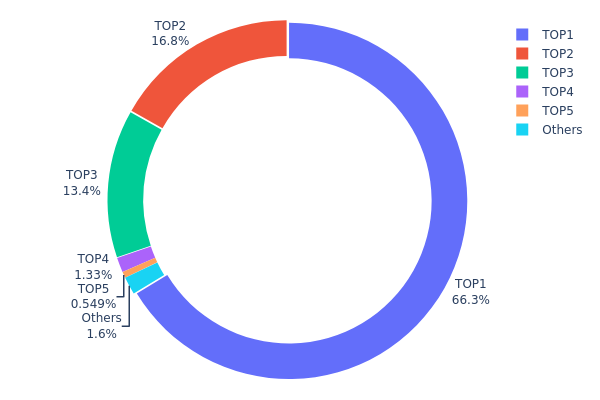
The holding distribution chart reveals the allocation of NBOT tokens across different wallet addresses, serving as a critical indicator of token concentration and decentralization levels. According to the latest on-chain data, NBOT exhibits a highly concentrated holding pattern that warrants careful examination.
The top address controls 66.29% of the total supply (66,294.10K tokens), while the second and third largest holders possess 16.81% and 13.40% respectively. Collectively, the top three addresses account for approximately 96.5% of all circulating NBOT tokens, indicating an extremely centralized distribution structure. The remaining addresses, including the fourth and fifth largest holders, control only 3.5% combined, with other scattered addresses holding a mere 1.63%.
This concentration level presents significant implications for market dynamics. The dominance of a single address controlling two-thirds of the supply creates substantial risks related to price manipulation, as large-scale sell-offs could trigger severe market volatility. Additionally, such centralization undermines the fundamental decentralization principles of cryptocurrency, potentially affecting investor confidence and long-term project sustainability. The limited distribution among retail holders suggests restricted liquidity and increased vulnerability to whale movements, which may result in amplified price swings during periods of market stress.
Click to view current NBOT Holding Distribution
| Top | Address | Holding Qty | Holding (%) |
|---|---|---|---|
| 1 | 0xd6a8...e8c960 | 66294.10K | 66.29% |
| 2 | 0x0d07...b492fe | 16815.05K | 16.81% |
| 3 | 0x2b72...cb33cb | 13407.32K | 13.40% |
| 4 | 0xfd4d...2cebc4 | 1333.16K | 1.33% |
| 5 | 0xbc4b...205b9d | 549.35K | 0.54% |
| - | Others | 1601.02K | 1.63% |
II. Core Factors Influencing NBOT's Future Price
Supply Mechanism
- Market Supply Dynamics: NBOT's future price trajectory is significantly influenced by its supply structure and distribution patterns. The token's supply mechanism plays a crucial role in determining scarcity levels and market availability.
- Historical Patterns: Supply-demand dynamics have historically demonstrated substantial impact on NBOT's price movements, with periods of constrained supply typically correlating with upward price pressure.
- Current Impact: Market participants should monitor ongoing supply developments, as changes in token distribution and circulation could materially affect price discovery mechanisms in the near term.
Institutional and Major Holder Dynamics
- Institutional Holdings: NBOT exhibits a relatively decentralized holder base, with approximately 78% of tokens held by community participants rather than concentrated among major institutions. This distribution pattern suggests reduced susceptibility to single-entity market manipulation.
- Enterprise Adoption: Notable enterprise adoption remains a key variable for NBOT's valuation. The integration of NBOT into established business frameworks could provide fundamental support for long-term price appreciation.
- Regulatory Landscape: Policy developments at governmental and regulatory levels continue to represent a significant external factor that could influence NBOT's market positioning and adoption trajectory.
Macroeconomic Environment
- Monetary Policy Impact: Global monetary policy decisions, particularly those from major central banks, exert considerable influence on cryptocurrency markets broadly. Interest rate adjustments and liquidity conditions directly affect risk asset valuations, including NBOT.
- Inflation Dynamics: In environments characterized by persistent inflation pressures, cryptocurrencies may attract interest as alternative stores of value, though this relationship remains subject to broader market sentiment and macroeconomic stability.
- Geopolitical Considerations: International political developments and trade policy uncertainties can drive volatility across crypto markets, affecting investor risk appetite and capital allocation decisions that impact NBOT pricing.
Technology Development and Ecosystem Building
- Technical Infrastructure: Ongoing technical development and protocol enhancements within NBOT's underlying infrastructure could influence its competitive positioning and utility proposition over time.
- Ecosystem Applications: The expansion of decentralized applications and use cases within NBOT's ecosystem represents a fundamental value driver. Increased on-chain activity and real-world utility could support sustained demand for the token.
- Integration Potential: NBOT's ability to achieve integration with third-party platforms and applications will likely play a material role in determining its long-term adoption curve and market valuation.
III. 2026-2031 NBOT Price Prediction
2026 Outlook
- Conservative Forecast: $0.00722 - $0.0086
- Neutral Forecast: Around $0.0086
- Optimistic Forecast: Up to $0.01144 (requires favorable market conditions and increased adoption)
2027-2029 Mid-term Outlook
- Market Stage Expectation: NBOT may enter a gradual growth phase, with price volatility potentially decreasing as the project matures and user base expands
- Price Range Predictions:
- 2027: $0.00741 - $0.01162, with an average around $0.01002
- 2028: $0.00963 - $0.01115, with an average around $0.01082
- 2029: $0.00912 - $0.01252, with an average around $0.01098
- Key Catalysts: Potential drivers include technological developments within the project ecosystem, strategic partnerships, broader crypto market sentiment, and regulatory clarity in key jurisdictions
2030-2031 Long-term Outlook
- Baseline Scenario: $0.00917 - $0.01293 in 2030 (assuming steady ecosystem development and stable market conditions)
- Optimistic Scenario: $0.00753 - $0.01493 by 2031 (contingent upon successful implementation of major upgrades and increased institutional interest)
- Transformative Scenario: Prices approaching the upper range of $0.01493 (requires exceptional adoption rates, significant technological breakthroughs, and highly favorable regulatory environment)
- February 9, 2026: NBOT trading within the projected range of $0.00722 - $0.01144 (subject to current market dynamics)
| Year | Predicted High Price | Predicted Average Price | Predicted Low Price | Price Change |
|---|---|---|---|---|
| 2026 | 0.01144 | 0.0086 | 0.00722 | 0 |
| 2027 | 0.01162 | 0.01002 | 0.00741 | 16 |
| 2028 | 0.01115 | 0.01082 | 0.00963 | 25 |
| 2029 | 0.01252 | 0.01098 | 0.00912 | 27 |
| 2030 | 0.01293 | 0.01175 | 0.00917 | 36 |
| 2031 | 0.01493 | 0.01234 | 0.00753 | 43 |
IV. NBOT Professional Investment Strategy and Risk Management
NBOT Investment Methodology
(I) Long-term Holding Strategy
- Suitable for: Long-term crypto investors seeking exposure to DeFi prediction market platforms
- Operational Recommendations:
- Consider dollar-cost averaging to mitigate entry price volatility
- Monitor NBOT's DeFi ecosystem development, particularly Deerfi.com platform adoption
- Storage Solution: Use Gate Web3 Wallet for secure custody of NBOT (ERC20) tokens with full control over private keys
(II) Active Trading Strategy
- Technical Analysis Tools:
- Volume Analysis: Monitor daily trading volume trends (current 24h volume approximately 11,436 USDT) for liquidity assessment
- Moving Averages: Track short-term (7-day: +1.18%) and medium-term (30-day: +1.87%) price momentum
- Swing Trading Considerations:
- Consider the relatively low circulating supply (21.33% of max supply) which may contribute to price volatility
- Monitor daily price ranges (24h high: 0.008885 USDT, low: 0.007631 USDT) to identify potential entry and exit points
NBOT Risk Management Framework
(I) Asset Allocation Principles
- Conservative Investors: 1-2% of crypto portfolio allocation
- Moderate Investors: 3-5% of crypto portfolio allocation
- Professional Investors: May consider up to 5-10% based on risk tolerance and market research
(II) Risk Hedging Approaches
- Diversification Strategy: Maintain exposure across multiple DeFi protocols and blockchain platforms to reduce concentration risk
- Position Sizing: Implement strict position limits based on NBOT's market capitalization (approximately 183,458 USDT) and liquidity constraints
(III) Security Storage Solutions
- Hot Wallet Option: Gate Web3 Wallet for convenient access to DeFi features while maintaining security
- Cold Storage Solution: Consider hardware wallet options for long-term holdings exceeding daily transaction needs
- Security Precautions: Always verify contract address (0x09Ccd2DA5dCDd0510268d4979e792381337138b8 on Ethereum), enable two-factor authentication, and never share private keys
V. NBOT Potential Risks and Challenges
NBOT Market Risks
- Liquidity Risk: With limited trading volume and availability on only one exchange, NBOT may face challenges in executing large orders without significant price impact
- Price Volatility: Historical price range from 0.00190929 USDT to 0.076389 USDT demonstrates substantial volatility potential
- Market Cap Risk: Relatively small market capitalization (approximately 183,458 USDT) and market dominance (0.000033%) may contribute to higher price sensitivity
NBOT Regulatory Risks
- DeFi Platform Oversight: Evolving regulatory frameworks for decentralized prediction markets and synthetic asset exchanges may impact NBOT's use cases
- Cross-border Compliance: Operations spanning multiple jurisdictions may face varying regulatory requirements affecting platform functionality
- Token Classification: Potential regulatory scrutiny regarding NBOT's classification and its derivative trading features on Deerfi.com
NBOT Technical Risks
- Smart Contract Vulnerability: As an ERC20 token integrated with DeFi protocols, NBOT faces potential smart contract exploitation risks
- Platform Dependency: NBOT's utility is closely tied to the Naka chain infrastructure and Deerfi.com platform performance
- Merger Complexity: The token's origin from merging BOT and BOE projects may present legacy technical considerations
VI. Conclusion and Action Recommendations
NBOT Investment Value Assessment
NBOT represents a specialized DeFi prediction market token with a focused use case on the Naka chain and Deerfi.com platform. While the project offers unique features such as coin-margined derivative trading and liquidity provision opportunities, investors should carefully consider the token's limited liquidity, small market capitalization, and concentration risk. The one-year performance (+127.45%) suggests market interest, but the current low trading volume and single-exchange availability may present both opportunity and risk for different investor profiles.
NBOT Investment Recommendations
✅ Beginners: Start with minimal allocation (under 1% of portfolio) to understand the project's DeFi ecosystem and monitor platform development before increasing exposure ✅ Experienced Investors: Consider selective exposure (2-5% allocation) with focus on risk management, given the token's specialized use case and liquidity constraints ✅ Institutional Investors: Conduct thorough due diligence on platform infrastructure, smart contract audits, and regulatory compliance before considering strategic positions
NBOT Trading Participation Methods
- Spot Trading: Access NBOT trading on Gate.com to establish positions based on market analysis and risk tolerance
- DeFi Participation: Explore Deerfi.com platform features including BTC/ETH long positions and liquidity pool participation for fee revenue
- Secure Storage: Utilize Gate Web3 Wallet for managing NBOT holdings with integrated DeFi access
Cryptocurrency investment carries extremely high risk, and this article does not constitute investment advice. Investors should make prudent decisions based on their own risk tolerance and are advised to consult professional financial advisors. Never invest more than you can afford to lose.
FAQ
What is NBOT? What are its main uses and features?
NBOT is an AI assistant that monitors news and social media in real-time, delivering concise news summaries. Its main purpose is helping users quickly access the latest information across networks, blogs, and forums with accurate, streamlined updates.
What factors affect NBOT price?
NBOT price is influenced by macroeconomic conditions, monetary policy, interest rate changes, geopolitical factors, inflation environment, trading volume, market sentiment, and overall crypto market trends.
How to predict NBOT price? What analysis methods are available?
Analyze NBOT prices using historical data, market trends, and transaction volume. Key methods include regression analysis and time series forecasting to estimate future price movements based on past performance patterns.
What is the historical price trend of NBOT?
NBOT has shown strong upward momentum. In the past 24 hours, it rose 0.82%, 7 days up 6.66%, 30 days up 18.48%, 3 months up 87.26%, and 6 months up 125.55%.
What are the risks of investing in NBOT for price prediction?
NBOT investment carries market volatility, price manipulation risks, regulatory uncertainty, and technical security vulnerabilities. Market conditions and policy changes may significantly impact investment returns.
What are the advantages and disadvantages of NBOT compared to similar tokens?
NBOT provides advanced MEV protection and intuitive interface for trading automation. It supports multiple DEXs enabling optimal trading strategies across chains. However, it has relatively limited community support compared to more established competitors in the trading bot space.
Share
Content
Introduction: NBOT's Market Position and Investment Value
I. NBOT Price History Review and Market Status
II. Core Factors Influencing NBOT's Future Price
III. 2026-2031 NBOT Price Prediction
IV. NBOT Professional Investment Strategy and Risk Management
V. NBOT Potential Risks and Challenges
VI. Conclusion and Action Recommendations
FAQ
How to Buy Cryptocurrency


Trending Cryptocurrencies


2025 SUI coin: price, buying guide, and Staking rewards

How to Buy Crypto: A Step-by-Step Guide with Gate.com

HNT Price in 2025: Helium Network Token Value and Market Analysis
What is SwissCheese (SWCH) and How Does It Democratize Investment?

Cardano (ADA) Price Analysis and Outlook for 2025
How to Invest in Metaverse Crypto

Games You Can Earn Money From – TOP 11 Games in 2025

How to Choose and Set Up the Best Cryptocurrency Wallet in Recent Years

NANO/XNO Cryptocurrency Project: Future Prospects and Analysis

A Guide to Getting Started with Web3.0: Key Benefits and Future Prospects Explained

Top 7 Metaverse Games for Play-to-Earn Gaming