This comprehensive analysis examines Rejuve Token (RJV), a distributed AI-driven longevity research network token currently trading at $0.00146 with a market cap of $782,305. The article delivers professional price forecasts spanning 2026-2031, incorporating historical patterns, supply-demand dynamics, and ecosystem development. Key sections cover RJV's significant 99% decline from its $0.143693 peak, current market sentiment amid extreme fear conditions, and detailed price predictions ranging from conservative to optimistic scenarios. The guide provides actionable investment strategies including long-term holding and active trading approaches, comprehensive risk management frameworks suitable for different investor profiles, and critical analysis of market, regulatory, and technical risks. Ideal for investors seeking data-driven insights into RJV's growth potential and practical strategies for portfolio management on Gate exchange.
Introduction: RJV's Market Position and Investment Value
Rejuve Token (RJV), positioned as a distributed artificial intelligence-driven longevity research network token, has been facilitating decentralized health data monetization and longevity research since its launch in 2023. As of 2026, RJV maintains a market capitalization of approximately $782,305, with a circulating supply of around 535.83 million tokens, and a price hovering at $0.00146. This asset, recognized as a pioneering solution in the intersection of blockchain technology and health data management, is playing an increasingly significant role in democratizing access to longevity research and enabling individuals to monetize their health data.
This article will comprehensively analyze RJV's price trends from 2026 to 2031, incorporating historical patterns, market supply and demand dynamics, ecosystem development, and macroeconomic factors to provide investors with professional price forecasts and practical investment strategies.
I. RJV Price History Review and Market Status
RJV Historical Price Evolution Trajectory
- March 2023: RJV reached its all-time high (ATH) of $0.143693 on March 20, 2023, shortly after its initial launch
- 2023-2025: The token experienced significant market correction along with broader crypto market cycles
- February 2026: RJV recorded its all-time low (ATL) of $0.00113319 on February 2, 2026, representing a decline of over 99% from its peak
RJV Current Market Status
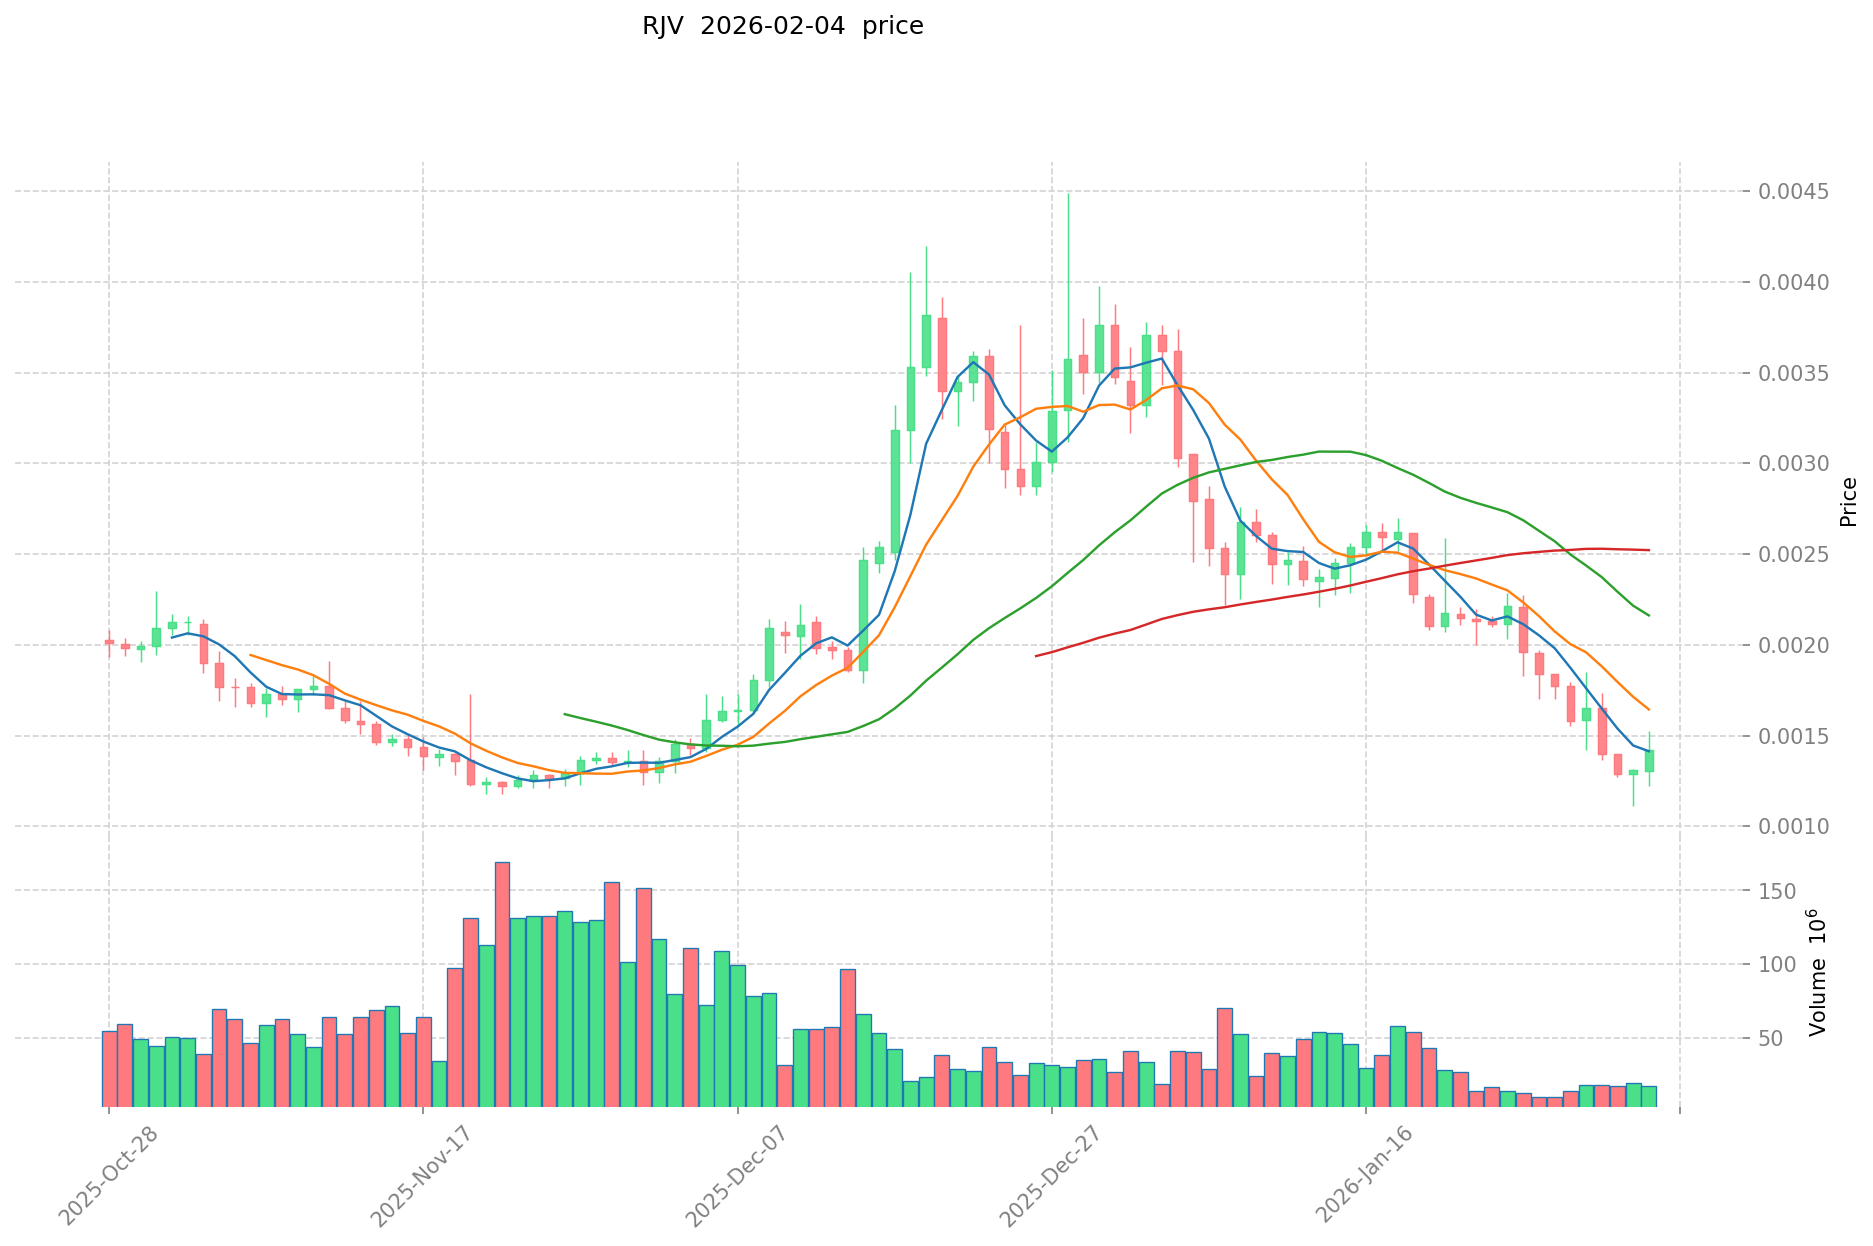
As of February 4, 2026, RJV is trading at $0.00146, showing a 24-hour increase of 9.19% with trading volume of $22,010.65. The token's intraday range spans from $0.001224 to $0.001569.
RJV currently holds a market ranking of #2688 with a circulating supply of 535,825,511.52 tokens (53.58% of the 1 billion total supply). The circulating market capitalization stands at approximately $782,305, while the fully diluted market cap is $1,460,000. The token maintains a market dominance of 0.000053%.
Despite the recent 24-hour gains, RJV has experienced substantial declines across longer timeframes: down 20.4% over the past week, down 47.59% over the past month, and down 86.25% over the past year. The token is deployed across multiple blockchain networks including Ethereum (ETH), Cardano (ADA), and BNB Smart Chain (BSC), with approximately 1,738 token holders and availability on 5 exchanges.
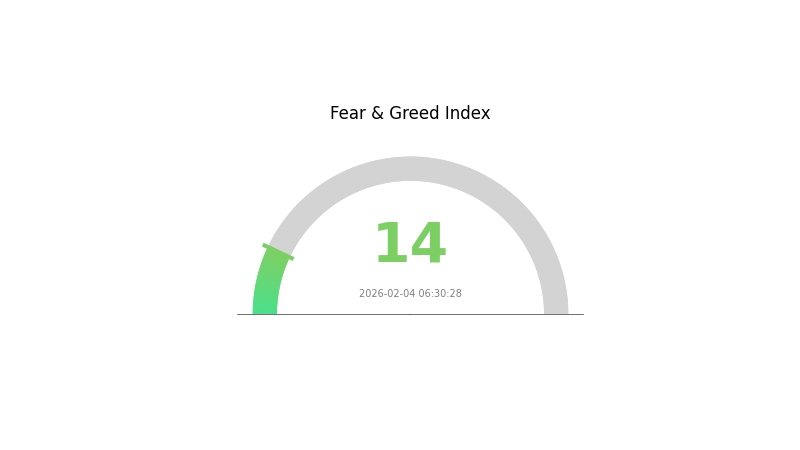
The current Crypto Fear & Greed Index registers at 14, indicating "Extreme Fear" in the broader cryptocurrency market, which may be influencing RJV's price performance alongside sector-specific factors related to the longevity research and AI healthcare data space.
Click to view current RJV market price
RJV Market Sentiment Indicator
2026-02-04 Fear and Greed Index: 14 (Extreme Fear)
Click to view current Fear & Greed Index
The cryptocurrency market is currently experiencing extreme fear, with the Fear and Greed Index standing at 14. This exceptionally low reading indicates severe market pessimism and heightened investor anxiety. During such periods, market participants typically adopt a highly cautious approach, with selling pressure dominating trading activity. Extreme fear often presents contrarian opportunities for long-term investors, as assets may become oversold. However, caution remains prudent as further downside pressure could emerge before stabilization occurs.
RJV Holding Distribution
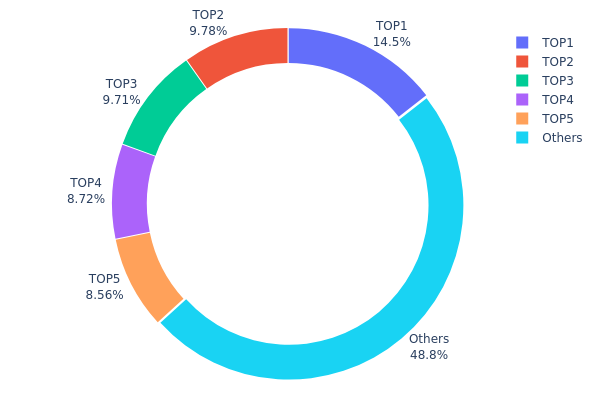
The holding distribution chart represents the concentration of token holdings across different wallet addresses, providing insights into the decentralization level and potential market influence of major holders. By analyzing the distribution of RJV tokens among top addresses, we can assess the project's ownership structure and evaluate potential risks associated with concentrated holdings.
Based on the current data, RJV exhibits a moderately high concentration pattern. The top five addresses collectively hold approximately 51.22% of the total token supply, with the largest single address controlling 14.46% (75,000K tokens). The second and third largest addresses hold 9.78% and 9.70% respectively, while addresses ranked fourth and fifth maintain 8.72% and 8.56%. The remaining 48.78% is distributed among other addresses, suggesting a relatively balanced secondary distribution layer beyond the major holders.
This concentration level indicates a semi-centralized token structure that warrants careful monitoring. While the largest holder's 14.46% stake is significant, it does not represent absolute control, and the relatively even distribution among the top five addresses (ranging from 8.56% to 14.46%) suggests no single entity possesses overwhelming market influence. However, the combined holdings of top five addresses exceeding 51% creates potential vulnerability to coordinated actions or price manipulation. Such concentration could amplify volatility during periods of major holder activity, as large-scale transfers or sales from these addresses may trigger significant price movements.
Click to view current RJV Holding Distribution
| Top |
Address |
Holding Qty |
Holding (%) |
| 1 |
0x85dc...a25b4a |
75000.00K |
14.46% |
| 2 |
0xb801...62b0a3 |
50705.69K |
9.78% |
| 3 |
0x9642...2f5d4e |
50326.88K |
9.70% |
| 4 |
0x2f90...1eee60 |
45210.23K |
8.72% |
| 5 |
0xb7cc...1b9ddc |
44390.57K |
8.56% |
| - |
Others |
252761.06K |
48.78% |
II. Core Factors Influencing RJV's Future Price
Market Sentiment and Investor Confidence
- Sentiment Impact: Investor emotions and confidence directly affect RJV's price trajectory. Market reactions to news regarding widespread adoption or significant technological breakthroughs can trigger considerable price movements.
- Volatility Characteristics: RJV exhibits high volatility, requiring investors to closely monitor market dynamics and sentiment shifts that may influence short-term price action.
- Information-Driven Changes: Unexpected information and market news can lead to sharp price fluctuations, as investor sentiment responds rapidly to new developments in the project's ecosystem.
Supply and Demand Dynamics
- Market Psychology: Retail investor behavior tends to favor assets that have not yet experienced significant price increases, creating natural rotation patterns within related asset categories. Position data can provide valuable insights into these behavioral trends.
- Price Discovery Mechanism: The fundamental nature of market trading involves continuous repricing of related assets. Supply and demand imbalances in the market can create opportunities for price adjustments as participants reassess RJV's value proposition.
- Trading Activity: Market liquidity and trading volumes play essential roles in determining price stability and the ability of the asset to absorb buying or selling pressure.
Technological Progress and Development
- Innovation Impact: Technological advancements and improvements to RJV's underlying infrastructure may influence investor confidence and market valuation. Progress in the project's technological capabilities could serve as catalysts for price movement.
- Adoption Metrics: The pace and breadth of RJV adoption within its target markets represent important indicators that may correlate with price performance over time.
Policy and Regulatory Environment
- Regulatory Changes: Policy developments and regulatory framework adjustments in relevant jurisdictions may affect market participants' ability to trade and hold RJV, potentially impacting price dynamics.
- Market Strategy Adjustments: Participants may need to adapt their strategies in response to evolving regulatory landscapes and policy announcements that affect cryptocurrency markets broadly.
III. 2026-2031 RJV Price Prediction
2026 Outlook
- Conservative forecast: $0.00099 - $0.00146
- Neutral forecast: $0.00146 (average price level)
- Optimistic forecast: $0.00178 (requiring favorable market conditions and increased trading volume)
2027-2029 Mid-term Outlook
- Market stage expectation: RJV may enter a gradual growth phase with moderate volatility as the project matures and gains wider market recognition
- Price range forecast:
- 2027: $0.00100 - $0.00172 (approximately 10% potential growth)
- 2028: $0.00137 - $0.00232 (approximately 14% potential growth)
- 2029: $0.00106 - $0.00255 (approximately 36% potential growth)
- Key catalysts: Potential technological developments, ecosystem expansion, and broader cryptocurrency market trends may serve as primary drivers for price movement
2030-2031 Long-term Outlook
- Baseline scenario: $0.00189 - $0.00227 in 2030 (assuming steady project development and stable market conditions)
- Optimistic scenario: $0.00242 - $0.00322 by 2031 (assuming successful implementation of roadmap milestones and increased adoption)
- Transformative scenario: Reaching upper price targets would require exceptional market conditions, significant partnerships, or breakthrough technological achievements
- February 4, 2026: RJV trading within the predicted range of $0.00099 - $0.00178 (current market positioning phase)
| Year |
Predicted High Price |
Predicted Average Price |
Predicted Low Price |
Price Change |
| 2026 |
0.00178 |
0.00146 |
0.00099 |
0 |
| 2027 |
0.00172 |
0.00162 |
0.001 |
10 |
| 2028 |
0.00232 |
0.00167 |
0.00137 |
14 |
| 2029 |
0.00255 |
0.00199 |
0.00106 |
36 |
| 2030 |
0.00305 |
0.00227 |
0.00189 |
55 |
| 2031 |
0.00322 |
0.00266 |
0.00242 |
82 |
IV. RJV Professional Investment Strategy and Risk Management
RJV Investment Methodology
(1) Long-term Holding Strategy
- Suitable for: Investors interested in decentralized longevity research and health data monetization with a focus on long-term project development
- Operational Recommendations:
- Consider accumulating positions during market corrections while monitoring project milestones in the Rejuve.AI network development
- Review quarterly progress in the decentralized research network expansion and partnerships with clinics and researchers
- Store assets in Gate Web3 Wallet for secure management with multi-signature protection options
(2) Active Trading Strategy
- Technical Analysis Tools:
- Moving Averages: Use 50-day and 200-day moving averages to identify trend reversals; RJV currently shows short-term volatility with a 7-day decline of approximately 20%
- Volume Analysis: Monitor 24-hour trading volume ($22,010.65) relative to market cap ($782,305.25) to gauge liquidity conditions
- Swing Trading Key Points:
- Set stop-loss orders below recent support levels; recent low of $0.001224 may serve as a reference
- Take partial profits during upward momentum phases, as demonstrated by the 9.19% 24-hour gain
RJV Risk Management Framework
(1) Asset Allocation Principles
- Conservative Investors: 1-3% of crypto portfolio allocation
- Active Investors: 3-5% allocation with regular rebalancing
- Professional Investors: Up to 10% allocation with active risk monitoring
(2) Risk Hedging Solutions
- Portfolio Diversification: Combine RJV holdings with stablecoins and established cryptocurrencies to reduce volatility exposure
- Position Sizing: Limit single-trade exposure to no more than 2-3% of total portfolio value given the token's lower market cap
(3) Secure Storage Solutions
- Hot Wallet Option: Gate Web3 Wallet for active trading and daily transactions with convenient access
- Cold Storage Solution: Hardware wallet storage for long-term holdings exceeding $1,000 equivalent
- Security Precautions: Enable two-factor authentication, regularly update wallet software, and never share private keys or seed phrases
V. RJV Potential Risks and Challenges
RJV Market Risks
- High Volatility: RJV has experienced significant price fluctuations with a 30-day decline of 47.59% and 1-year decline of 86.25%
- Limited Liquidity: With a 24-hour trading volume of approximately $22,011, larger trades may experience slippage
- Market Cap Concentration: Current market cap represents only 53.58% of fully diluted valuation, suggesting potential dilution concerns
RJV Regulatory Risks
- Health Data Regulations: The project's focus on health data monetization may face evolving privacy regulations across different jurisdictions
- Token Classification Uncertainty: Regulatory frameworks for tokens tied to health research networks remain under development in many regions
- Cross-border Compliance: The decentralized global network of researchers and clinics may encounter varying compliance requirements
RJV Technical Risks
- Network Development Risks: The success of Rejuve.AI depends on continuous development and adoption of its decentralized research platform
- Smart Contract Vulnerabilities: RJV operates across multiple chains (ETH, ADA, BSC), each carrying potential smart contract security concerns
- Adoption Challenges: The project requires participation from researchers, clinics, and data contributors, creating dependencies on ecosystem growth
VI. Conclusion and Action Recommendations
RJV Investment Value Assessment
Rejuve Token represents an innovative approach to decentralized longevity research and health data monetization. The project's mission to democratize access to anti-aging research while allowing individuals to monetize their health data addresses a potentially significant market opportunity. However, the token faces considerable challenges including substantial price declines over the past year, limited liquidity, and relatively small market capitalization. The long-term value proposition depends on successful execution of the decentralized research network and meaningful adoption by researchers, clinics, and data contributors. Short-term risks include continued price volatility, limited trading depth, and the early-stage nature of the project.
RJV Investment Recommendations
✅ Beginners: Consider starting with educational research into the project fundamentals before investing; if proceeding, limit allocation to 1-2% of crypto portfolio and use only funds you can afford to lose
✅ Experienced Investors: May consider small strategic positions with tight risk management protocols; monitor project development milestones and network growth metrics
✅ Institutional Investors: Conduct thorough due diligence on the Rejuve.AI ecosystem, team credentials, and competitive landscape before considering allocation
RJV Trading Participation Methods
- Spot Trading: Direct purchase and sale of RJV tokens on Gate.com with immediate settlement
- Dollar-Cost Averaging: Systematic periodic purchases to reduce timing risk and smooth entry prices over time
- Limit Orders: Place buy orders below current market price and sell orders at target profit levels to optimize entry and exit points
Cryptocurrency investment carries extremely high risk, and this article does not constitute investment advice. Investors should make prudent decisions based on their own risk tolerance and are advised to consult professional financial advisors. Never invest more than you can afford to lose.
FAQ
What is RJV? What are its uses and value?
RJV is a cryptocurrency token designed for the Web3 ecosystem. It serves as a utility token enabling decentralized transactions and smart contract interactions. RJV holds value through its network utility, limited supply mechanism, and growing adoption in blockchain applications, making it a valuable asset for participants in the decentralized finance space.
RJV experienced rapid growth at its initial launch in 2021, followed by significant volatility including a major decline in 2022 and modest recovery in 2023. As of 2026, RJV maintains relatively stable price levels with established market positioning.
What is the RJV price prediction for 2024? What factors will affect its price?
RJV price predictions depend on multiple factors including market volatility, global economic conditions, adoption rates, and industry trends. Price movements are influenced by trading volume, regulatory changes, and sentiment shifts in the cryptocurrency market.
What are the risks of investing in RJV? How should I assess its safety?
RJV investment risks include market volatility and regulatory changes. Assess safety through financial metrics analysis, sensitivity testing of key variables, and scenario simulation. Use quantitative models combined with qualitative judgment to evaluate feasibility and determine investment viability.
What are the advantages and disadvantages of RJV compared to similar tokens?
RJV has achieved certain market scale but lacks mainstream exchange support, limiting trading volume and user base expansion. Its unique advantages remain unclear compared to established competitors.
What is RJV's total supply? How is the tokenomics designed?
RJV features a fixed total supply mechanism designed to ensure scarcity and value stability. The tokenomics allocates tokens across ecosystem participants including development, community rewards, and liquidity provisions. This balanced distribution model incentivizes long-term participation and sustainable growth within the RJV network.
* The information is not intended to be and does not constitute financial advice or any other recommendation of any sort offered or endorsed by Gate.