This comprehensive analysis examines Ready to Fight (RTF), a SocialFi token revolutionizing professional combat sports through blockchain technology, currently trading at $0.01383 with a $1.11 million market cap. The article reviews RTF's price trajectory from its $0.356 all-time high in April 2024 to its current levels, analyzing historical patterns and market dynamics. Expert predictions indicate RTF may trade between $0.01272-$0.01784 in 2026, potentially reaching $0.02917-$0.0318 by 2031 under favorable conditions. The analysis addresses key market factors including extreme concentration (92% holdings among top 5 addresses), limited liquidity ($13,056 daily volume), and regulatory uncertainties. Investment strategies range from long-term holding to active trading, with detailed risk management frameworks suitable for different investor profiles. Gate.com serves as the primary trading platform. While RTF presents opportunities in the emerging SocialFi sector, investors must carefully consider volatility, l
Introduction: RTF's Market Position and Investment Value
Ready to Fight (RTF), positioned as a revolutionary platform leveraging blockchain technology and SocialFi principles to transform the professional fighting industry, has been developing its ecosystem since its launch in 2024. As of February 2026, RTF maintains a market capitalization of approximately $1.11 million, with a circulating supply of around 80 million tokens and a trading price hovering near $0.01383. This asset, characterized as a bridge between traditional combat sports and decentralized technology, is playing an increasingly important role in connecting fighters, coaches, fans, and industry stakeholders.
This article will comprehensively analyze RTF's price trajectory from 2026 to 2031, combining historical patterns, market supply-demand dynamics, ecosystem development, and macroeconomic conditions to provide investors with professional price forecasts and practical investment strategies.
I. RTF Price History Review and Market Status
RTF Historical Price Evolution Trajectory
- 2024: RTF launched on Gate.com with a publish price of $0.1 in April, reaching its all-time high of $0.356 on April 24, 2024, demonstrating strong initial market interest.
- 2025: The token experienced significant volatility throughout the year, with price declining substantially from previous highs, reaching its all-time low of $0.00861 on November 22, 2025.
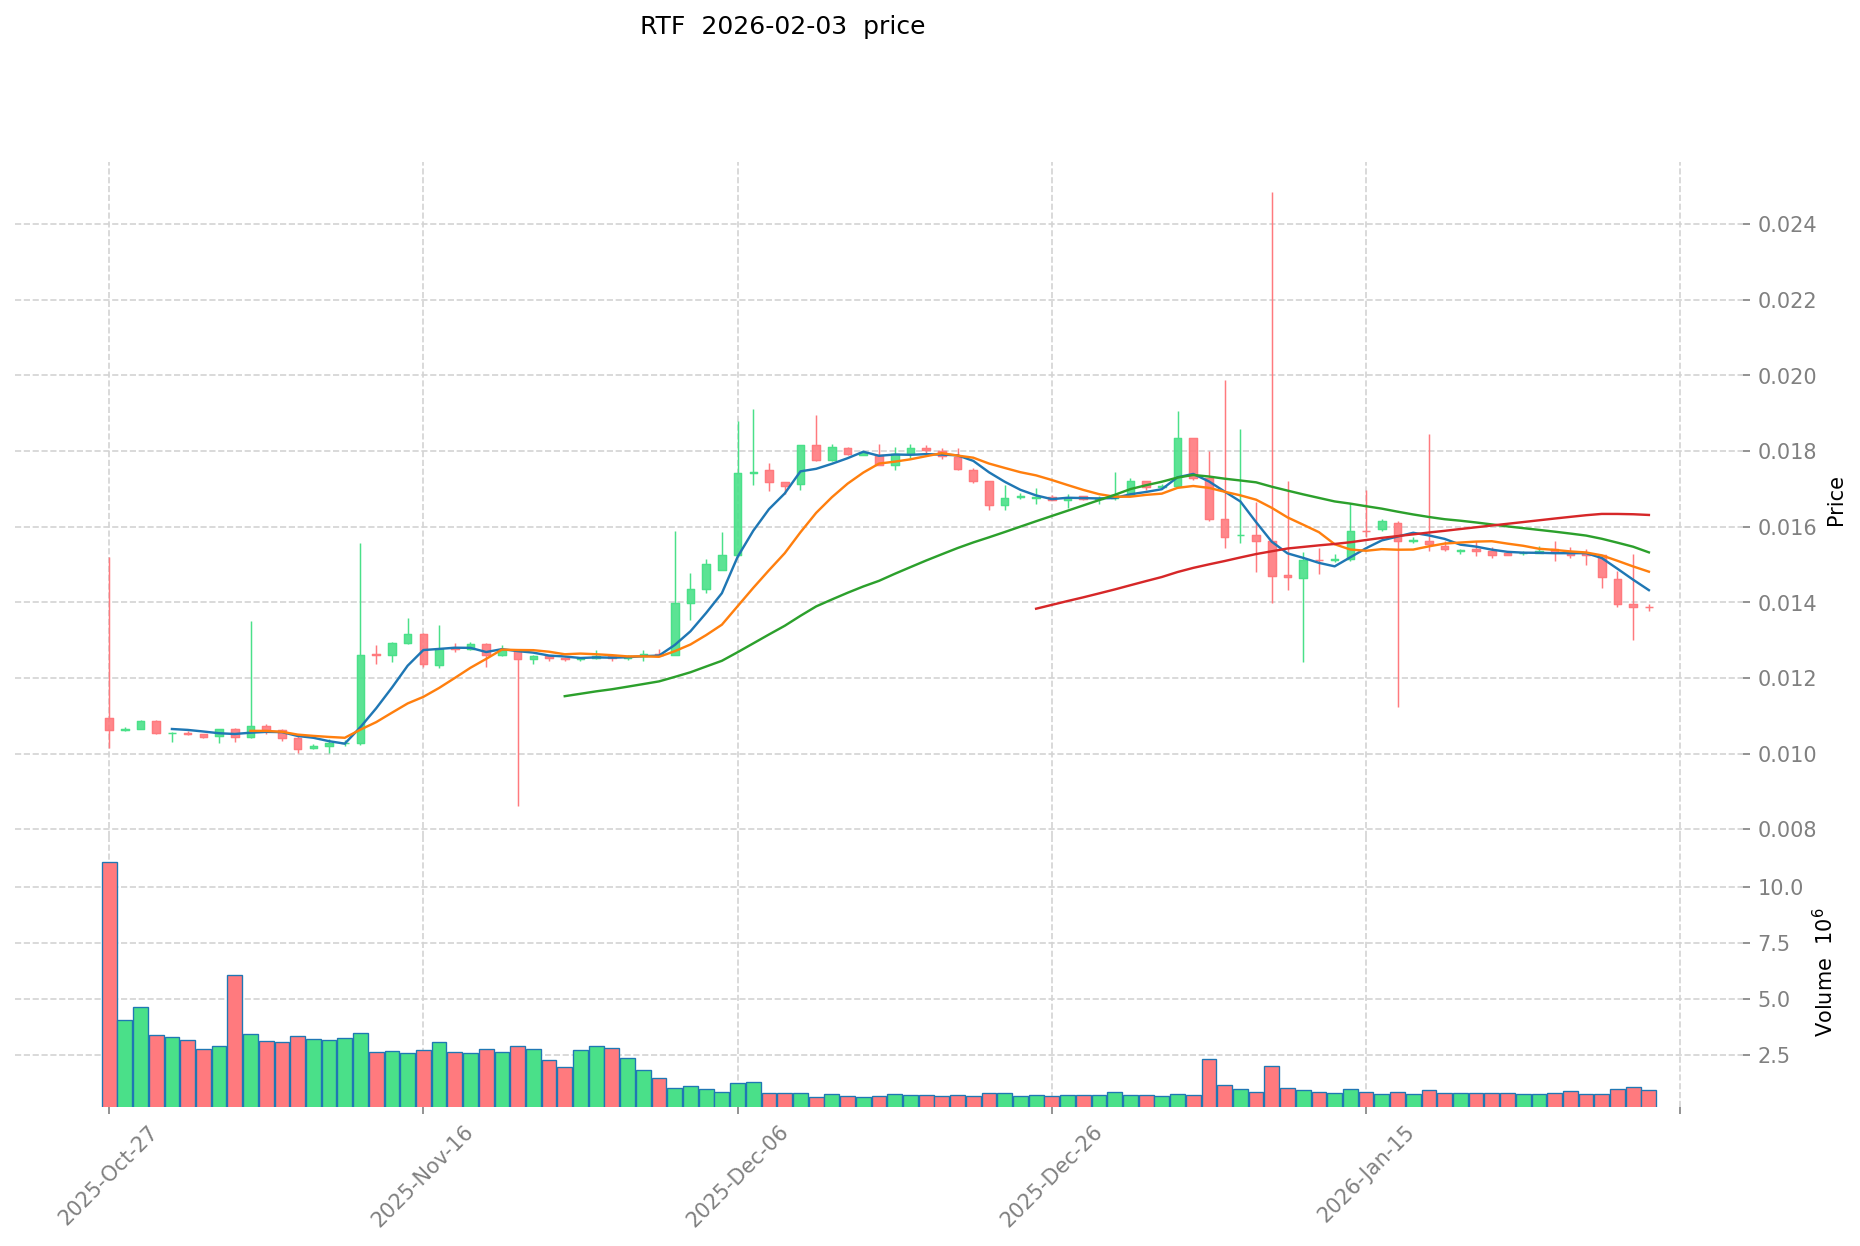
- 2026: As of early February 2026, RTF continues to trade at relatively subdued levels, with the current price at $0.01383, reflecting ongoing market adjustments.
RTF Current Market Status
As of February 3, 2026, RTF is trading at $0.01383, showing a slight decline of 0.28% over the past 24 hours. The token has experienced downward pressure across multiple timeframes, with a 10.02% decrease over the past 7 days and a 24.47% decline over the past 30 days. The 24-hour trading volume stands at $13,056.34, with prices ranging between $0.01378 and $0.01396.
The token's market capitalization is approximately $1.11 million, with a circulating supply of 80 million RTF tokens representing 20% of the total supply of 400 million tokens. The fully diluted market cap is valued at $5.53 million. RTF currently ranks #2447 in the cryptocurrency market with a dominance of 0.00020%. The token has approximately 4,464 holders and is listed on 3 exchanges. The market sentiment index indicates an "Extreme Fear" level at 17, reflecting cautious investor sentiment in the broader crypto market.
Click to view the current RTF market price
RTF Market Sentiment Index
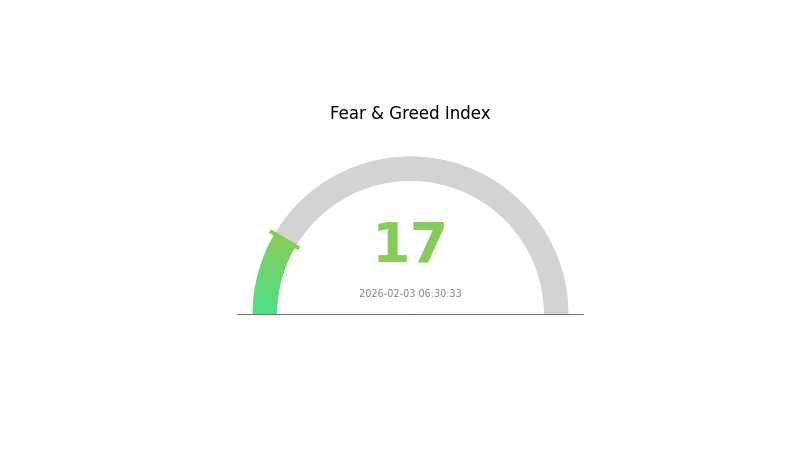
2026-02-03 Fear and Greed Index: 17 (Extreme Fear)
Click to view the current Fear & Greed Index
The cryptocurrency market is currently experiencing extreme fear with an index reading of 17. This significantly low reading indicates that market participants are highly pessimistic about near-term prospects. During such periods of extreme fear, historically savvy investors often view it as a potential buying opportunity, as assets tend to be undervalued. However, extreme fear can also precede further price declines, so investors should exercise caution and conduct thorough due diligence before making investment decisions. Monitor the index closely for potential trend reversals.
RTF Holding Distribution
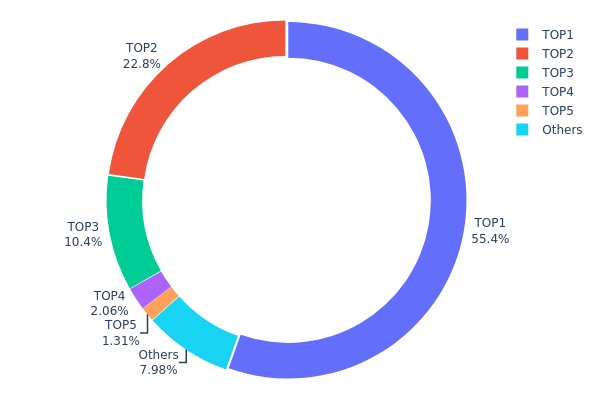
According to on-chain data, the top 5 addresses currently hold approximately 368,089.09K RTF tokens, accounting for 91.99% of the total circulating supply. Specifically, the largest holder controls 221,684.52K tokens (55.42%), while the second-largest address holds 91,146.96K tokens (22.78%). The third-ranked address possesses 41,758.05K tokens (10.43%), and the remaining top addresses collectively hold smaller percentages. The "Others" category represents only 8% of total holdings, indicating an extremely high concentration level in RTF's current distribution structure.
This highly concentrated holding pattern presents significant implications for market dynamics. With nearly 92% of tokens controlled by just five addresses, RTF exhibits characteristics of centralized ownership that could potentially amplify price volatility and expose the market to manipulation risks. Large holders possess substantial influence over trading volumes and price movements, as their buy or sell decisions could trigger dramatic market fluctuations. Additionally, such concentration may limit liquidity depth, making it challenging for regular traders to execute large orders without significant slippage.
From a decentralization perspective, RTF's current address distribution reveals structural vulnerabilities that warrant careful monitoring. While concentrated holdings are not uncommon in early-stage tokens or specific DeFi protocols, the extreme imbalance observed here suggests limited token dispersion across the broader community. This configuration could impact long-term network stability and governance decentralization, particularly if these major holders are affiliated entities rather than independent participants.
Click to view current RTF Holding Distribution
| Top |
Address |
Holding Qty |
Holding (%) |
| 1 |
0x9820...679734 |
221684.52K |
55.42% |
| 2 |
0x33ea...5d21fe |
91146.96K |
22.78% |
| 3 |
0xedd2...f43d05 |
41758.05K |
10.43% |
| 4 |
0x2e8f...725e64 |
8246.67K |
2.06% |
| 5 |
0xd971...3b670d |
5252.89K |
1.31% |
| - |
Others |
31910.92K |
8% |
II. Core Factors Influencing RTF's Future Price
Supply Mechanism
- Copper Foil Industry Overcapacity: The copper foil industry has experienced rapid capacity expansion in recent years, leading to severe overcapacity and supply-demand imbalances. This situation has resulted in intense price competition, causing copper foil processing fees to decline substantially and putting pressure on copper foil enterprises.
- Historical Pattern: Past supply increases in the copper foil sector have typically led to downward price pressure. When production capacity outpaces market demand, manufacturers face margin compression and pricing challenges.
- Current Impact: The industry is currently experiencing a bottom in processing fees, with some products showing slight increases. As market competition intensifies, capacity elimination is expected to be a future trend, with market share gradually concentrating toward leading enterprises.
Market Competition and Technological Innovation
- Competitive Landscape: The copper foil market faces fierce competition, with companies under pressure from declining processing fees, changes in supply-demand relationships, raw material price fluctuations, and overall economic conditions. Market participants are experiencing significant operational challenges.
- Technology Development: Companies are actively investing in research and development of cutting-edge technologies, including composite copper foil, microporous copper foil, single-crystal copper foil, carrier copper foil, and new specialty copper foils. These innovations aim to enhance product structures and achieve domestic substitution in high-end electrolytic copper foil segments.
- Advanced Product Applications: High-performance products such as RTF (Reverse Treated Foil), HTE (High Temperature Elongation copper foil), and HVLP (High-Performance Very Low Profile copper foil) represent technological breakthroughs. These products are particularly relevant for applications in PCB high-end copper foil markets, supporting the domestic substitution process for high-end electronic circuit copper foils.
Downstream Demand Trends
- New Energy Battery Sector: Despite intense competition in the lithium battery copper foil industry, leading companies continue to demonstrate resilience. Battery production capacity is expected to increase by over 20% in both 2024 and 2025, providing sustained demand support for copper foil products.
- PCB Industry Growth: With the acceleration of AI applications, demand for server PCB continues to expand. The HDI (High Density Interconnect) trend is particularly notable, with companies possessing leading technology and production capacity positioned to benefit from major customer collaborations.
- International Market Expansion: Companies are actively exploring overseas markets, particularly in Europe, establishing relationships with international battery manufacturers and expanding their global presence. This diversification strategy helps adapt to changing global economic conditions.
Raw Material Price Dynamics
- Copper Price Influence: International copper prices significantly impact the copper foil industry. Recent copper price volatility, driven by factors including supply disruptions, geopolitical tensions, and macroeconomic conditions, directly affects production costs and profit margins for copper foil manufacturers.
- Supply Chain Stability: Companies are securing long-term supply contracts to ensure stable access to electrolytic copper raw materials. These strategic arrangements help mitigate price volatility risks and support future operational stability.
III. 2026-2031 RTF Price Prediction
2026 Outlook
- Conservative Prediction: $0.01272 - $0.01383
- Neutral Prediction: Around $0.01383
- Optimistic Prediction: Up to $0.01784 (subject to favorable market conditions)
2027-2029 Outlook
- Market Stage Expectation: The token may enter a gradual growth phase, with potential price fluctuations influenced by broader market sentiment and project developments.
- Price Range Predictions:
- 2027: $0.00982 - $0.02296, with an average around $0.01584
- 2028: $0.01494 - $0.02153, with an average around $0.0194
- 2029: $0.01289 - $0.03049, with an average around $0.02047
- Key Catalysts: Market adoption trends, technological advancements within the ecosystem, and overall cryptocurrency market cycles could serve as primary drivers for price movement.
2030-2031 Long-term Outlook
- Baseline Scenario: $0.02038 - $0.03287 (assuming steady market conditions and moderate adoption)
- Optimistic Scenario: $0.02548 - $0.03287 in 2030, potentially reaching $0.0318 in 2031 (contingent on increased ecosystem utility and favorable regulatory environment)
- Transformative Scenario: Prices could approach the higher end of predicted ranges if exceptional market conditions align with significant project milestones
- 2026-02-03: RTF trading within the predicted baseline range, reflecting current market positioning
| Year |
Predicted High Price |
Predicted Average Price |
Predicted Low Price |
Price Change |
| 2026 |
0.01784 |
0.01383 |
0.01272 |
0 |
| 2027 |
0.02296 |
0.01584 |
0.00982 |
14 |
| 2028 |
0.02153 |
0.0194 |
0.01494 |
40 |
| 2029 |
0.03049 |
0.02047 |
0.01289 |
47 |
| 2030 |
0.03287 |
0.02548 |
0.02038 |
84 |
| 2031 |
0.0318 |
0.02917 |
0.02334 |
110 |
IV. RTF Professional Investment Strategy and Risk Management
RTF Investment Methodology
(1) Long-term Holding Strategy
- Suitable for: Investors interested in the SocialFi and professional fighting industry convergence with moderate to high risk tolerance
- Operational Recommendations:
- Consider accumulating positions during market corrections, particularly when price approaches support levels
- Monitor project development milestones and ecosystem expansion within the fighting community
- Utilize Gate Web3 Wallet for secure storage of RTF tokens with multi-signature protection
(2) Active Trading Strategy
- Technical Analysis Tools:
- Moving Averages: Use 50-day and 200-day moving averages to identify trend direction and potential entry/exit points
- Volume Analysis: Monitor 24-hour trading volume (currently around $13,056) relative to historical averages to gauge market interest
- Swing Trading Considerations:
- Given the recent 10.02% decline over 7 days and 24.47% decline over 30 days, identify potential support zones for entry opportunities
- Set stop-loss orders to manage downside risk, particularly given the token's volatility
RTF Risk Management Framework
(1) Asset Allocation Principles
- Conservative Investors: 1-3% of crypto portfolio allocation
- Aggressive Investors: 5-8% of crypto portfolio allocation
- Professional Investors: Up to 10% with active risk monitoring and hedging strategies
(2) Risk Hedging Solutions
- Portfolio Diversification: Balance RTF holdings with established cryptocurrencies and stablecoins to reduce concentration risk
- Position Sizing: Scale investments gradually rather than committing full allocation immediately, particularly given current market conditions
(3) Secure Storage Solutions
- Gate Web3 Wallet: Recommended for convenient trading access while maintaining security through advanced encryption
- Hardware Wallet Solution: Consider cold storage for long-term holdings exceeding personal risk thresholds
- Security Precautions: Never share private keys, enable two-factor authentication, and verify contract addresses (0xa89e2871A850E0e6fD8F0018eC1fc62FA75440d4 on BSC) before transactions
V. RTF Potential Risks and Challenges
RTF Market Risks
- High Volatility: RTF has experienced significant price fluctuations, with a 37.76% decline over the past year, indicating substantial market volatility
- Limited Liquidity: With approximately $13,056 in 24-hour trading volume and only 3 exchanges listing the token, liquidity constraints may impact execution during large trades
- Market Capitalization: Current market cap of approximately $1.1 million represents a micro-cap asset with inherent higher risk and potential for price manipulation
RTF Regulatory Risks
- SocialFi Framework Uncertainty: Regulatory approaches to social finance platforms integrated with blockchain technology remain evolving across jurisdictions
- Sports Betting Implications: Connection to the fighting industry may attract scrutiny from gambling and sports betting regulators in certain regions
- Token Classification: Potential reclassification of utility tokens under securities regulations could impact trading accessibility and project operations
RTF Technical Risks
- Smart Contract Vulnerabilities: As an ERC-20 token on BSC, the platform depends on smart contract security; any undiscovered vulnerabilities could pose risks
- Platform Adoption: Success depends on widespread adoption by fighters, coaches, and fans within the professional fighting ecosystem
- Competitive Landscape: Other SocialFi platforms and sports-focused blockchain projects may compete for the same user base and market share
VI. Conclusion and Action Recommendations
RTF Investment Value Assessment
RTF presents an innovative approach to revolutionizing the professional fighting industry through blockchain technology and SocialFi principles. The platform's vision of creating a unified ecosystem for fighters, coaches, fans, and promoters addresses real industry pain points. However, investors should carefully weigh the project's early-stage nature, limited circulating supply (20% of total supply), and recent negative price momentum against its long-term potential. The current price of $0.01383 represents a significant discount from its all-time high of $0.356 in April 2024, which may present opportunities for risk-tolerant investors while also reflecting market skepticism or broader crypto market conditions.
RTF Investment Recommendations
✅ Beginners: Start with minimal allocation (under 2% of crypto portfolio) to gain exposure while learning about SocialFi and sports blockchain projects. Use Gate.com's trading platform for easy access and educational resources.
✅ Experienced Investors: Consider strategic accumulation during market dips with strict position sizing discipline. Monitor project development updates and fighting industry adoption metrics before increasing exposure.
✅ Institutional Investors: Conduct thorough due diligence on the project's business model, team credentials, and partnership pipeline. Consider pilot allocations with clear performance metrics and exit strategies.
RTF Trading Participation Methods
- Spot Trading: Purchase RTF tokens directly on Gate.com with USDT or other trading pairs for straightforward exposure
- Dollar-Cost Averaging: Implement systematic purchase plans to smooth entry prices and reduce timing risk
- Community Engagement: Participate in RTF's social ecosystem through their platform at rtfight.com to understand user adoption and product development firsthand
Cryptocurrency investment carries extremely high risks, and this article does not constitute investment advice. Investors should make cautious decisions based on their own risk tolerance and are advised to consult professional financial advisors. Never invest more than you can afford to lose.
FAQ
What is the current price of RTF and when were its all-time high and low prices?
RTF's current price is significantly below its all-time high of $0.2865. The all-time low stands at $0.009772. Currently, RTF is trading 95.15% below its peak value and 42.26% above its historical minimum.
How to conduct RTF price prediction, what are the common analysis methods?
RTF price prediction uses technical analysis with moving averages, candlestick charts, and trading volume trends. Fundamental analysis examines market demand and project developments. Combine these methods with key indicators for comprehensive forecasting.
What factors influence RTF price, and how do market risks and volatility work?
RTF price is influenced by market sentiment, trading volume, technical developments, and user growth. Market risks and volatility are driven by overall market conditions and ecosystem expansion.
How does RTF price performance and growth potential compare with other mainstream tokens?
RTF demonstrated significant growth potential in 2025, reaching $0.01247 with a market cap of $997,600. As an innovative decentralized finance platform, RTF shows promising trajectory compared to mainstream tokens, with strong fundamentals supporting future appreciation.
What are professional analysts' expectations for RTF's future price?
Professional analysts predict RTF token will experience significant appreciation through 2025-2026. Market outlook remains positive with expected price increases driven by growing investor confidence and strengthening market fundamentals. Continuous monitoring of market dynamics is recommended.
* The information is not intended to be and does not constitute financial advice or any other recommendation of any sort offered or endorsed by Gate.