This comprehensive analysis examines RWAINC, the pioneering Real-World Asset ecosystem in Web3, currently trading at $0.002589 with a market cap of $861,583. The article evaluates RWAINC's price trajectory from 2026-2031, incorporating historical performance, market dynamics, and ecosystem development. Key predictions include conservative 2026 range of $0.00155-$0.00259, with potential growth to $0.00495-$0.00531 by 2031 under favorable conditions. The analysis identifies core price drivers including token supply mechanisms, institutional adoption, macroeconomic factors, and technological development on BASE blockchain. Investment strategies emphasize long-term positioning and active trading approaches through Gate.com, while risk management frameworks address volatility, liquidity constraints, and regulatory uncertainties. The article guides beginners through advanced investors with tailored recommendations, highlighting both sector opportunities and inherent risks in early-stage RWA tokenization investments
Introduction: RWAINC's Market Position and Investment Value
RWA Inc. (RWAINC), positioned as the first comprehensive Real-World Asset (RWA) ecosystem in the web3 space, has been making significant strides since its launch in 2024. As of February 4, 2026, RWAINC maintains a market capitalization of approximately $861,583, with a circulating supply of around 332,785,884 tokens, and a price hovering near $0.002589. This asset, designed to bridge traditional finance and blockchain technology, is playing an increasingly important role in the tokenization of real-world assets.
This article will comprehensively analyze RWAINC's price trends from 2026 to 2031, combining historical patterns, market supply and demand dynamics, ecosystem development, and macroeconomic conditions to provide investors with professional price predictions and practical investment strategies.
I. RWAINC Price History Review and Market Status
RWAINC Historical Price Evolution Trajectory
- 2024: Project launched in November with trading commencing on Gate.com, initial price discovery phase established market presence, price experienced volatility with peak momentum in early December
- 2024 December: Reached price milestone of $0.14542 on December 4th, representing early adoption phase and initial market enthusiasm for the comprehensive Real-World Asset ecosystem
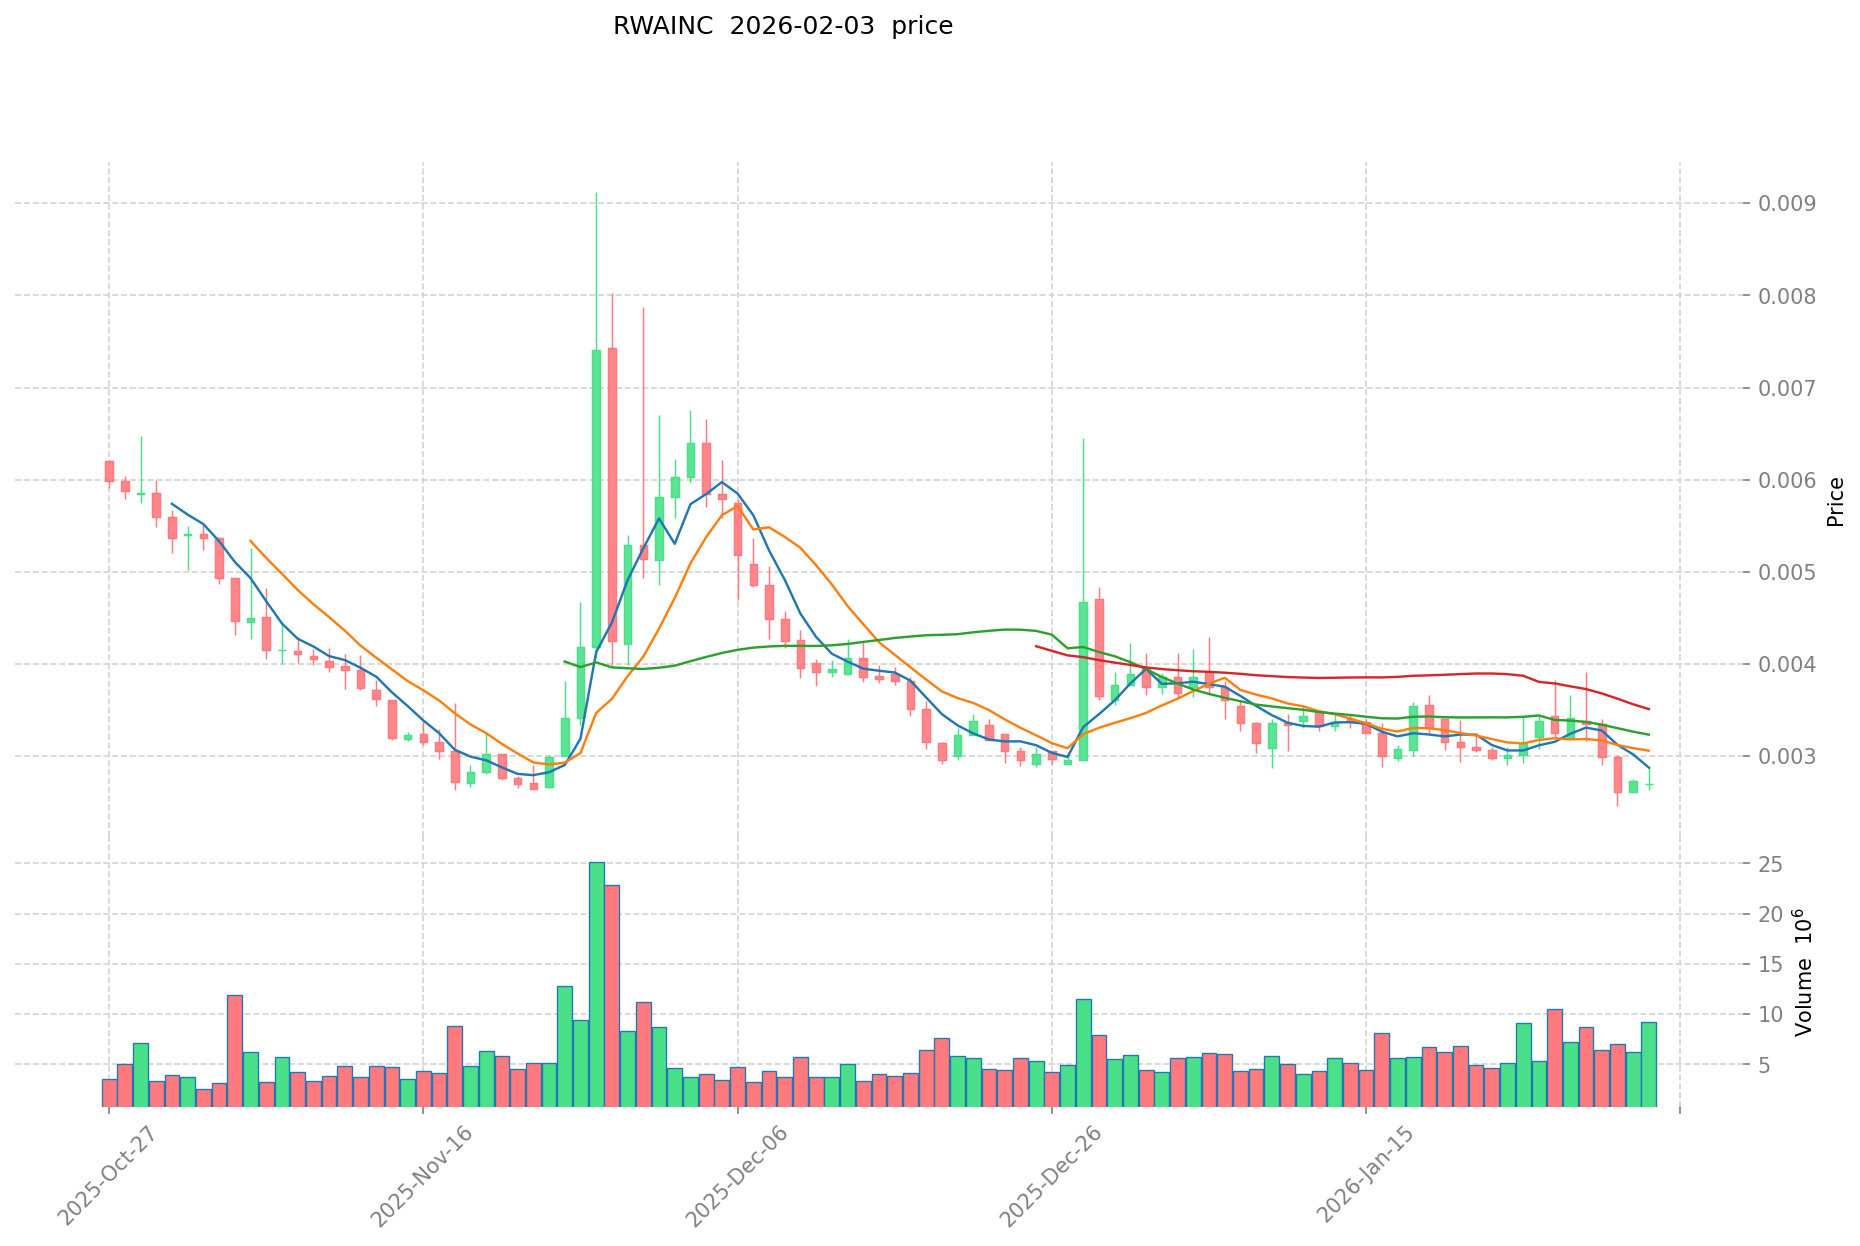
- 2025-2026: Market entered correction phase, price declined from December 2024 highs, experiencing substantial adjustment period through early 2026, reaching lower price level of $0.002456 on January 31st, 2026
RWAINC Current Market Status
As of February 4th, 2026, RWAINC is trading at $0.002589, showing a 1.01% increase over the past hour but facing downward pressure with a 3.5% decline in the last 24 hours. The recent trading range has been between $0.002549 and $0.002778.
Over the past week, RWAINC has experienced a 21.4% decline, while the 30-day performance shows a 36.03% decrease. The yearly performance indicates a substantial 91.46% decline from previous levels, reflecting broader market adjustments and evolving sentiment toward tokenized real-world asset projects.
The project maintains a circulating supply of 332,785,884 tokens out of a maximum supply of 1,000,000,000 tokens, representing approximately 33.28% of total supply in circulation. The current market capitalization stands at $861,582.65, with a fully diluted valuation of $2,589,000. The 24-hour trading volume of $16,804.87 indicates moderate market activity.
RWAINC holds a market dominance of 0.000096%, ranking at position 2627 in the broader cryptocurrency market. The holder count stands at 73,053 addresses, demonstrating a distributed token ownership structure. The project operates on the BASE blockchain network, positioning itself within the emerging Real-World Asset tokenization sector that is projected to reach between $16 trillion and $26 trillion by 2030.
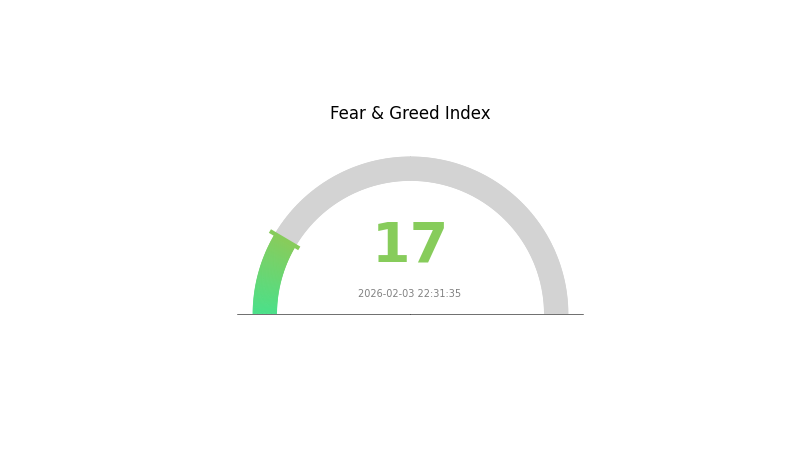
Current market sentiment indicators show an extreme fear reading of 17 on the volatility index, suggesting cautious positioning among market participants. The ratio between market capitalization and fully diluted valuation at 33.28% indicates substantial token allocation remains outside current circulation.
Click to view current RWAINC market price
RWAINC Market Sentiment Index
02-03-2026 Fear and Greed Index: 17 (Extreme Fear)
Click to view current Fear & Greed Index
The cryptocurrency market is currently experiencing extreme fear, with the Fear and Greed Index standing at 17. This indicates a significant level of market pessimism and investor anxiety. During periods of extreme fear, asset prices often reach attractive entry points for long-term investors. However, caution is warranted as market volatility typically increases. Monitor market developments closely and consider your risk tolerance before making investment decisions on Gate.com.
RWAINC Holding Distribution
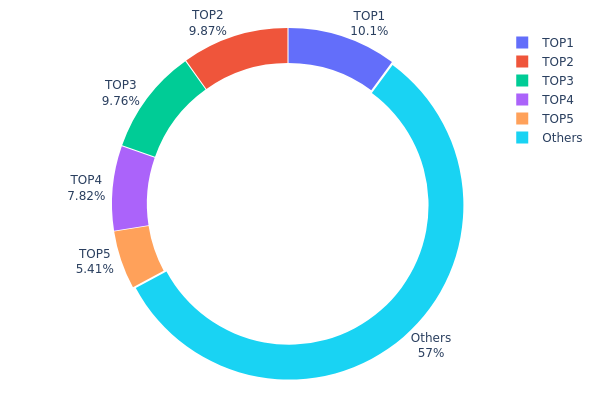
The holding distribution chart provides insights into how RWAINC tokens are allocated across different wallet addresses, serving as a critical indicator of decentralization and potential concentration risk. According to the latest on-chain data, the top five addresses collectively control approximately 42.97% of the total RWAINC supply, while the remaining 57.03% is distributed among other holders. Notably, the largest holder (0x0ac6...2ca401) possesses 100,000K tokens, representing 10.11% of the total supply, followed closely by the second and third largest addresses holding 9.87% and 9.76% respectively.
This distribution pattern reveals a moderately high concentration level, with nearly 43% of tokens controlled by just five addresses. Such concentration poses inherent risks to market stability, as large holders maintain significant influence over price movements through their selling or buying activities. The relative proximity in holding percentages among the top three addresses (ranging from 9.76% to 10.11%) suggests a somewhat balanced power structure among major stakeholders, which may mitigate single-entity manipulation risks to some extent.
From a market structure perspective, while over half of the tokens remain distributed among smaller holders, the substantial concentration in top addresses indicates that RWAINC's ecosystem has not yet achieved optimal decentralization. This structure makes the token susceptible to increased volatility during periods when major holders execute large transactions. The current holding distribution reflects an early-to-mid stage development phase, where institutional or early investors still maintain considerable control, potentially impacting both liquidity depth and price discovery mechanisms on trading platforms like Gate.com.
Click to view current RWAINC Holding Distribution
| Top |
Address |
Holding Qty |
Holding (%) |
| 1 |
0x0ac6...2ca401 |
100000.00K |
10.11% |
| 2 |
0x886d...c0b9af |
97652.62K |
9.87% |
| 3 |
0xef66...a0e71e |
96581.12K |
9.76% |
| 4 |
0x260d...50f23c |
77366.26K |
7.82% |
| 5 |
0x4e3a...a31b60 |
53540.49K |
5.41% |
| - |
Others |
563945.79K |
57.03% |
II. Core Factors Influencing RWAINC's Future Price
Supply Mechanism
- Token Supply Dynamics: RWAINC operates within the broader RWA tokenization framework, where supply is influenced by the underlying real-world asset backing and regulatory compliance requirements.
- Historical Patterns: The RWA sector has experienced steady growth, with market capitalization surpassing $17 billion, indicating controlled supply expansion aligned with asset tokenization adoption.
- Current Impact: As institutional adoption accelerates and regulatory frameworks mature, supply mechanisms are expected to remain stable while demand from traditional finance participants may increase significantly.
Institutional and Whale Activity
- Institutional Holdings: Major DeFi protocols including MakerDAO and Aave have integrated RWA components, demonstrating institutional validation of the tokenized asset model.
- Enterprise Adoption: Financial institutions are increasingly exploring RWA tokenization infrastructure, with protocols like Ondo Finance, Centrifuge, and Polymesh providing institutional-grade solutions.
- Regulatory Policy: Regulatory frameworks are evolving to accommodate tokenized assets, with jurisdictions like Germany providing oversight for compliant RWA infrastructure through entities such as Swarm Markets.
Macroeconomic Environment
- Monetary Policy Impact: Central bank interest rate decisions and inflation policies directly affect RWA token investment attractiveness, as these assets compete with traditional fixed-income instruments.
- Inflation Hedge Attributes: RWA tokens backed by tangible assets may offer inflation protection characteristics, potentially increasing demand during periods of currency devaluation.
- Geopolitical Factors: Global economic conditions, policy uncertainty, and international liquidity environments increasingly influence digital assets, including RWA tokens, similar to traditional financial markets.
Technological Development and Ecosystem Building
- Layer 2 Scaling Solutions: Ethereum's EIP-4844 implementation has significantly enhanced scalability through blob data transactions, reducing costs for RWA token operations and improving transaction throughput for tokenized asset platforms.
- Cross-Chain Infrastructure: Development of interoperable blockchain infrastructure enables RWA tokens to operate across multiple networks, expanding accessibility and liquidity options for institutional participants.
- DeFi Integration: RWA tokens are being integrated into decentralized lending protocols like Flux Finance and yield generation platforms, creating additional utility and demand drivers within the blockchain ecosystem.
- Compliance Technology: Advanced KYC/AML solutions and on-chain compliance engines, such as those implemented by Polymesh, enable regulatory-compliant token transfers while maintaining blockchain transparency benefits.
III. 2026-2031 RWAINC Price Prediction
2026 Outlook
- Conservative prediction: $0.00155 - $0.00259
- Neutral prediction: $0.00259 (average)
- Optimistic prediction: $0.00331 (requires favorable market conditions and increased adoption)
2027-2029 Outlook
- Market stage expectation: Gradual growth phase with potential for moderate volatility
- Price range prediction:
- 2027: $0.00201 - $0.00328 (14% potential increase)
- 2028: $0.0029 - $0.00458 (20% potential increase)
- 2029: $0.00261 - $0.00531 (48% potential increase)
- Key catalysts: Market maturation, ecosystem development, and broader adoption trends
2030-2031 Long-term Outlook
- Baseline scenario: $0.00439 - $0.00494 (assuming steady growth trajectory)
- Optimistic scenario: $0.00495 - $0.00531 (contingent on positive market sentiment and technological advancement)
- Transformative scenario: Potential for 76-83% cumulative growth by 2030-2031 (under exceptionally favorable conditions including mainstream adoption and favorable regulatory environment)
- 2026-02-04: RWAINC positioned at early forecast stage with anticipated price range of $0.00155 - $0.00331
| Year |
Predicted High Price |
Predicted Average Price |
Predicted Low Price |
Price Change |
| 2026 |
0.00331 |
0.00259 |
0.00155 |
0 |
| 2027 |
0.00328 |
0.00295 |
0.00201 |
14 |
| 2028 |
0.00458 |
0.00311 |
0.0029 |
20 |
| 2029 |
0.00531 |
0.00385 |
0.00261 |
48 |
| 2030 |
0.00494 |
0.00458 |
0.00439 |
76 |
| 2031 |
0.00495 |
0.00476 |
0.00262 |
83 |
IV. RWAINC Professional Investment Strategy and Risk Management
RWAINC Investment Methodology
(1) Long-term Holding Strategy
- Suitable for: Investors seeking exposure to the Real-World Asset (RWA) tokenization sector with a multi-year time horizon
- Operational recommendations:
- Consider accumulating positions during periods of market consolidation, given the project's focus on the expanding RWA tokenization market
- Monitor developments in regulatory compliance and ecosystem expansion as key indicators of long-term viability
- Storage solution: Utilize Gate Web3 Wallet for secure custody with multi-signature functionality to protect long-term holdings
(2) Active Trading Strategy
- Technical analysis tools:
- Volume analysis: Monitor the 24-hour trading volume (currently $16,804.87) relative to market cap to identify liquidity trends and potential breakout signals
- Support and resistance levels: Track the current range between $0.002549 (24H low) and $0.002778 (24H high) to identify short-term trading opportunities
- Swing trading considerations:
- Given the 24-hour price change of -3.5% and 7-day decline of -21.4%, traders should implement strict stop-loss orders to manage downside risk
- Monitor holder count (73,053) and circulating supply ratio (33.28%) as indicators of distribution patterns and potential volatility
RWAINC Risk Management Framework
(1) Asset Allocation Principles
- Conservative investors: 1-3% of crypto portfolio allocation, reflecting the early-stage nature and limited exchange availability (1 exchange)
- Aggressive investors: 5-8% allocation for those seeking higher exposure to the RWA narrative
- Professional investors: Up to 10% allocation with active hedging strategies and continuous monitoring of ecosystem developments
(2) Risk Hedging Solutions
- Diversification approach: Balance RWAINC exposure with established RWA-focused tokens and traditional DeFi assets to mitigate sector-specific risks
- Position sizing strategy: Implement scaled entry and exit points based on technical levels and fundamental milestones to reduce concentration risk
(3) Secure Storage Solutions
- Web3 wallet recommendation: Gate Web3 Wallet provides non-custodial storage with support for BASE chain assets and built-in security features
- Multi-layer security: Enable two-factor authentication, use hardware security keys for high-value holdings, and maintain offline backup of recovery phrases
- Security precautions: Never share private keys or seed phrases, verify contract addresses (0xe2b1dc2d4a3b4e59fdf0c47b71a7a86391a8b35a) before transactions, and be cautious of phishing attempts
V. RWAINC Potential Risks and Challenges
RWAINC Market Risks
- Volatility exposure: The token has experienced substantial price decline of -91.46% over one year, indicating high volatility and potential for continued downward pressure
- Liquidity constraints: With trading available on only 1 exchange and relatively modest 24-hour volume, liquidity risk may result in significant slippage during large transactions
- Market sentiment: Current ranking of 2627 and market dominance of 0.000096% suggest limited market adoption and potential challenges in gaining mainstream recognition
RWAINC Regulatory Risks
- RWA compliance landscape: While the project emphasizes regulatory compliance, evolving global regulations around tokenized real-world assets may impact operational capabilities and token utility
- Jurisdictional uncertainties: Different regulatory approaches to RWA tokenization across regions could affect market accessibility and adoption rates
- Securities classification concerns: Potential regulatory scrutiny regarding whether tokenized real-world assets constitute securities could influence the project's structure and operations
RWAINC Technical Risks
- Smart contract dependency: Token operations on BASE chain rely on contract security (0xe2b1dc2d4a3b4e59fdf0c47b71a7a86391a8b35a), with any vulnerabilities potentially affecting token functionality
- Ecosystem integration challenges: The complexity of bridging traditional finance with blockchain technology introduces technical implementation risks that could delay product launches
- Network dependencies: Reliance on BASE infrastructure means any network congestion, security incidents, or technical issues could impact token transfers and ecosystem functionality
VI. Conclusion and Action Recommendations
RWAINC Investment Value Assessment
RWA Inc. positions itself within the expanding real-world asset tokenization sector, which projects substantial growth potential toward 2030. The utility token serves as the ecosystem connector for various RWA-related services. However, current market performance shows significant headwinds, with the token trading substantially below historical levels and experiencing continued downward pressure across multiple timeframes. The limited exchange availability and modest market capitalization suggest the project remains in early developmental stages. While the long-term RWA tokenization thesis presents opportunities, investors should recognize the speculative nature of the investment and the substantial risks inherent in early-stage blockchain projects.
RWAINC Investment Recommendations
✅ Beginners: Start with minimal allocation (under 2% of crypto portfolio) as an educational position to understand the RWA tokenization sector; focus on understanding the technology and market dynamics before increasing exposure
✅ Experienced investors: Consider strategic accumulation during market weakness if convinced by the long-term RWA narrative, while maintaining strict risk parameters and position sizing discipline; monitor ecosystem developments and partnership announcements as potential catalysts
✅ Institutional investors: Conduct thorough due diligence on regulatory compliance framework, technical infrastructure, and competitive positioning; consider pilot allocation with ongoing monitoring of holder growth, exchange listings, and ecosystem expansion metrics
RWAINC Trading Participation Methods
- Spot trading: Access RWAINC through Gate.com with competitive trading fees and liquidity; verify contract address before executing transactions
- DCA strategy: Implement dollar-cost averaging to smooth entry prices and reduce timing risk, particularly suitable given current market volatility
- Gate Web3 Wallet integration: Utilize Gate Web3 Wallet for direct on-chain interactions and secure self-custody of BASE chain assets
Cryptocurrency investment carries extreme risk, and this article does not constitute investment advice. Investors should make prudent decisions based on their own risk tolerance and are advised to consult professional financial advisors. Never invest more than you can afford to lose.
FAQ
What is RWAINC? What are its practical uses?
RWAINC is a Web3 ecosystem connecting traditional finance and blockchain. It enables management and trading of Real-World Assets (RWA), bridging the gap between conventional financial systems and decentralized networks through its utility token.
What is the current price of RWAINC? What are its all-time high and all-time low prices?
RWAINC's current price varies in real-time across markets. The all-time high reached $0.1436, while the all-time low was $0.0026. Prices fluctuate constantly due to market dynamics.
What is the price prediction for RWAINC in 2024? How do professional analysts view it?
Professional analysts predict RWAINC price will exceed 80,000 USD in 2024. RWA sector is considered one of the most successful areas in cryptocurrency market based on 2023 trends and momentum.
What are the main risks of investing in RWAINC? How should I evaluate them?
Main risks include smart contract security and blockchain platform stability. Evaluate by assessing project background, asset quality, and market performance. Monitor technical developments and team credibility carefully.
What are the advantages and disadvantages of RWAINC compared to similar tokens?
RWAINC offers enhanced liquidity through tokenization and improved efficiency in asset management. Advantages include lower transaction costs, faster settlement, and broader accessibility. Potential disadvantages involve regulatory uncertainty and market volatility. Its RWA backing provides stability compared to purely speculative tokens.
How is the market liquidity and trading volume of RWAINC? On which exchanges can it be traded?
RWAINC maintains good market liquidity with 24-hour trading volume of 12,406.39 USD. The token is available for trading on major cryptocurrency exchanges, providing global users with convenient access to trading opportunities.
* The information is not intended to be and does not constitute financial advice or any other recommendation of any sort offered or endorsed by Gate.