This article provides a comprehensive analysis of Sentre (SNTR), an open liquidity protocol on Solana, examining its market position, price trajectory, and investment potential through 2031. As of February 2026, SNTR trades at $0.000362 with a market cap of $362,000, showing 7.27% monthly gains despite 40.30% annual decline amid extreme market fear conditions. The analysis covers SNTR's price history, current market sentiment, and extreme token concentration risks. Expert price predictions range from conservative ($0.00033-$0.00036 in 2026) to optimistic scenarios ($0.00081 by 2031), accounting for ecosystem adoption and market maturity. The article outlines investment strategies for different investor profiles, risk management frameworks including position sizing and secure storage via Gate Web3 Wallet, and addresses regulatory, technical, and liquidity challenges. Comprehensive guidance recommends cautious portfolio allocation (0.5-5% depending on investor type) with emphasis on risk awareness. Real-time tr
Introduction: SNTR's Market Position and Investment Value
Sentre (SNTR), positioned as an open liquidity protocol built on Solana, has been developing its ecosystem since its inception. As of February 2026, SNTR maintains a market capitalization of approximately $362,000, with a circulating supply of around 999.94 million tokens, and the price hovering near $0.000362. This asset, known as a "comprehensive DeFi platform on Solana," is playing an increasingly important role in decentralized application development and liquidity provision.
This article will comprehensively analyze SNTR's price trends from 2026 to 2031, combining historical patterns, market supply and demand dynamics, ecosystem developments, and macroeconomic conditions to provide investors with professional price forecasts and practical investment strategies.
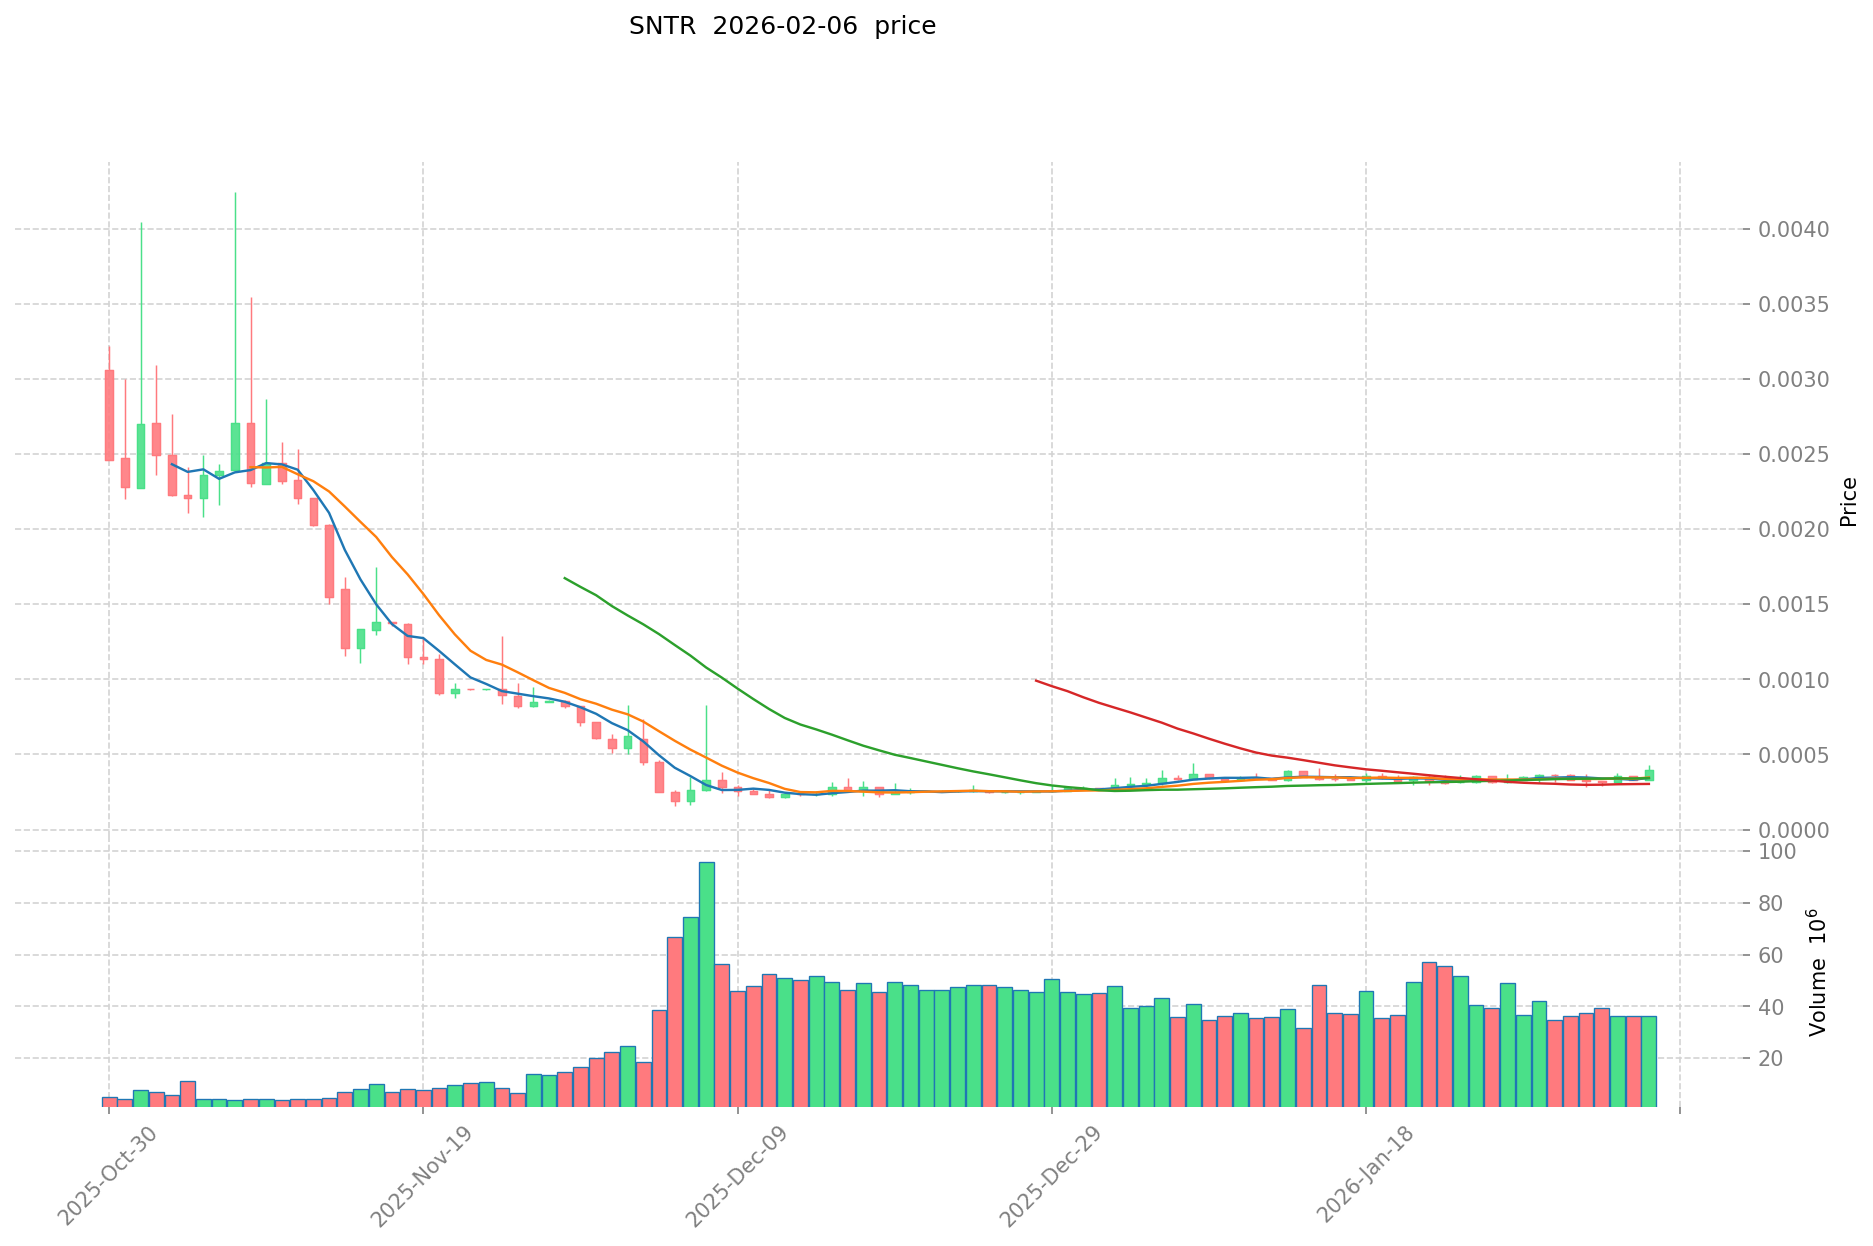
I. SNTR Price History Review and Market Status
SNTR Historical Price Evolution Trajectory
- 2022: SNTR reached a notable price level of $0.053225 on January 8, marking a significant period in its early trading phase
- 2025: The token experienced considerable downward pressure, with the price declining to $0.00016367 on December 6, reflecting broader market challenges
SNTR Current Market Situation
As of February 6, 2026, SNTR is trading at $0.000362, demonstrating a recovery from its previous low point. The token has shown positive short-term momentum with a 24-hour price increase of 4.2% and a 30-day gain of 7.27%. However, the 1-year performance indicates a decline of 40.30%, suggesting extended volatility over a longer timeframe.
The token's 24-hour trading volume stands at $16,261.59, with the price ranging between $0.0003426 and $0.0004992 during this period. SNTR maintains a circulating supply of 999,943,579 tokens out of a maximum supply of 1,000,000,000, representing approximately 99.99% circulation. The market capitalization is positioned at $361,979.58, with a fully diluted valuation closely aligned at $362,000.
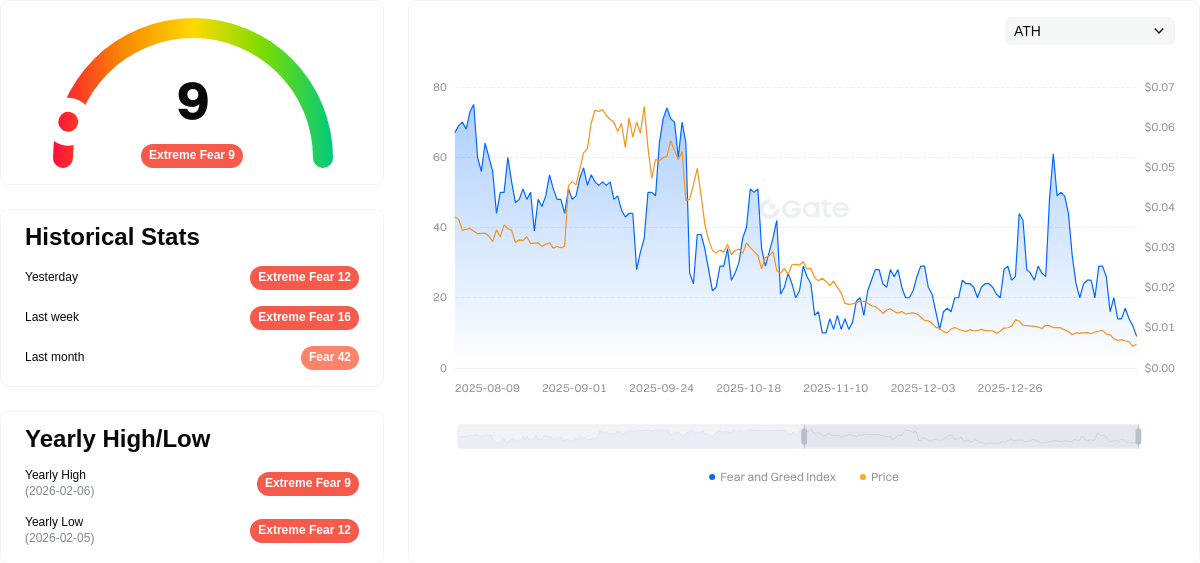
The current market sentiment, as indicated by the volatility index at 9, reflects an "Extreme Fear" condition in the broader cryptocurrency market, which may influence trading activity and price movements for SNTR and similar assets.
Click to view current SNTR market price
SNTR Market Sentiment Indicator
2026-02-06 Fear and Greed Index: 9 (Extreme Fear)
Click to view the current Fear & Greed Index
The crypto market is experiencing extreme fear, with the Fear and Greed Index plummeting to just 9 points. This exceptionally low reading signals severe market pessimism and panic selling. Such extreme levels historically present contrarian opportunities for long-term investors, as markets tend to recover from these depressed sentiment states. However, caution remains warranted as further volatility is possible. Monitor market developments closely on Gate.com for real-time data and analysis to make informed trading decisions during this period of heightened uncertainty.
SNTR Holding Distribution
The holding distribution chart reveals the concentration of token holdings across different wallet addresses, serving as a critical indicator of decentralization level and potential market manipulation risks. According to the latest on-chain data, SNTR exhibits an extremely high concentration characteristic, with the top address holding 887,147.90K tokens, accounting for 88.72% of the total supply. The second-ranked address holds only 38,690.99K tokens (3.86%), showing a significant disparity with the leading holder. The top five addresses collectively control approximately 94.48% of the circulating supply, while the remaining addresses combined hold merely 5.52%.
This highly centralized distribution structure poses substantial risks to market stability. The dominant position of the largest holder grants it significant pricing power, potentially leading to severe price volatility through large-scale sell-offs or coordinated market actions. Such concentration levels typically indicate that the project team, early investors, or institutional participants maintain substantial control over token supply, which contradicts the decentralized principles of blockchain technology. For ordinary investors, this distribution pattern suggests elevated investment risks, as market trends may be heavily influenced by the decisions of a few major holders.
From a market structure perspective, this extreme concentration reflects SNTR's current developmental stage characteristics. The token may still be in its early distribution phase, with insufficient market circulation and limited participation from retail investors. While this structure might provide short-term price stability under certain circumstances, it fundamentally undermines the project's long-term health and trustworthiness, potentially deterring broader market participation and adoption.
Click to view the current SNTR Holding Distribution
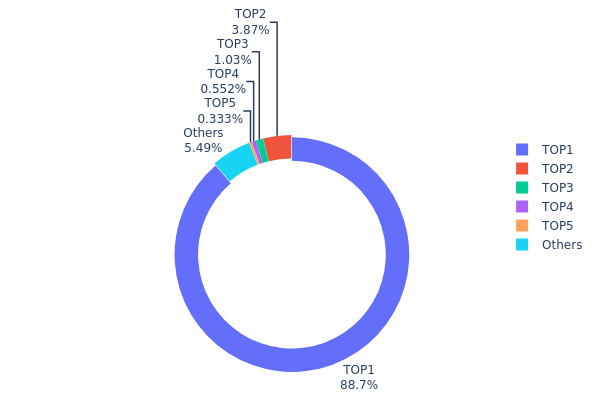
| Top |
Address |
Holding Qty |
Holding (%) |
| 1 |
AynAuE...6jm8of |
887147.90K |
88.72% |
| 2 |
u6PJ8D...ynXq2w |
38690.99K |
3.86% |
| 3 |
BHxt1d...6pH4vn |
10270.50K |
1.02% |
| 4 |
3oidmq...itc8yy |
5522.09K |
0.55% |
| 5 |
2cgswW...xqGgVQ |
3333.33K |
0.33% |
| - |
Others |
54944.75K |
5.52% |
II. Core Factors Affecting SNTR's Future Price
Based on the currently available information, there is insufficient data to provide a comprehensive analysis of the core factors that may influence SNTR's future price movements. A thorough evaluation would require detailed information about the token's supply mechanism, institutional adoption patterns, macroeconomic correlations, and technical development roadmap, none of which are present in the provided materials.
Investors interested in SNTR should conduct independent research and consult multiple sources before making any investment decisions. Market participants can monitor SNTR's performance and access real-time trading data through Gate.com's platform.
III. 2026-2031 SNTR Price Prediction
2026 Outlook
- Conservative prediction: $0.00033 - $0.00036
- Neutral prediction: $0.00036
- Optimistic prediction: $0.00049 (requires favorable market conditions)
2027-2029 Outlook
- Market stage expectation: The token may enter a gradual accumulation phase with moderate volatility as the crypto market matures
- Price range prediction:
- 2027: $0.00035 - $0.00047 (potential 18% increase)
- 2028: $0.00039 - $0.00050 (potential 23% increase)
- 2029: $0.00031 - $0.00053 (potential 31% increase)
- Key catalysts: Platform adoption growth, ecosystem development, and broader crypto market sentiment shifts
2030-2031 Long-term Outlook
- Baseline scenario: $0.00045 - $0.00063 (assuming steady project development and stable market conditions)
- Optimistic scenario: $0.00050 - $0.00081 (assuming accelerated adoption and favorable regulatory environment)
- Transformative scenario: Above $0.00081 (requires exceptional ecosystem expansion and significant market breakthrough)
- 2026-02-06: SNTR trading around $0.00033 - $0.00036 range (early stage of predicted trajectory)
| Year |
Predicted High Price |
Predicted Average Price |
Predicted Low Price |
Price Change |
| 2026 |
0.00049 |
0.00036 |
0.00033 |
0 |
| 2027 |
0.00047 |
0.00043 |
0.00035 |
18 |
| 2028 |
0.0005 |
0.00045 |
0.00039 |
23 |
| 2029 |
0.00053 |
0.00048 |
0.00031 |
31 |
| 2030 |
0.00063 |
0.0005 |
0.00045 |
38 |
| 2031 |
0.00081 |
0.00057 |
0.00045 |
55 |
IV. SNTR Professional Investment Strategies and Risk Management
SNTR Investment Methodology
(I) Long-term Holding Strategy
- Target Audience: Investors seeking exposure to Solana ecosystem DeFi infrastructure with a multi-year horizon
- Operational Recommendations:
- Consider accumulating positions during market corrections, given SNTR's volatility range between $0.00016367 and $0.053225
- Monitor Solana network developments and SenSwap protocol adoption metrics as fundamental indicators
- Storage Solution: Utilize Gate Web3 Wallet for secure custody with support for Solana-based assets
(II) Active Trading Strategy
- Technical Analysis Tools:
- Volume Analysis: Track the current 24-hour trading volume of $16,261.59 to identify liquidity patterns and potential breakout levels
- Moving Averages: Compare short-term price movements (recent 4.2% daily gain) against 7-day (-2.21%) and 30-day (+7.27%) trends to identify momentum shifts
- Swing Trading Key Points:
- Establish entry zones near recent lows around $0.000342, with risk management stops below the historical low
- Target profit-taking levels near recent 24-hour highs of $0.000499, adjusting for prevailing market sentiment
SNTR Risk Management Framework
(I) Asset Allocation Principles
- Conservative Investors: 0.5-1% of crypto portfolio allocation
- Aggressive Investors: 2-3% of crypto portfolio allocation
- Professional Investors: Up to 5% with active hedging strategies
(II) Risk Hedging Solutions
- Position Sizing: Limit single-position exposure given SNTR's low market capitalization of approximately $362,000
- Diversification Strategy: Balance SNTR holdings with established Solana ecosystem tokens to mitigate protocol-specific risks
(III) Secure Storage Solutions
- Hot Wallet Recommendation: Gate Web3 Wallet for active trading with convenient Solana integration
- Cold Storage Solution: Hardware wallet options for long-term holdings exceeding trading frequency
- Security Precautions: Never share private keys, verify contract address (SENBBKVCM7homnf5RX9zqpf1GFe935hnbU4uVzY1Y6M) before transactions, and enable two-factor authentication
V. SNTR Potential Risks and Challenges
SNTR Market Risks
- Liquidity Constraints: With a circulating market cap of approximately $362,000 and trading on one exchange, SNTR faces significant liquidity risks that may result in high slippage during larger transactions
- Price Volatility: The token has experienced a 40.30% decline over the past year, reflecting substantial downside risk and market uncertainty
- Low Market Dominance: With a market share of 0.000015%, SNTR has minimal visibility and may struggle to attract investor attention during bearish market conditions
SNTR Regulatory Risks
- DeFi Protocol Scrutiny: Open liquidity protocols may face increased regulatory attention as authorities develop frameworks for decentralized finance applications
- Exchange Listing Limitations: Current availability on limited exchanges may restrict access if regulatory pressures impact listing policies
- Jurisdictional Compliance: Cross-border DApp distribution through Sen Store may encounter varying regulatory requirements across different regions
SNTR Technical Risks
- Solana Network Dependency: Protocol functionality relies entirely on Solana blockchain performance, including network congestion or outage events
- Smart Contract Vulnerabilities: As with all DeFi protocols, SenSwap faces potential exploitation risks from undiscovered code vulnerabilities
- Adoption Challenges: With 2,332 holders, the protocol has limited user base, raising questions about long-term sustainability and developer engagement
VI. Conclusion and Action Recommendations
SNTR Investment Value Assessment
Sentre represents a specialized play within the Solana DeFi ecosystem, offering exposure to open liquidity infrastructure and DApp distribution. The protocol's comprehensive approach combining Sen OS and SenSwap demonstrates technical ambition, though current metrics reveal early-stage adoption challenges. The token's 99.99% circulation rate minimizes dilution concerns, while its micro-cap status ($362K market cap) presents both opportunity and substantial risk. Recent 30-day gains of 7.27% suggest recovering interest, yet the 40% annual decline underscores prevailing market skepticism. Long-term value depends on successful execution of the Sen Store vision and meaningful protocol usage growth.
SNTR Investment Recommendations
✅ Beginners: Avoid or allocate minimal amounts (under 0.5% of portfolio) due to extreme volatility and liquidity constraints. Focus on learning DeFi concepts through established protocols before considering micro-cap positions.
✅ Experienced Investors: Consider speculative positions not exceeding 1-2% of portfolio, with strict stop-loss discipline. Monitor Solana ecosystem developments and SenSwap adoption metrics quarterly before adjusting exposure.
✅ Institutional Investors: Conduct comprehensive due diligence on protocol security audits and team credentials. Position sizing should reflect illiquidity premium requirements, with gradual accumulation strategies to minimize market impact.
SNTR Trading Participation Methods
- Spot Trading: Access SNTR through Gate.com with analysis of volume patterns before executing larger orders to minimize slippage
- DCA Strategy: Implement dollar-cost averaging with small, regular purchases to mitigate timing risk given historical price volatility
- Protocol Engagement: Directly utilize SenSwap functionalities to assess user experience and technical capabilities before making investment decisions
Cryptocurrency investment carries extreme risk. This analysis does not constitute investment advice. Investors should make prudent decisions based on their individual risk tolerance and are advised to consult professional financial advisors. Never invest more than you can afford to lose.
FAQ
What is SNTR? What are its uses and value?
SNTR is a cryptocurrency token on the Ethereum platform that serves as a visual protection system for digital communications, documents, images, and videos. It uses distributed ledger technology to provide immutable timestamp recording, registration, protection, and authentication of digital events and documents, with applications across B2B, B2G, B2C, and IoT sectors.
What is SNTR's historical price trend and current price?
SNTR is currently trading at $0.0003609, with an all-time high of $0.05322 reached in January 2022. The token has experienced a 99.3% decline from its peak and maintains a market cap of BTC 5.4744, reflecting significant price volatility since its inception.
What will be the SNTR price prediction for 2024?
SNTR price predictions for 2024 are difficult to determine precisely due to high market volatility. Historical data shows SNTR ranked first on warning lists in mid-2025. Accurate forecasting requires analyzing market conditions, trading volume, and project developments. Current market dynamics suggest potential price fluctuations, but precise predictions cannot be guaranteed.
What are the main factors affecting SNTR price?
SNTR price is primarily driven by supply and demand dynamics, market competition, and technological developments. Changes in supply-demand balance and market sentiment are key drivers. Technical advancements also influence production costs and pricing.
What are SNTR's advantages compared to similar tokens?
SNTR offers superior liquidity, transparency, and smart contract support backed by a strong community. With lower transaction fees and faster speeds, SNTR demonstrates clear technical advantages over comparable tokens in the market.
What risks should I pay attention to when investing in SNTR?
SNTR investment carries market volatility and price fluctuation risks. Investors should understand these risks thoroughly, avoid high leverage trading, and only invest amounts they can afford to lose. Market uncertainty may cause significant losses.
How to conduct technical analysis of SNTR to predict price?
Analyze SNTR price trends using historical data, trading volume, and market sentiment. Monitor key resistance and support levels, use moving averages, and track market cycle patterns. Combine these indicators with fundamental analysis for comprehensive price forecasting.
What are SNTR's future development prospects and growth potential?
SNTR is projected to reach $0.000402 by 2028 with a growth rate of 10.25%. The project demonstrates strong potential with expanding ecosystem adoption and increasing transaction volume. Market momentum suggests positive long-term trajectory for value appreciation.
* The information is not intended to be and does not constitute financial advice or any other recommendation of any sort offered or endorsed by Gate.