This comprehensive analysis examines SPEC token's price trajectory and investment potential through 2031. Currently trading at $0.13564 with a market cap of $1.22 million, SPEC—Spectral's onchain AI agent platform token—has experienced significant volatility since its May 2024 launch. The article synthesizes historical price patterns, market dynamics, and ecosystem development to provide three-tiered forecasts: conservative ($0.10586-$0.13572), neutral ($0.13572), and optimistic ($0.14522) scenarios for 2026. Professional investment strategies address long-term holding and active trading approaches, complemented by comprehensive risk management frameworks for conservative through aggressive investors. Key catalysts include expanded exchange listings on Gate and technological advancement, while challenges encompass extreme volatility, limited liquidity with only 9% circulating supply, and regulatory uncertainties surrounding AI-driven smart contracts. Suitable for investors researching emerging blockchain auto
Introduction: SPEC's Market Position and Investment Value
Spectral (SPEC), as an onchain autonomous agent platform that converts natural language into Solidity code, has been advancing the development of the agent economy in Web3 since its launch in 2024. As of 2026, Spectral's market capitalization has reached approximately $1.22 million, with a circulating supply of around 9 million tokens, and the price maintained at about $0.136. This asset, recognized as a "production-grade smart contract generator", is playing an increasingly important role in enabling individuals and enterprises to deploy smart contracts, arbitrage agents, NFTs, and rollups.
This article will comprehensively analyze SPEC's price trends from 2026 to 2031, combining historical patterns, market supply and demand dynamics, ecosystem development, and macroeconomic environment to provide investors with professional price predictions and practical investment strategies.
I. SPEC Price History Review and Market Status
SPEC Historical Price Evolution Trajectory
- 2024: The token launched on May 5, 2024, with an initial listing price of $2.3, experiencing significant volatility in its early trading period
- 2024: On November 30, 2024, SPEC reached a notable peak of $18.673, marking a period of strong market interest and momentum
- 2025-2026: Following the market correction cycle, the price declined from $18.673 to a low of $0.073 recorded on January 21, 2026, reflecting broader market pressures
SPEC Current Market Situation
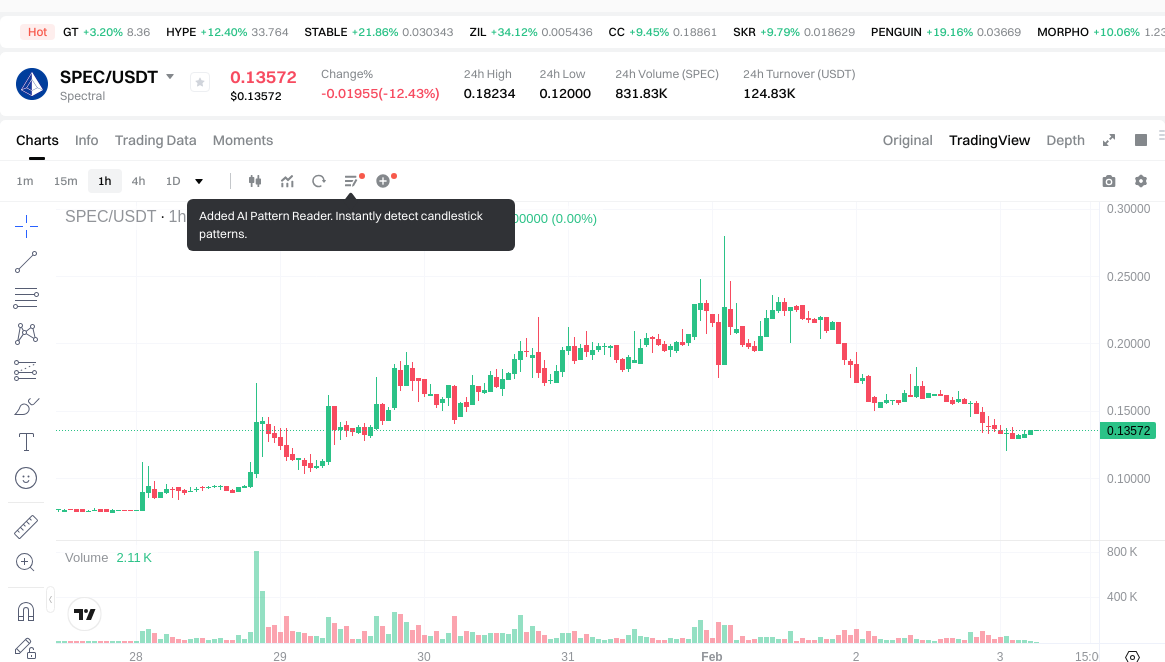
As of February 3, 2026, SPEC is trading at $0.13564, showing a recovery from its recent low point. The token has demonstrated mixed short-term performance, with a 1-hour increase of 0.32% and a 24-hour decline of 12.2%. However, the 7-day performance shows a substantial gain of 74.89%, indicating renewed buying interest.
The token's market capitalization stands at approximately $1.22 million, with a circulating supply of 9 million SPEC tokens out of a maximum supply of 100 million tokens, representing a 9% circulation ratio. The fully diluted market cap is calculated at $13.56 million. Within the past 24 hours, trading volume reached $125,137.64, with the price fluctuating between a high of $0.18234 and a low of $0.12.
SPEC currently ranks #2387 in the cryptocurrency market, with a market dominance of 0.00048%. The token is held by 6,308 addresses and is listed on 7 exchanges. The current market sentiment index shows a reading of 14, indicating an "Extreme Fear" environment among market participants.
Click to check the current SPEC market price
SPEC Market Sentiment Index
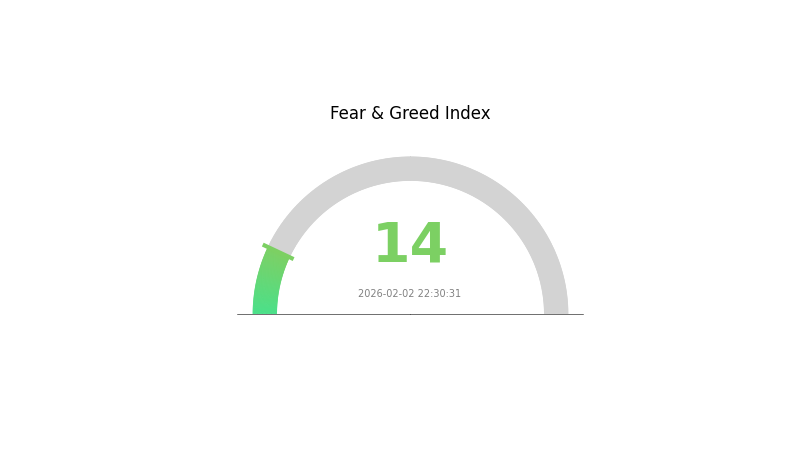
2026-02-02 Fear & Greed Index: 14 (Extreme Fear)
Click to view current Fear & Greed Index
The cryptocurrency market is currently experiencing extreme fear, with the Fear & Greed Index plummeting to 14. This exceptionally low reading signals severe market pessimism and heightened risk aversion among investors. During such periods of extreme fear, market volatility typically intensifies, creating both significant downside risks and potential contrarian buying opportunities for long-term investors. Traders should exercise caution and implement strict risk management strategies while monitoring key support levels.
SPEC Holding Distribution
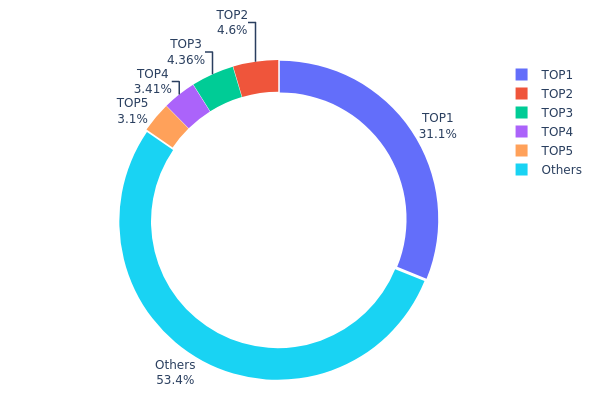
The holding distribution chart reveals how SPEC tokens are allocated across different wallet addresses, serving as a critical indicator of token concentration and decentralization level. Based on current on-chain data, the top 5 addresses collectively hold approximately 46.58% of the total supply, with the largest single address controlling 31.14% (31,148.85K tokens). This significant concentration in the leading address suggests a relatively centralized holding structure, which could expose the token to heightened volatility risks and potential market manipulation concerns.
The distribution pattern shows that addresses ranked 2nd through 5th hold between 3.10% and 4.59% each, demonstrating a more balanced allocation among secondary holders. However, the remaining 53.42% distributed across other addresses indicates some degree of retail participation and community diffusion. This bifurcated structure—dominated by a major holder while maintaining modest broader distribution—reflects a transitional phase common in emerging crypto projects, where early investors or project treasuries retain substantial positions while market circulation gradually expands.
From a market dynamics perspective, this concentration level warrants cautious monitoring. The dominant 31.14% position held by the top address creates potential for significant price impact during large-scale movements, though the moderate diversification among smaller holders provides some buffer against single-point control. The current distribution suggests SPEC maintains partial decentralization while exhibiting characteristics typical of projects in early-to-mid development stages, where balanced holder expansion remains an ongoing process critical for long-term ecosystem stability.
Click to view current SPEC Holding Distribution
| Top |
Address |
Holding Qty |
Holding (%) |
| 1 |
0x42bd...1596a1 |
31148.85K |
31.14% |
| 2 |
0x7c01...b21056 |
4595.02K |
4.59% |
| 3 |
0x1b82...31dc9f |
4358.92K |
4.35% |
| 4 |
0x39ea...331bec |
3406.34K |
3.40% |
| 5 |
0xb7b9...f752b7 |
3100.89K |
3.10% |
| - |
Others |
53389.98K |
53.42% |
II. Core Factors Influencing SPEC's Future Price
Supply Mechanism
Currently, SPEC's supply mechanism details and historical patterns are not thoroughly documented in available sources. The token's distribution model and potential supply adjustments remain areas requiring further transparency from the project team.
Institutional and Major Holder Dynamics
- Exchange Listings: Apart from limited platform availability, SPEC has not yet secured listings on major cryptocurrency exchanges. This restricted exposure significantly limits investor accessibility and liquidity, potentially constraining both price stability and growth prospects.
- Market Exposure: The current lack of broad exchange presence may reduce trading volume and hinder the token's ability to attract institutional interest, which could impact long-term price performance.
Macroeconomic Environment
The broader cryptocurrency market remains sensitive to macroeconomic conditions, including monetary policy shifts and inflation trends. However, specific correlations between SPEC's performance and these factors have not been established in the current market phase.
Technology Development and Ecosystem Building
- On-Chain AI Agent Integration: SPEC's underlying project, Spectral, focuses on unlocking the potential of on-chain AI agents. This technological positioning aligns with emerging trends in blockchain-based artificial intelligence applications.
- Ecosystem Expansion: The project's success will largely depend on developer adoption, partnership formation, and the practical deployment of AI-driven solutions within its ecosystem. Currently, the ecosystem is in its developmental stages, requiring further maturation to demonstrate tangible utility and value creation.
Investor interest and technological advancements remain crucial determinants of SPEC's market trajectory. As the project expands its exchange presence and demonstrates practical use cases, market sentiment and price dynamics may evolve accordingly.
III. 2026-2031 SPEC Price Forecast
2026 Outlook
- Conservative prediction: $0.10586 - $0.13572
- Neutral prediction: $0.13572
- Optimistic prediction: $0.14522 (requires favorable market conditions and increased adoption)
2027-2029 Outlook
- Market stage expectation: SPEC may enter a gradual growth phase as the project matures and expands its ecosystem presence
- Price range forecast:
- 2027: $0.09271 - $0.19104
- 2028: $0.10111 - $0.24034
- 2029: $0.1929 - $0.22742
- Key catalysts: Potential technological developments, strategic partnerships, and broader market recovery cycles could serve as primary drivers for price appreciation
2030-2031 Long-term Outlook
- Baseline scenario: $0.14636 - $0.21523 (assuming steady ecosystem development and sustained user engagement)
- Optimistic scenario: $0.25613 - $0.29702 (contingent upon significant platform upgrades and expanded use cases)
- Transformational scenario: $0.35089 (under exceptionally favorable conditions including mass adoption and favorable regulatory developments)
- 2026-02-03: SPEC trading within projected range as market participants assess long-term growth potential
| Year |
Predicted High Price |
Predicted Average Price |
Predicted Low Price |
Price Change |
| 2026 |
0.14522 |
0.13572 |
0.10586 |
0 |
| 2027 |
0.19104 |
0.14047 |
0.09271 |
3 |
| 2028 |
0.24034 |
0.16575 |
0.10111 |
22 |
| 2029 |
0.22742 |
0.20305 |
0.1929 |
49 |
| 2030 |
0.29702 |
0.21523 |
0.14636 |
58 |
| 2031 |
0.35089 |
0.25613 |
0.18953 |
88 |
IV. SPEC Professional Investment Strategy and Risk Management
SPEC Investment Methodology
(1) Long-term Holding Strategy
- Suitable for: Investors seeking exposure to blockchain automation and AI-driven smart contract development with medium to long-term horizons
- Operational Recommendations:
- Consider accumulating positions during market corrections when price approaches support levels around $0.12-0.13
- Monitor project development milestones and adoption metrics for Spectral's natural language to Solidity conversion technology
- Utilize Gate Web3 Wallet for secure storage with multi-signature protection
(2) Active Trading Strategy
- Technical Analysis Tools:
- Moving Averages: Use 20-day and 50-day moving averages to identify trend direction; recent 7-day gain of 74.89% suggests potential momentum
- Volume Analysis: Monitor 24-hour trading volume ($125,137.64) against historical averages to confirm breakout validity
- Swing Trading Key Points:
- Set stop-loss orders 10-15% below entry points given the token's high volatility
- Watch for resistance levels near the 24-hour high of $0.18234 for potential profit-taking opportunities
SPEC Risk Management Framework
(1) Asset Allocation Principles
- Conservative Investors: 1-2% of crypto portfolio allocation
- Aggressive Investors: 3-5% of crypto portfolio allocation
- Professional Investors: Up to 5-8% with active monitoring and hedging strategies
(2) Risk Hedging Solutions
- Portfolio Diversification: Combine SPEC with established layer-1 tokens and stablecoins to balance volatility exposure
- Position Sizing: Scale into positions gradually rather than single large entries given the 96.81% decline from yearly highs
(3) Secure Storage Solutions
- Hot Wallet Recommendation: Gate Web3 Wallet for convenient trading access with enhanced security features
- Cold Storage Solution: Hardware wallets for long-term holdings exceeding 30% of total SPEC position
- Security Considerations: Enable two-factor authentication, regularly update wallet software, and never share private keys or seed phrases
V. SPEC Potential Risks and Challenges
SPEC Market Risks
- Extreme Volatility: The token has experienced a 96.81% decline from its yearly high of $18.67, demonstrating significant price instability
- Low Liquidity: With a market cap of approximately $1.22 million and only 7 exchange listings, order book depth may be limited
- Limited Circulation: Only 9% of total supply (9 million tokens out of 100 million max supply) is currently circulating, creating potential dilution concerns
SPEC Regulatory Risks
- Smart Contract Regulation: Automated code generation tools may face scrutiny as regulators examine AI-driven financial applications
- Securities Classification: Tokens associated with AI and automation platforms may attract regulatory attention regarding their utility versus security nature
- Compliance Evolution: Changing regulatory frameworks globally could impact project operations and token utility
SPEC Technical Risks
- Smart Contract Vulnerabilities: The ERC-20 token contract at 0xAdF7C35560035944e805D98fF17d58CDe2449389 requires continuous security audits
- Platform Adoption: Success depends on developers and enterprises adopting Spectral's natural language to Solidity conversion technology
- Competition: Emerging AI and blockchain automation projects may offer similar or superior solutions
VI. Conclusion and Action Recommendations
SPEC Investment Value Assessment
Spectral presents an innovative approach to blockchain development through natural language processing and automated smart contract generation. The project's focus on democratizing Web3 development could capture growing demand for accessible blockchain tools. However, the token has demonstrated extreme volatility with a 96.81% year-over-year decline, and the low circulating supply ratio of 9% presents potential dilution risks. While recent 7-day performance shows a 74.89% gain, investors should approach with caution given the limited market capitalization of approximately $1.22 million and relatively small holder base of 6,308 addresses.
SPEC Investment Recommendations
✅ Beginners: Consider allocating no more than 1-2% of crypto portfolio after thorough research; prioritize learning about project fundamentals before investing
✅ Experienced Investors: May consider 3-5% allocation with active monitoring of development milestones and market sentiment; implement strict stop-loss protocols
✅ Institutional Investors: Conduct comprehensive due diligence on technology stack, team credentials, and competitive positioning; consider pilot positions with 2-3% allocation pending further market validation
SPEC Trading Participation Methods
- Spot Trading: Available on Gate.com and 6 other exchanges; use limit orders to optimize entry prices during volatile periods
- Dollar-Cost Averaging: Systematic periodic purchases can reduce timing risk in this volatile asset
- Portfolio Integration: Combine with established DeFi and infrastructure tokens to balance risk-reward profiles
Cryptocurrency investment carries extremely high risks, and this article does not constitute investment advice. Investors should make prudent decisions based on their own risk tolerance and are advised to consult professional financial advisors. Never invest more than you can afford to lose.
FAQ
What is SPEC token? What are its main uses and value sources?
SPEC token is the governance and incentive mechanism of the Spectral ecosystem. It drives platform functionality, enhances user experience, and derives value from community participation and platform incentives.
What are the main factors affecting SPEC price?
SPEC price is primarily influenced by market demand, trading volume, cryptocurrency market sentiment, regulatory developments, and macroeconomic factors such as interest rate changes. Project fundamentals and ecosystem adoption also play key roles in price movements.
SPEC price prediction utilizes technical analysis examining price charts, trading volume trends, and market momentum. Key tools include moving averages, RSI indicators, and MACD analysis. Fundamental analysis evaluates project developments and market sentiment. Machine learning models analyzing historical data patterns also assist predictions.
SPEC is currently trading at ¥1.49, up 5.14% in the last 24 hours. Market cap stands at ¥13.5M with 24h trading volume of ¥2.29M. The token shows strong bullish momentum in recent trading activity.
What are the risks to pay attention to when investing in SPEC tokens?
SPEC token investments carry market volatility risk, regulatory uncertainty, and potential smart contract vulnerabilities. Conduct thorough research and only invest what you can afford to lose.
What distinguishes SPEC from other similar tokens?
SPEC features a community-driven distribution model with 40% allocated to community, 22% to core contributors, and 38% to investors. Spectral has raised approximately 30 million USD, backed by institutions like Polychain Capital, providing stronger ecosystem support compared to similar tokens.
* The information is not intended to be and does not constitute financial advice or any other recommendation of any sort offered or endorsed by Gate.