This comprehensive analysis examines STB (Stabble), an innovative frictionless decentralized exchange on Solana focusing on stablecoin trading. Currently trading at $0.001397 with extreme fear market sentiment, STB offers reduced liquidity requirements compared to competitors. The article analyzes STB's price trajectory from 2026 to 2031, incorporating historical patterns, market supply dynamics, and ecosystem development. It provides professional price forecasts ranging from conservative to optimistic scenarios, with predictions suggesting potential growth from $0.00139 (2026 average) to $0.00223 (2031 average). The guide includes detailed investment strategies suited for different investor profiles, comprehensive risk management frameworks utilizing Gate platform storage solutions, and critical risk assessments. Essential for investors seeking DeFi protocol exposure with strategic recommendations for portfolio allocation and security best practices.
Introduction: STB's Market Position and Investment Value
Stabble (STB), positioned as a new frictionless decentralized exchange (DEX) on the Solana blockchain, has emerged as a significant player in the stablecoin trading sector. The platform processes over 50% of stablecoin volume with remarkably 97% less liquidity than competitors, introducing innovative features that provide liquidity providers with expanded yield farming opportunities and hedging tools. As of February 2026, STB maintains a price around $0.001397, with a circulating supply of approximately 206.39 million tokens and a market capitalization of $288,321. This asset, characterized by its efficient liquidity mechanism and LP-focused incentive structure, is playing an increasingly vital role in the Solana DeFi ecosystem.
This article will comprehensively analyze STB's price trajectory from 2026 to 2031, combining historical patterns, market supply and demand dynamics, ecosystem development, and macroeconomic environment factors to provide investors with professional price forecasts and practical investment strategies.
I. STB Price History Review and Market Status
STB Historical Price Evolution Trajectory
- 2025: STB launched in May and reached a peak of $0.08 on May 22, representing the initial phase of market discovery and early trading activity
- 2026: Price experienced significant decline, dropping to a low of $0.001317 on January 23, reflecting broader market adjustments
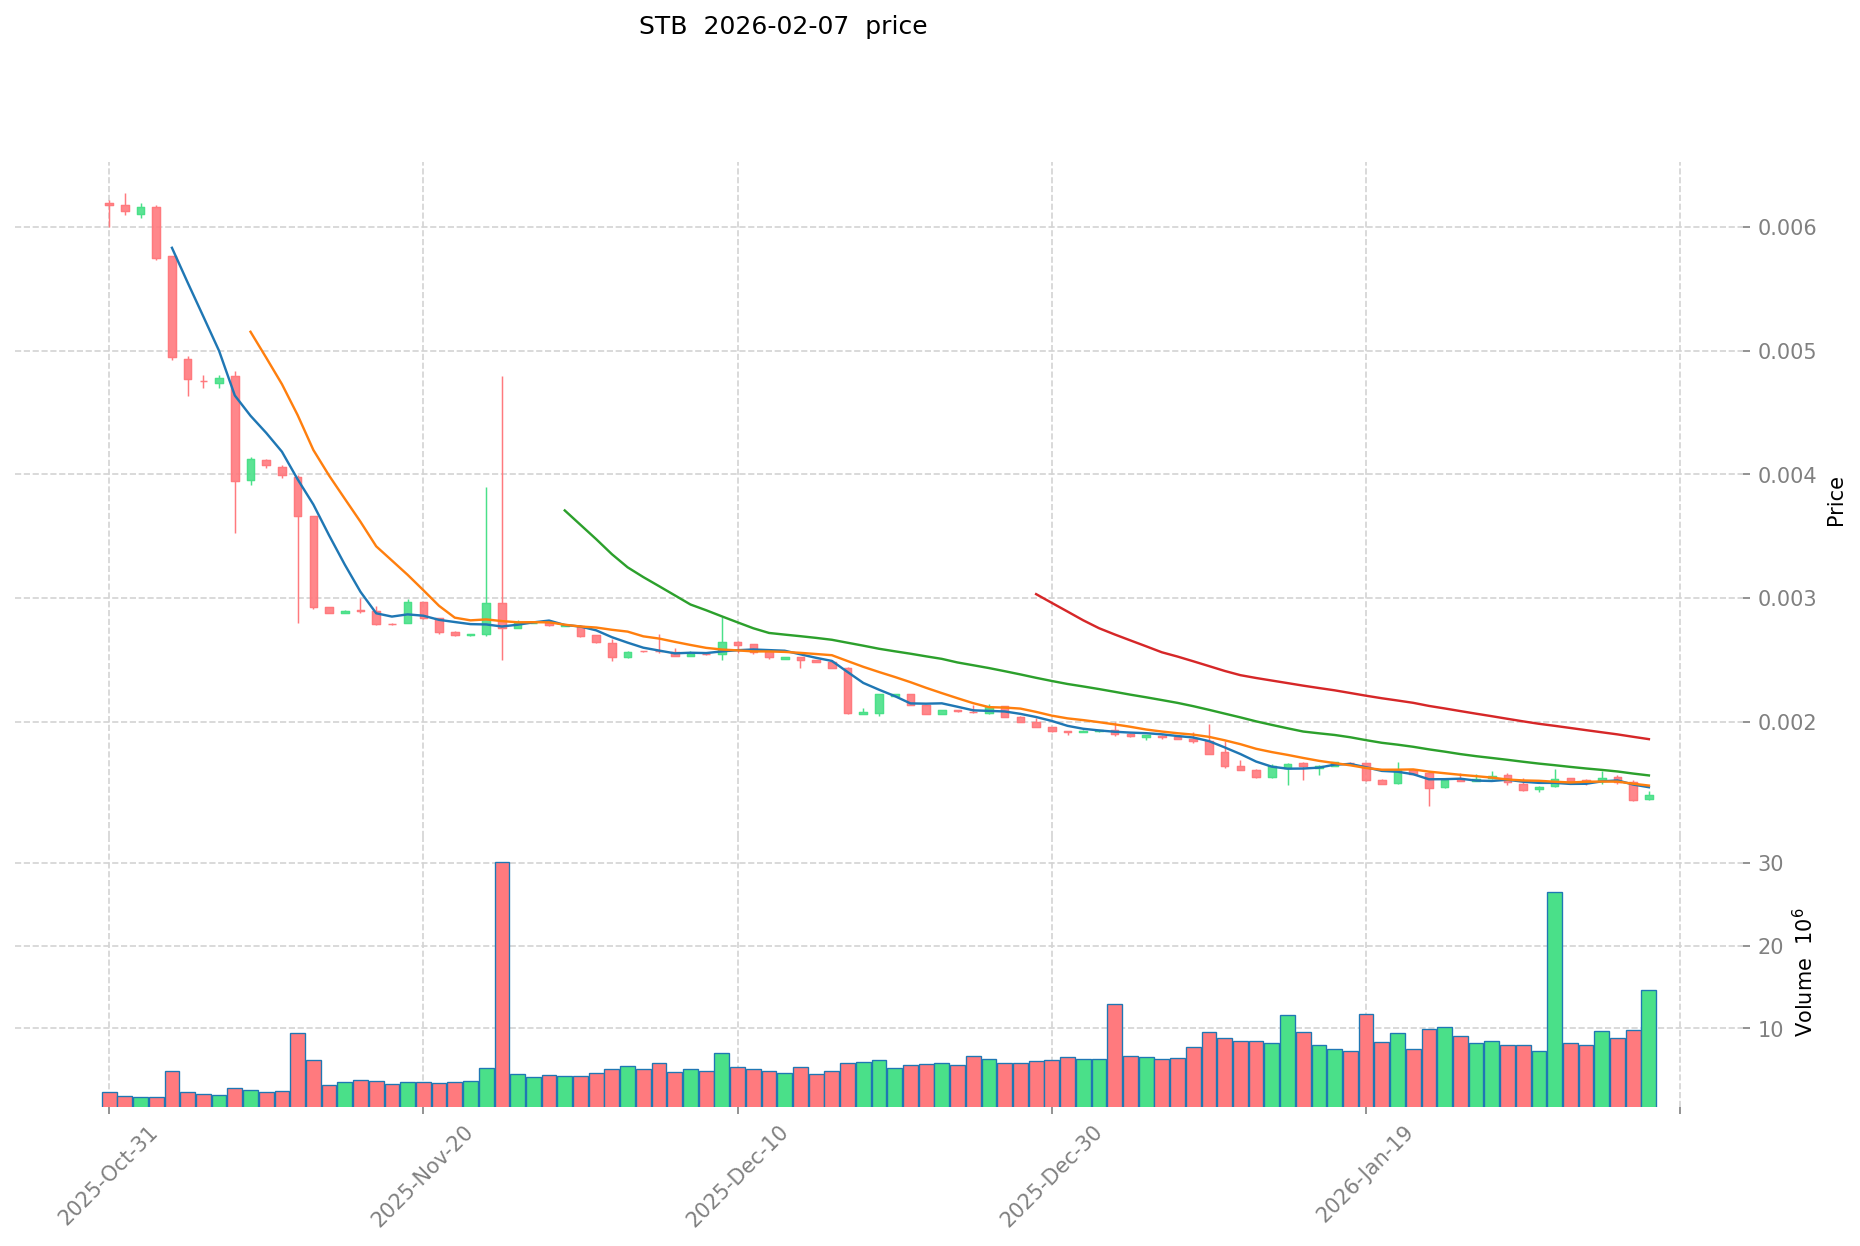
STB Current Market Status
As of February 7, 2026, STB is trading at $0.001397, showing a marginal increase of 0.79% over the past hour. The token has experienced notable price movements across different timeframes, with a 2.17% decrease over the past 24 hours and more substantial declines of 13.55% and 23.7% over the 7-day and 30-day periods respectively.
The current trading range shows a 24-hour high of $0.001428 and a low of $0.001386, indicating relatively tight price action. The 24-hour trading volume stands at approximately $21,413.96, while the market capitalization is recorded at $288,321.10. With a circulating supply of 206,385,897.67 STB tokens out of a maximum supply of 500,000,000, the current circulation ratio is 7.43%. The fully diluted market capitalization is calculated at $698,500.
STB maintains a market dominance of 0.000028% and is currently ranked at position 3565 in the cryptocurrency market. The token is held by 3,829 addresses according to available data. Market sentiment analysis indicates an extreme fear level with a VIX score of 6.
Click to view the current STB market price
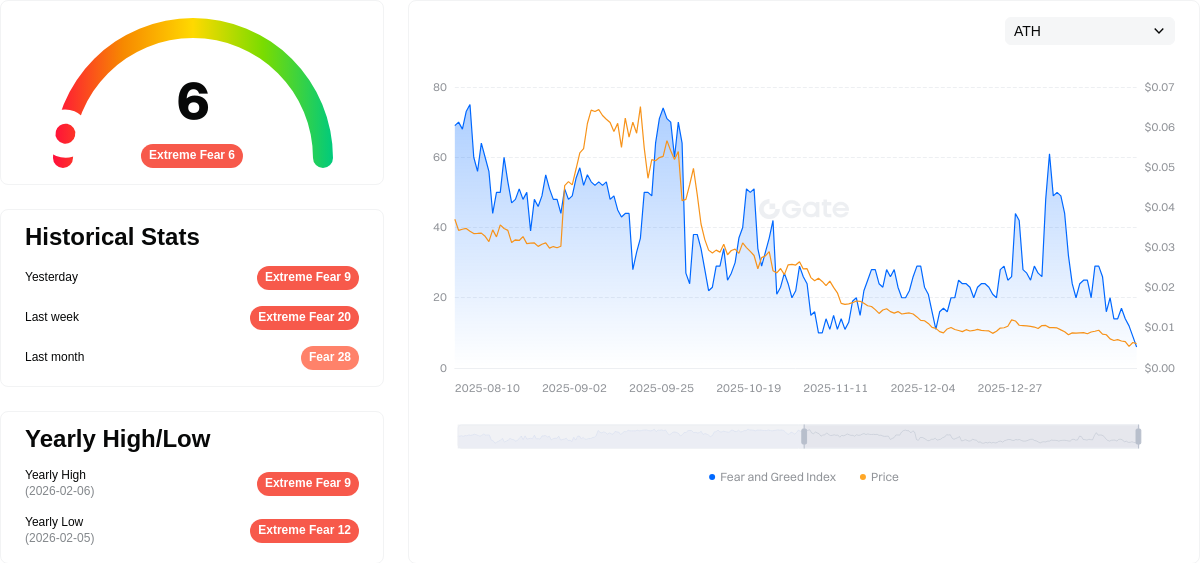
STB Market Sentiment Index
2026-02-07 Fear and Greed Index: 6 (Extreme Fear)
Click to view current Fear & Greed Index
The cryptocurrency market is experiencing extreme fear conditions, with the index hitting a critical low of 6 points. This severe bearish sentiment indicates widespread panic among investors, creating significant market volatility. Historically, such extreme fear episodes present contrarian opportunities for long-term investors. However, caution remains essential as further downside risks may persist. Market participants should closely monitor key support levels and fundamental developments before making investment decisions.
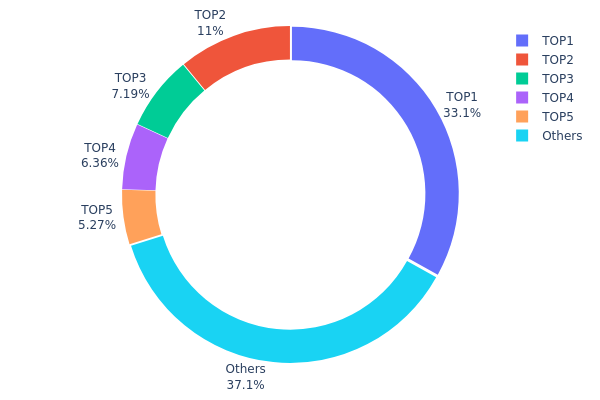
STB Holding Distribution
The holding distribution chart illustrates the concentration of STB tokens across different wallet addresses, providing insights into the token's ownership structure and potential market dynamics. This metric reveals how tokens are allocated between large holders (whales) and smaller participants, which directly impacts market liquidity, price stability, and the degree of decentralization.
According to the current data, the top address holds approximately 156,772.46K STB tokens, representing 33.06% of the total supply, while the top five addresses collectively control 243,046.79K tokens, accounting for 51.24% of the circulating supply. The remaining 37.16% is distributed among other addresses. This concentration pattern suggests a moderately centralized ownership structure, where a significant portion of tokens remains in the hands of a few major holders. Such distribution may expose the market to heightened volatility risks, as large-scale sell-offs from these whale addresses could trigger substantial price fluctuations.
From a market structure perspective, this level of concentration indicates that STB has not yet achieved broad-based distribution across a diverse holder base. The dominance of top addresses could potentially limit liquidity during high-volume trading periods and create vulnerability to coordinated market manipulation. However, the presence of 37.16% held by smaller addresses demonstrates some level of community participation, which provides a foundation for gradual decentralization as the project matures and token distribution becomes more balanced over time.
Click to view the current STB Holding Distribution
| Top |
Address |
Holding Qty |
Holding (%) |
| 1 |
8Fv7wW...T4pnRd |
156772.46K |
33.06% |
| 2 |
DQa7BN...iyVo5W |
52008.35K |
10.96% |
| 3 |
6WSnxM...WXchUB |
34094.92K |
7.19% |
| 4 |
u6PJ8D...ynXq2w |
30171.06K |
6.36% |
| 5 |
CqKDQS...NJJoVE |
25000.00K |
5.27% |
| - |
Others |
176071.39K |
37.16% |
II. Core Factors Influencing STB's Future Price
Supply Mechanism
-
Raw Material Price Volatility: The price trajectory of STB (Set-Top Boxes) is significantly influenced by fluctuations in raw material costs. Historical patterns demonstrate that periods of rising material prices typically compress manufacturer margins, potentially leading to price adjustments that reflect production cost pressures.
-
Labor Cost Dynamics: Elevated labor costs represent a persistent challenge in the STB manufacturing sector. These costs directly impact the final product pricing structure, as manufacturers must balance competitive positioning with sustainable profit margins.
-
Supply Chain Stability: Supply chain disruptions pose substantial risks to price stability. Interruptions in the flow of core components can create supply shortages, driving prices upward during periods of constrained availability.
Institutional and Market Dynamics
-
Enterprise Adoption: Major telecommunications and broadcasting companies continue to represent the primary demand drivers for STB products. Their procurement strategies and volume requirements significantly influence market pricing dynamics.
-
Competitive Landscape: The STB market features participation from established manufacturers including Jiuzhou, ZTE, Skyworth Digital, Roku, Apple, Huawei, Samsung, and others. This competitive environment creates pricing pressure while simultaneously driving innovation in product offerings.
Macroeconomic Environment
-
Technology Transition Impact: The ongoing shift from analog to digital broadcasting technologies continues to shape market demand. Markets completing this transition may experience stabilized demand patterns, while those still in transition phases may see elevated procurement activity.
-
Regional Market Development: Geographic variations in digital infrastructure deployment create differentiated demand patterns. Regions with aggressive digitalization policies may demonstrate stronger growth trajectories.
Technology Development and Ecosystem Construction
-
Broadcasting Technology Evolution: The development of new broadcasting standards and technologies, including 4K/8K capabilities, integrated broadband-broadcast (IBB) systems, and enhanced streaming capabilities, drives product differentiation and influences pricing tiers.
-
Smart Home Integration: The convergence of STB functionality with broader smart home ecosystems and IoT applications creates opportunities for premium product positioning, potentially supporting higher price points for advanced feature sets.
-
Platform Consolidation: The competitive pressure from OTT (over-the-top) streaming platforms influences traditional STB demand patterns. Manufacturers responding with hybrid solutions that integrate traditional broadcast reception with streaming capabilities may command different pricing structures than conventional products.
III. 2026-2031 STB Price Prediction
2026 Outlook
- Conservative prediction: $0.00094
- Neutral prediction: $0.00139
- Optimistic prediction: $0.00173
Based on current market analysis, STB is expected to maintain relatively stable price levels in 2026. The token may fluctuate within a narrow range as the project continues its development phase and establishes its market position.
2027-2029 Outlook
- Market stage expectation: gradual growth phase with increasing adoption
- Price range prediction:
- 2027: $0.00094 - $0.00168 (11% average price increase)
- 2028: $0.00122 - $0.00216 (16% average price increase)
- 2029: $0.00179 - $0.00251 (35% average price increase)
- Key catalysts: project development milestones, ecosystem expansion, and potential partnerships that could drive user adoption and increase token utility
During this mid-term period, STB shows progressive growth potential with average prices rising from $0.00156 in 2027 to $0.00189 in 2029. The acceleration in price appreciation, particularly noticeable in 2029, suggests the project may enter a more mature phase of development.
2030-2031 Long-term Outlook
- Baseline scenario: $0.00128 - $0.00227 (assuming steady ecosystem development)
- Optimistic scenario: $0.00208 - $0.00259 (assuming enhanced market conditions and successful implementation of roadmap objectives)
- Transformative scenario: prices could reach higher levels if the project achieves significant technological breakthroughs or captures substantial market share
The long-term forecast indicates a potential 57% average price increase by 2030 and 59% by 2031 compared to 2026 levels. The 2031 predictions suggest STB could trade between $0.00208 and $0.00259, reflecting maturation of the project and its market position. However, these projections remain subject to various market conditions, regulatory developments, and the project's ability to execute its strategic vision.
- 2026-02-07: STB trading within predicted range as market participants assess long-term potential
| Year |
Predicted High Price |
Predicted Average Price |
Predicted Low Price |
Price Change |
| 2026 |
0.00173 |
0.00139 |
0.00094 |
0 |
| 2027 |
0.00168 |
0.00156 |
0.00094 |
11 |
| 2028 |
0.00216 |
0.00162 |
0.00122 |
16 |
| 2029 |
0.00251 |
0.00189 |
0.00179 |
35 |
| 2030 |
0.00227 |
0.0022 |
0.00128 |
57 |
| 2031 |
0.00259 |
0.00223 |
0.00208 |
59 |
IV. STB Professional Investment Strategy and Risk Management
STB Investment Methodology
(I) Long-term Holding Strategy
- Suitable for: Investors seeking exposure to decentralized exchange infrastructure on Solana with risk tolerance for emerging DeFi protocols
- Operational Recommendations:
- Consider accumulation during periods of reduced volatility, monitoring the project's progress in capturing stablecoin trading volume
- Evaluate position sizing based on STB's current market cap ($288,321) relative to portfolio allocation
- Storage Solution: Gate Web3 Wallet offers secure storage for Solana-based assets including STB
(II) Active Trading Strategy
- Technical Analysis Tools:
- Volume Analysis: Monitor the 24-hour trading volume ($21,413) relative to market cap to assess liquidity conditions
- Price Action: Track key support levels near recent lows ($0.001386) and resistance near 24-hour highs ($0.001428)
- Swing Trading Considerations:
- Recent 7-day decline of 13.55% may present entry opportunities for risk-tolerant traders
- Set stop-loss orders to manage downside risk given the token's volatility patterns
STB Risk Management Framework
(I) Asset Allocation Principles
- Conservative Investors: 0.5-1% of crypto portfolio allocation
- Aggressive Investors: 2-3% of crypto portfolio allocation
- Professional Investors: 3-5% with active monitoring protocols
(II) Risk Hedging Solutions
- Diversification Strategy: Combine STB exposure with established DeFi blue-chips to reduce protocol-specific risk
- Position Sizing: Limit initial exposure given the token's early stage and limited exchange listings (currently 1 exchange)
(III) Secure Storage Solutions
- Hot Wallet Option: Gate Web3 Wallet for active trading and staking participation
- Cold Storage Approach: Hardware wallet solutions supporting Solana ecosystem assets for long-term holdings
- Security Precautions: Enable two-factor authentication, verify contract address (STBuyENwJ1GP4yNZCjwavn92wYLEY3t5S1kVS5kwyS1), and maintain separate wallets for different risk profiles
V. STB Potential Risks and Challenges
STB Market Risks
- Liquidity Constraints: With only 1 exchange listing and $21,413 in 24-hour volume, exit liquidity may be limited during market stress
- Price Volatility: 30-day decline of 23.7% demonstrates significant downside potential characteristic of low market cap assets
- Circulating Supply Dynamics: With only 7.43% of tokens currently circulating, future unlocks could create selling pressure
STB Regulatory Risks
- DeFi Protocol Oversight: Evolving regulatory frameworks for decentralized exchanges may impact operational parameters
- Stablecoin Trading Scrutiny: As a platform focused on stablecoin volume, regulatory developments affecting stablecoin markets could influence STB's utility proposition
- Cross-border Trading Regulations: Changes in international crypto trading rules may affect accessibility and adoption
STB Technical Risks
- Smart Contract Vulnerabilities: DEX protocols face inherent risks from potential code exploits or economic attack vectors
- Network Dependencies: As a Solana-based protocol, STB is exposed to any technical issues or downtime on the Solana network
- Competition Dynamics: Claims of processing over 50% of stablecoin volume require ongoing validation and defense against established competitors
VI. Conclusion and Action Recommendations
STB Investment Value Assessment
STB presents a high-risk, high-reward proposition as an emerging DEX on Solana targeting stablecoin trading efficiency. The project's value proposition centers on reduced liquidity requirements and innovative LP features. However, investors should weigh this potential against significant risks including limited liquidity (1 exchange listing), substantial recent price declines (23.7% over 30 days), and low circulating supply (7.43%). The token's current price of $0.001397 represents a 98.3% decline from its peak, suggesting either significant downside realization or potential recovery opportunity depending on project execution.
STB Investment Recommendations
✅ Beginners: Approach with extreme caution; if interested, limit exposure to less than 1% of crypto portfolio and focus on understanding DeFi mechanics before investing
✅ Experienced Investors: Consider small speculative positions (1-2% allocation) while monitoring trading volume trends and protocol development milestones
✅ Institutional Investors: Conduct thorough due diligence on smart contract audits and team credentials; consider waiting for additional exchange listings and proven track record before significant allocation
STB Trading Participation Methods
- Spot Trading: Access STB through Gate.com for direct token purchases with standard market or limit orders
- Portfolio Integration: Incorporate STB as part of a diversified DeFi protocol exposure strategy alongside established projects
- Active Monitoring: Track developments through official channels (Twitter: @stabbleorg) and protocol metrics to inform position adjustments
Cryptocurrency investment carries extreme risks, and this article does not constitute investment advice. Investors should make prudent decisions based on their own risk tolerance and are advised to consult professional financial advisors. Never invest more than you can afford to lose.
FAQ
What is STB? What are its basic functions and purposes?
STB is a cryptocurrency token designed for decentralized web3 applications. Its primary functions include governance participation, transaction facilitation, and ecosystem incentives. It serves as a utility token enabling smart contract interactions and decentralized finance operations within its blockchain network.
What are the main factors affecting STB price?
STB price is primarily influenced by market demand, trading volume, technological developments, regulatory policies, and competitive dynamics. Supply chain conditions and production costs also play significant roles in determining price fluctuations.
How to predict STB price? What are the analysis methods?
STB price prediction uses technical analysis methods like RSI indicator to identify overbought and oversold zones. Historical data, trading volume, and market sentiment are key factors. Monitor RSI levels below 30 for oversold signals and above 70 for overbought conditions to guide prediction strategies.
What is STB's historical price trend? What major price movements have occurred in the past?
STB's historical price data shows gradual market discovery phases. Key movements occurred during network adoption phases and market cycles. Price volatility reflects market sentiment and development milestones. Limited historical data suggests early stage positioning with growth potential ahead.
What risks should I be aware of when investing in STB for price prediction?
STB price prediction involves market volatility risk where prices can fluctuate sharply, potentially causing capital loss. Regulatory uncertainty and liquidity risks also exist. Investors bear full responsibility for their investment decisions.
How reliable are STB price predictions? How should we view prediction results rationally?
STB price predictions have moderate reliability; reference multiple analysis sources and market trends for comprehensive insight. Consider historical data, market volume, and project fundamentals as key indicators. Always use updated information for decision-making.
* The information is not intended to be and does not constitute financial advice or any other recommendation of any sort offered or endorsed by Gate.