This comprehensive analysis examines USTC price trajectory from 2026 to 2031, providing investors with professional forecasts and strategic guidance. Currently trading at $0.004448 with a market cap of $395,626, USTC has declined 60.52% annually, reflecting extreme market fear and significant volatility. The article reviews historical price evolution, analyzes core factors including supply mechanisms and ecosystem developments, and presents tiered price predictions: $0.00257-$0.00559 for 2026, scaling to $0.00674-$0.01132 by 2031. It outlines professional investment strategies for varying risk profiles, emphasizes comprehensive risk management frameworks, and addresses critical challenges including extreme volatility, low liquidity, and regulatory uncertainties. Designed for experienced traders and institutional investors, this guide equips participants with data-driven insights for navigating USTC's speculative opportunities through proper due diligence and risk controls on Gate exchange.
Introduction: USTC's Market Position and Investment Value
TerraUSD Classic (USTC), as an algorithmic stablecoin designed for scalability and cross-chain functionality, has experienced significant market fluctuations since its launch in 2019. As of 2026, USTC maintains a market capitalization of approximately $395,625, with a circulating supply of about 88.94 million tokens, and trades at around $0.004448. This asset, originally conceived as a decentralized stablecoin utilizing a burn-and-mint mechanism with LUNA reserves, continues to exist within the crypto ecosystem despite its departure from its intended peg.
This article provides a comprehensive analysis of USTC's price trajectory from 2026 to 2031, examining historical patterns, market supply-demand dynamics, ecosystem developments, and macroeconomic factors to offer professional price forecasts and practical investment strategies for market participants.
I. USTC Price History Review and Market Status
USTC Historical Price Evolution Trajectory
- 2021: USTC reached a notable price level of $1.091 in May, representing a period of relative stability for the algorithmic stablecoin
- 2025: The token experienced significant volatility, with price declining to $0.0057459 in November, marking a substantial contraction from previous levels
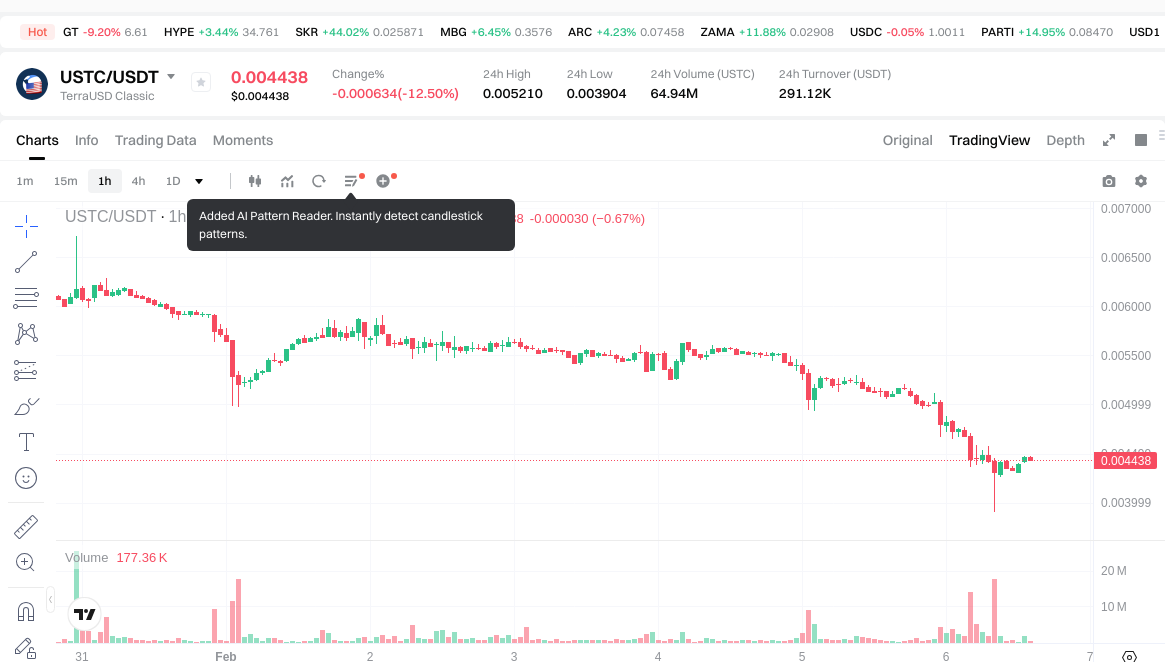
- 2026: Over the past year, USTC has declined approximately 60.52%, with the current price standing at $0.004448 as of February 6, 2026
USTC Current Market Status
As of February 6, 2026, USTC is trading at $0.004448, representing a 12.3% decrease over the past 24 hours. The token has experienced continued downward pressure, with a 26.09% decline over the past week and a 37.81% drop over the past month.
The 24-hour trading range shows USTC fluctuating between $0.003904 and $0.00521, indicating notable intraday volatility. Trading volume stands at approximately $291,225, while the market capitalization is approximately $395,626, with a circulating supply of 88,944,638.52 USTC tokens.
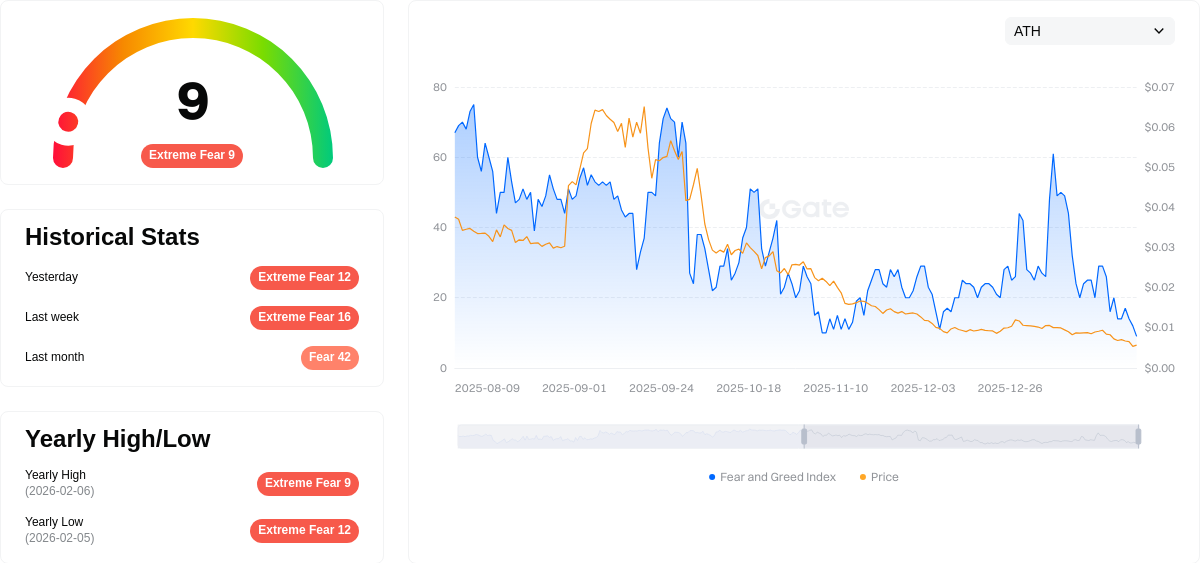
The current market sentiment index indicates a reading of 9, classified as "Extreme Fear," reflecting cautious investor sentiment in the broader cryptocurrency market. USTC maintains listings on 15 exchanges and has approximately 49,505 holders. The token's market dominance stands at 0.000016%, with the market cap to fully diluted valuation ratio at 100%.
Click to view current USTC market price
USTC Market Sentiment Indicator
2026-02-06 Fear and Greed Index: 9 (Extreme Fear)
Click to view current Fear & Greed Index
The cryptocurrency market is currently experiencing extreme fear, with the index dropping to 9. This indicates severe market pessimism and heightened risk aversion among investors. When fear reaches such extreme levels, it typically suggests potential oversold conditions and may present contrarian opportunities for long-term investors. However, caution remains essential as market volatility could persist. Traders should implement proper risk management strategies and avoid making impulsive decisions during such turbulent periods. Monitor market developments closely before making any trading moves.
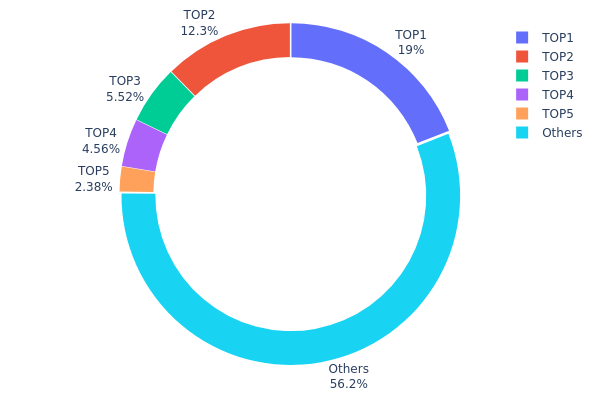
USTC Holding Distribution
The holding distribution chart illustrates the concentration of token ownership across different address categories, reflecting how USTC tokens are allocated among major holders and the broader market participants. This metric serves as a critical indicator of market decentralization and potential price manipulation risks.
Current data reveals a moderate concentration pattern in USTC holdings. The top holder controls approximately 19.04% of the total supply with 56.09 million tokens, while the second-largest address holds 12.32% (36.31 million tokens). The top five addresses collectively account for 43.8% of the circulating supply, leaving 56.2% distributed among other market participants. This distribution structure suggests a semi-centralized ownership model where major holders maintain significant influence over market dynamics, though the majority still resides with a dispersed community.
Such concentration levels present both opportunities and risks for USTC's market structure. The presence of large holders could provide liquidity depth during periods of heightened volatility, yet simultaneously introduces potential vulnerability to coordinated selling pressure or strategic accumulation by whales. The 56.2% distribution among smaller holders indicates reasonable decentralization at the retail level, which may help absorb sudden market shocks. However, any coordinated action by the top three addresses, which collectively control over 36% of supply, could significantly impact short-term price movements and trading volumes.
Click to view current USTC Holding Distribution
| Top |
Address |
Holding Qty |
Holding (%) |
| 1 |
0x32e6...5b4304 |
56090.37K |
19.04% |
| 2 |
0x0d07...b492fe |
36313.08K |
12.32% |
| 3 |
0xf89d...5eaa40 |
16266.29K |
5.52% |
| 4 |
0x9ccb...c38cd6 |
13416.72K |
4.55% |
| 5 |
0x260b...c54cea |
7006.15K |
2.37% |
| - |
Others |
165444.78K |
56.2% |
II. Core Factors Influencing USTC's Future Price
Supply Mechanism
-
1.2% Burn Tax on On-Chain Transactions: The Terra Classic community implemented a 1.2% burn tax mechanism through proposals 3568 and 4159, applying exclusively to on-chain transfers of LUNC and USTC. This deflationary measure aims to reduce circulating supply and control inflationary pressure within the Terra Classic ecosystem. The tax automatically burns 1.2% of transaction amounts during on-chain transfers, though it does not apply to spot or leveraged trading.
-
Historical Pattern: The burn tax mechanism has shown evolving community sentiment over time. Initially implemented to compress supply, the mechanism later saw 75% of LUNC community members vote to reduce the burn rate from 1.2% to 0.2%, reflecting adaptive views on deflationary controls. The differentiated approach—targeting blockchain-layer transactions while preserving exchange efficiency—demonstrates the protocol's balanced policy framework.
-
Current Impact: With USTC's circulating supply approximately 5.58 billion and total supply exceeding 88.9 billion tokens, the burn mechanism continues to influence supply dynamics. However, its effectiveness remains subject to community governance decisions and ongoing market conditions.
Institutional and Major Holder Dynamics
-
Community Holdings: USTC features a distinctive decentralized holding structure, with over 70% of tokens held by the community rather than development teams or institutional entities. This distribution pattern emerged following Terra Classic's major reorganization and reflects strong community-led governance principles.
-
Decentralized Governance: The dispersed holding structure ensures protocol adjustments—such as token burns and monetary policy—are determined through diverse stakeholder participation rather than centralized control. This governance model encourages active member engagement in voting and decision-making processes.
-
Regulatory Developments: The U.S. SEC issued a statement in May 2025 clarifying that protocol-level on-chain staking mechanisms—limited to consensus and governance functions—fall outside securities law jurisdiction. This regulatory framework strengthens USTC's governance compliance while demonstrating how decentralized protocols can grant stakeholders genuine decision-making power without triggering securities classification.
Macroeconomic Environment
-
Market Sentiment and Confidence: USTC's price trajectory remains heavily influenced by overall cryptocurrency market sentiment and investor confidence levels. Following the catastrophic collapse in May 2022, market confidence in algorithmic stablecoins has been substantially diminished, creating persistent headwinds for recovery efforts.
-
Broader Economic Factors: The token's price prospects are affected by market demand patterns, adoption trends, institutional participation, and general economic conditions. Exchange fund flow indicators and their interaction with price movements provide evidence of market dynamics shaping USTC's trajectory.
Technical Development and Ecosystem Building
-
Staking Mechanism Grants Governance Rights: USTC holders can stake tokens to obtain voting rights, creating direct linkage between token commitment and governance participation. Staking amounts translate directly into voting influence within Terra Classic's on-chain governance system, forming an economic stake-weighted governance framework.
-
Community Recovery Initiatives: Despite challenging circumstances, the Terra Classic community has not abandoned USTC. Various proposals have emerged aiming to restore or "re-peg" USTC's value. These include suggestions for creating new utility cases within the Terra Classic ecosystem, potentially using USTC for governance, collateral purposes, or establishing partial reserve backing to provide baseline value.
-
Ecosystem Constraints: USTC's practical usage remains limited following the collapse. While still traded on certain exchanges including Gate.com as a speculative asset, it no longer functions as a stablecoin in DeFi applications due to its inability to maintain peg stability. Current ecosystem applications focus primarily on experimental purposes or arbitrage opportunities during minor price fluctuations, with minimal merchant acceptance or broader adoption.
III. 2026-2031 USTC Price Prediction
2026 Outlook
- Conservative prediction: $0.00257 - $0.00444
- Neutral prediction: $0.00444 (average scenario)
- Optimistic prediction: $0.00559 (requires favorable market conditions and increased adoption)
2027-2029 Outlook
- Market stage expectation: Gradual recovery phase with potential for moderate growth as the token stabilizes and builds market confidence
- Price range predictions:
- 2027: $0.00366 - $0.00632 (12% increase from 2026)
- 2028: $0.00391 - $0.00703 (27% increase from 2026)
- 2029: $0.00463 - $0.00679 (42% increase from 2026)
- Key catalysts: Market sentiment improvement, potential protocol developments, and broader cryptocurrency market trends
2030-2031 Long-term Outlook
- Baseline scenario: $0.00348 - $0.00893 (47% increase from 2026 baseline by 2030)
- Optimistic scenario: $0.00674 - $0.01132 by 2031 (74% increase from 2026, assuming sustained market growth)
- Transformational scenario: Potential to reach $0.01132 (requires significant protocol improvements, widespread adoption, and favorable regulatory environment)
- 2026-02-06: USTC trading within early 2026 projected range of $0.00257 - $0.00559
| Year |
Predicted High Price |
Predicted Average Price |
Predicted Low Price |
Price Change |
| 2026 |
0.00559 |
0.00444 |
0.00257 |
0 |
| 2027 |
0.00632 |
0.00501 |
0.00366 |
12 |
| 2028 |
0.00703 |
0.00567 |
0.00391 |
27 |
| 2029 |
0.00679 |
0.00635 |
0.00463 |
42 |
| 2030 |
0.00893 |
0.00657 |
0.00348 |
47 |
| 2031 |
0.01132 |
0.00775 |
0.00674 |
74 |
IV. USTC Professional Investment Strategy and Risk Management
USTC Investment Methodology
(1) Long-term Holding Strategy
- Target Investors: Risk-tolerant investors with understanding of algorithmic stablecoin mechanisms
- Operational Recommendations:
- Conduct thorough due diligence on the Terra Classic ecosystem recovery progress
- Consider dollar-cost averaging to mitigate entry price volatility
- Storage Solution: Use Gate Web3 Wallet for secure multi-chain asset management, supporting both LUNC and ETH contract addresses
(2) Active Trading Strategy
- Technical Analysis Tools:
- Volume Analysis: Monitor the 24-hour trading volume of $291,225 to identify liquidity trends
- Price Action: Track key support at $0.003904 and resistance at $0.00521 based on 24-hour range
- Swing Trading Key Points:
- Consider the significant volatility with -26.09% weekly decline when setting stop-loss orders
- Monitor correlation with LUNC ecosystem developments
USTC Risk Management Framework
(1) Asset Allocation Principles
- Conservative Investors: 0-1% portfolio allocation due to extreme volatility
- Aggressive Investors: 2-5% maximum allocation with strict risk controls
- Professional Investors: Up to 10% with hedging strategies and continuous monitoring
(2) Risk Hedging Solutions
- Portfolio Diversification: Balance USTC exposure with stablecoin alternatives and traditional assets
- Position Sizing: Limit single trade exposure to minimize impact of adverse price movements
(3) Secure Storage Solutions
- Multi-chain Wallet Recommendation: Gate Web3 Wallet, supporting both LUNC native and ETH ERC-20 contract addresses
- Cold Storage Option: For holdings exceeding $10,000 equivalent, consider offline storage methods
- Security Considerations: Verify contract addresses (LUNC: uusd, ETH: 0xa47c8bf37f92aBed4A126BDA807A7b7498661acD) before transactions to avoid phishing scams
V. USTC Potential Risks and Challenges
USTC Market Risks
- Extreme Volatility: USTC has declined -60.52% over the past year and -37.81% in the last 30 days, indicating substantial price instability
- Low Liquidity: With a market capitalization of approximately $395,626 and ranking at 3220, limited liquidity may result in significant slippage
- De-pegging History: Trading at $0.004448, far below the original $1 peg, reflects fundamental mechanism failure
USTC Regulatory Risks
- Algorithmic Stablecoin Scrutiny: Increased regulatory attention on algorithmic stablecoins following historical market events may impact trading availability
- Compliance Uncertainty: Evolving regulatory frameworks across jurisdictions may affect USTC's operational status
- Restricted Access: Potential delisting risks from exchanges due to regulatory pressure or low trading activity
USTC Technical Risks
- Mechanism Vulnerability: The burn-mint mechanism with LUNA that previously failed raises concerns about protocol stability
- Smart Contract Risk: Dual-chain deployment (LUNC and ETH) creates multiple points of potential technical failure
- Recovery Uncertainty: The Terra Classic ecosystem's ability to restore functionality and user confidence remains unproven
VI. Conclusion and Action Recommendations
USTC Investment Value Assessment
USTc presents a speculative opportunity within the crypto asset landscape, but carries substantial risk. Currently trading at $0.004448 with a fully diluted market cap of approximately $395,626, the token has experienced significant decline from its algorithmic stablecoin origins. The -60.52% annual decline and minimal market dominance (0.000016%) indicate that USTC functions primarily as a speculative vehicle rather than a functional stablecoin. Short-term risks include continued volatility, limited liquidity across its 15 exchange listings, and uncertain ecosystem recovery trajectory.
USTC Investment Recommendations
✅ Beginners: Avoid USTC investment due to extreme complexity, historical failure, and requirement for advanced understanding of algorithmic stablecoin mechanics
✅ Experienced Investors: Consider only speculative micro-positions (under 1% portfolio allocation) with clear exit strategies and acceptance of total loss potential
✅ Institutional Investors: Evaluate USTC only as part of diversified crypto market research or hedging strategies, with comprehensive risk assessment frameworks
USTC Trading Participation Methods
- Spot Trading: Available on Gate.com and 14 other exchanges with direct USTC purchases
- Cross-chain Transactions: Access via LUNC native blockchain or Ethereum network using verified contract addresses
- Web3 Integration: Utilize Gate Web3 Wallet for decentralized asset management across multiple chains
Cryptocurrency investment carries extreme risk, and this article does not constitute investment advice. Investors should make prudent decisions based on their own risk tolerance and are advised to consult professional financial advisors. Never invest more than you can afford to lose.
FAQ
What is the historical price trend of USTC token?
USTC has experienced significant volatility since its inception. As of February 2026, USTC trades around $0.048 USD. The token has shown recovery patterns following market cycles, with trading volume concentrated on major platforms. Historical data indicates USTC price movements reflect broader market sentiment and ecosystem developments.
What are the main factors affecting USTC price?
USTC price is mainly influenced by community governance control (over 70% held by community), 1.2% burn tax on chain transfers, staking mechanism for voting rights, market confidence recovery after the 2022 collapse, and token economic model adjustments.
How to analyze and predict USTC's future price trends?
Analyze USTC's price by tracking trading volume, market capitalization trends, and on-chain metrics. Monitor historical price patterns and market sentiment. Consider fundamental developments and adoption rates. Technical analysis with support/resistance levels helps identify potential breakout points for future price movements.
What are the differences between USTC and other stablecoins or cryptocurrencies?
USTC differs from traditional stablecoins by not maintaining a strict 1:1 peg with the US dollar through actual reserves. Unlike USDC, USTC operates on alternative stabilization mechanisms, potentially offering different risk-return profiles and price volatility characteristics compared to fully collateralized stablecoins.
What are the risks and uncertainties in USTC price prediction?
USTC price prediction faces market volatility, technological changes, and regulatory shifts. Market sentiment, competition, and trading volume fluctuations significantly impact price movements, creating inherent uncertainty.
What is the professional analysts' price prediction for USTC?
Professional analysts' USTC price predictions vary widely. Some predict prices could fall to $0.001, while others forecast highs up to $0.10. Most analysts expect USTC to trade around $0.01 in 2026.
* The information is not intended to be and does not constitute financial advice or any other recommendation of any sort offered or endorsed by Gate.