This comprehensive analysis provides expert forecasts for XTAG token pricing from 2026 through 2031, combining historical trends, market dynamics, and macroeconomic factors. The article addresses investor concerns regarding XTAG's current market position, trading at $0.003576 with moderate price volatility and extreme fear sentiment. Readers will discover multi-year price predictions ranging from $0.002 to $0.00727 across conservative, neutral, and optimistic scenarios, alongside detailed analysis of supply mechanisms and institutional holder dynamics. The guide offers practical investment methodologies including long-term holding and active trading strategies tailored for different investor profiles, supported by risk management frameworks and secure storage recommendations via Gate Web3 Wallet. Key sections examine technological developments in decentralized AI agents and Bitcoin Layer 2 infrastructure, regulatory challenges, and actionable trading guidance on Gate exchange. Whether you're a beginner or exp
xHashtag AI (XTAG), as a Bitcoin Layer 2 solution focused on building, managing, and deploying decentralized AI agents, has been working to democratize personalized AI experiences since its launch. As of 2026, XTAG maintains a market capitalization of approximately $236,620, with a circulating supply of around 66.17 million tokens, and the price hovering around $0.003576. This asset, operating within the intersection of blockchain infrastructure and artificial intelligence, is gradually establishing its presence in the decentralized AI agent ecosystem.
This article will comprehensively analyze XTAG's price trajectory from 2026 to 2031, combining historical patterns, market supply-demand dynamics, ecosystem development, and macroeconomic conditions to provide investors with professional price forecasts and practical investment strategies.
I. XTAG Price History Review and Market Status
XTAG Historical Price Evolution Trajectory
- December 2021: XTAG reached its all-time high at $4.52, marking a significant milestone in its early trading history.
- February 2026: The token experienced substantial downward pressure, recording an all-time low of $0.00320825, reflecting a significant decline from its historical peak.
XTAG Current Market Situation
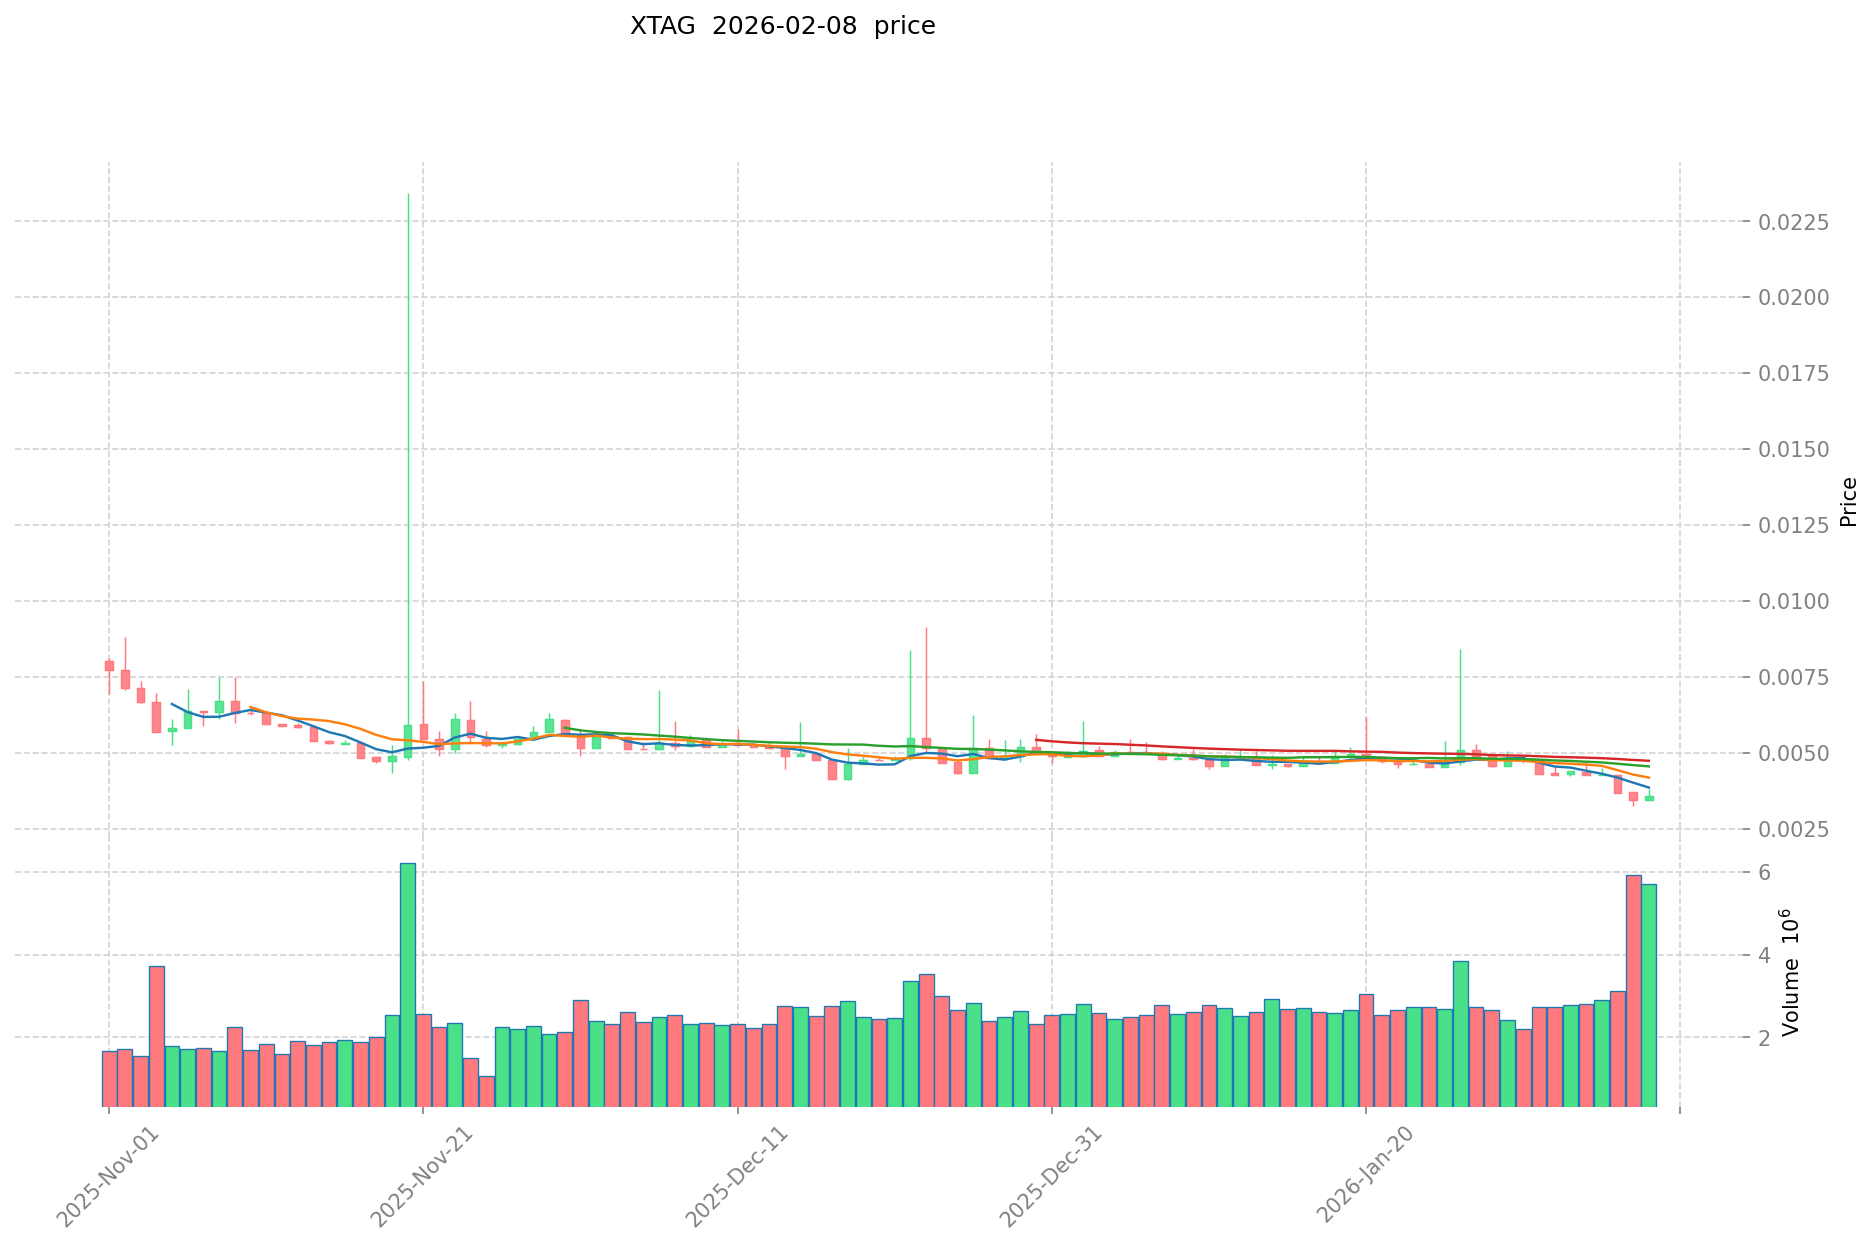
As of February 8, 2026, XTAG is trading at $0.003576, showing mixed short-term and long-term performance. The token has demonstrated a modest 24-hour gain of 3.77%, with the price fluctuating between $0.00344 and $0.003818 during this period. However, the broader trend reveals challenges, with a 7-day decline of 17.36% and a 30-day decrease of 25.79%.
From a yearly perspective, XTAG has experienced a substantial contraction of 91.16%, indicating significant market pressure over the past twelve months. The token's market capitalization stands at approximately $236,620, with a circulating supply of 66,169,002 tokens representing 66.17% of the total supply of 99,997,764 tokens. The fully diluted market cap is calculated at $357,592.
The trading volume over the past 24 hours reached $19,537.98, suggesting moderate market activity. XTAG maintains a market dominance of 0.000014%, positioning it as a micro-cap cryptocurrency. The token is held by approximately 3,322 addresses, indicating a relatively small but established holder base.
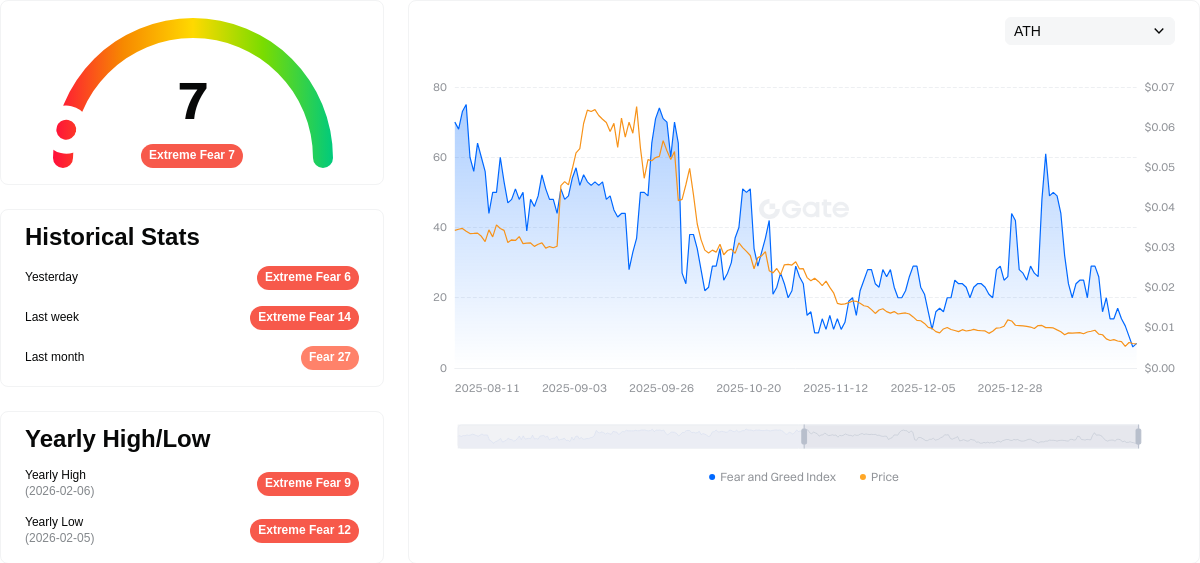
Current market sentiment analysis shows an index reading of 7, corresponding to extreme fear conditions in the broader cryptocurrency market, which may be influencing XTAG's price performance alongside project-specific factors.
Click to view current XTAG market price
XTAG Market Sentiment Index
02-08-2026 Fear and Greed Index: 7 (Extreme Fear)
Click to view current Fear & Greed Index
The cryptocurrency market is currently experiencing extreme fear, with the Fear and Greed Index hitting just 7 points. This indicates widespread investor panic and significant market pessimism. During such periods, risk appetite diminishes sharply as traders adopt highly cautious positions. Extreme fear conditions often present contrarian opportunities for long-term investors, as assets may become oversold. However, caution remains essential as downward momentum can persist. Monitor market developments closely and consider your risk tolerance before making investment decisions.
XTAG Holding Distribution
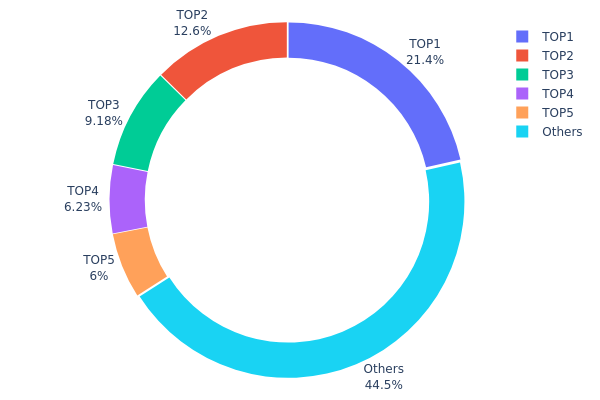
The holding distribution chart reveals the allocation of XTAG tokens across different wallet addresses, serving as a crucial indicator of decentralization and market structure. By analyzing the percentage of tokens held by top addresses versus smaller holders, investors can assess concentration risk and potential market manipulation vulnerabilities. A more balanced distribution typically indicates healthier market dynamics, while extreme concentration may signal heightened volatility and centralized control risks.
According to current on-chain data, XTAG exhibits moderate concentration characteristics. The top holder controls 21.44% of total supply (21.44M tokens), while the top five addresses collectively hold approximately 55.47% of circulating tokens. The remaining 44.53% is distributed among other addresses, suggesting a relatively concentrated ownership structure. This level of concentration falls within a moderate range—not excessively centralized compared to some emerging tokens, yet significantly concentrated enough to warrant attention regarding potential price manipulation risks.
This distribution pattern presents both opportunities and challenges for market participants. On one hand, the presence of major holders may provide price stability and liquidity support during market fluctuations. On the other hand, concentrated holdings increase the risk of sudden large-scale sell-offs, which could trigger significant price volatility. From a decentralization perspective, while XTAG has not achieved optimal token dispersion, the 44.53% held by numerous smaller addresses demonstrates meaningful community participation. Investors should closely monitor changes in top holder positions, as any significant transfer or selling activity from these addresses could materially impact market dynamics and price stability.
Click to view current XTAG Holding Distribution
| Top |
Address |
Holding Qty |
Holding (%) |
| 1 |
4wvovA...irTqQW |
21440.04K |
21.44% |
| 2 |
5fkqZ8...nwbFZu |
12632.36K |
12.63% |
| 3 |
AWHN7X...JySjKp |
9178.08K |
9.17% |
| 4 |
DfNV3N...A5ddoA |
6232.87K |
6.23% |
| 5 |
AGVhmr...gHAk8N |
6000.00K |
6.00% |
| - |
Others |
44514.41K |
44.53% |
Supply Mechanism
- Market Demand and Technological Progress: XTAG's supply dynamics are closely tied to market demand patterns and ongoing technological advancements. The evolution of molecular diagnostic technologies and their commercialization directly affects supply availability in clinical settings.
- Historical Patterns: High costs associated with advanced diagnostic methods have historically limited widespread clinical adoption, creating supply constraints that influence pricing structures. Purchase prices have demonstrated relative stability following initial business cooperation fee adjustments.
- Current Impact: The competitive landscape between established molecular diagnostic platforms and emerging technologies continues to shape supply expectations. Cost optimization efforts and regulatory developments may gradually improve accessibility.
Institutional and Major Holder Dynamics
- Market Expansion: XTAG's positioning is influenced by strategic partnerships and collaborative arrangements within the molecular diagnostics sector. Business cooperation frameworks play a role in shaping institutional engagement.
- Competitive Environment: The technology operates within a competitive field where established platforms and emerging solutions contend for market share. Performance differentiation and cost-effectiveness remain key considerations for institutional adoption.
Macroeconomic Environment
- Economic Outlook: Looking toward 2026, macroeconomic trends and liquidity conditions remain central to digital asset performance. Economic growth is expected to maintain moderate levels, though inflation may exhibit persistent characteristics.
- Regional Variations: Different regions may experience varying economic trajectories, with some areas potentially demonstrating stronger growth dynamics than others.
- Market Sentiment: Broader market conditions and investor sentiment toward innovation in diagnostic technologies can influence valuation expectations.
Technological Development and Ecosystem Building
- Diagnostic Innovation: Advances in molecular diagnostic methodologies, including rapid nucleic acid detection capabilities, represent key technological developments. These innovations aim to balance performance requirements with practical clinical application.
- Clinical Application: The expansion of diagnostic applications and integration into clinical workflows forms an important aspect of ecosystem development. Practical implementation considerations, including cost-benefit analyses, influence adoption trajectories.
- Regulatory Framework: Evolving regulatory standards and approval processes shape the technological development pathway and market accessibility for diagnostic solutions.
III. 2026-2031 XTAG Price Predictions
2026 Outlook
- Conservative forecast: $0.002 - $0.00358
- Neutral forecast: $0.00358 (average market conditions)
- Optimistic forecast: $0.00468 (requires favorable market sentiment and increased adoption)
2027-2029 Outlook
- Market phase expectation: XTAG may enter a gradual growth phase as the project matures and expands its ecosystem partnerships. The predicted price increase of 15% in 2027, 27% in 2028, and 39% in 2029 suggests steady upward momentum driven by continued development and community engagement.
- Price range predictions:
- 2027: $0.0038 - $0.005
- 2028: $0.00379 - $0.00539
- 2029: $0.00358 - $0.00677
- Key catalysts: Technology upgrades, strategic partnerships, growing user base, and broader market recovery could serve as primary drivers for price appreciation during this period.
2030-2031 Long-term Outlook
- Baseline scenario: $0.00299 - $0.00646 (assuming moderate market conditions and consistent project execution)
- Optimistic scenario: $0.00567 - $0.00727 (contingent on successful ecosystem expansion and favorable regulatory environment)
- Transformative scenario: Potential to reach the upper range of $0.00727 by 2031 (requires exceptional adoption rates, major technological breakthroughs, and sustained bull market conditions, representing a 72% increase from 2026 baseline)
- 2026-02-08: XTAG trading within the predicted range of $0.002 - $0.00468 (early stage of the forecast period)
| Year |
Predicted High Price |
Predicted Average Price |
Predicted Low Price |
Price Change |
| 2026 |
0.00468 |
0.00358 |
0.002 |
0 |
| 2027 |
0.005 |
0.00413 |
0.0038 |
15 |
| 2028 |
0.00539 |
0.00456 |
0.00379 |
27 |
| 2029 |
0.00677 |
0.00497 |
0.00358 |
39 |
| 2030 |
0.00646 |
0.00587 |
0.00299 |
64 |
| 2031 |
0.00727 |
0.00616 |
0.00567 |
72 |
IV. XTAG Professional Investment Strategies and Risk Management
XTAG Investment Methodology
(1) Long-term Holding Strategy
- Target Investors: Investors who believe in the development potential of decentralized AI agents and Bitcoin Layer 2 ecosystem
- Operational Recommendations:
- Consider accumulating XTAG gradually during market corrections to build positions at favorable average prices
- Monitor project development milestones, including AI agent deployment updates and Bitcoin Layer 2 infrastructure progress
- Utilize Gate Web3 Wallet for secure storage of XTAG tokens, ensuring full control of private keys
(2) Active Trading Strategy
- Technical Analysis Tools:
- Moving Averages: Use 7-day and 30-day moving averages to identify short-term trend reversals, noting the recent 17.36% decline over 7 days and 25.79% decline over 30 days
- Volume Analysis: Monitor the 24-hour trading volume of approximately $19,537.98 to gauge market interest and liquidity levels
- Swing Trading Key Points:
- Consider the current 24-hour price range between $0.00344 and $0.003818 as potential support and resistance levels
- Be aware of the significant volatility, with a 91.16% decline over the past year, which may present both opportunities and risks
XTAG Risk Management Framework
(1) Asset Allocation Principles
- Conservative Investors: 1-2% of cryptocurrency portfolio
- Aggressive Investors: 3-5% of cryptocurrency portfolio
- Professional Investors: Up to 8% of cryptocurrency portfolio, with active position management
(2) Risk Hedging Solutions
- Position Sizing: Never allocate more than a small percentage of total capital to a single low-cap asset like XTAG (market dominance: 0.000014%)
- Stop-Loss Orders: Consider setting stop-loss levels to protect against further downside, particularly given the recent price weakness
(3) Secure Storage Solutions
- Non-Custodial Wallet Recommendation: Gate Web3 Wallet for self-custody of XTAG tokens with full private key control
- Multi-Signature Setup: For larger holdings, consider multi-signature wallet configurations to enhance security
- Security Considerations: Never share private keys or seed phrases; be cautious of phishing attempts; regularly update wallet software; store backup recovery phrases in secure offline locations
V. XTAG Potential Risks and Challenges
XTAG Market Risks
- High Volatility: XTAG has experienced a 91.16% decline over the past year, demonstrating significant price volatility that may continue
- Low Liquidity: With a 24-hour trading volume of approximately $19,537.98 and a market cap of around $236,620, XTAG has relatively low liquidity, which may result in increased price slippage during trades
- Limited Exchange Availability: Currently available on only 1 exchange, which may restrict trading options and market depth
XTAG Regulatory Risks
- AI Agent Regulation: As governments worldwide develop frameworks for artificial intelligence, AI-focused blockchain projects may face evolving compliance requirements
- Bitcoin Layer 2 Regulatory Uncertainty: The regulatory status of Bitcoin Layer 2 solutions remains unclear in many jurisdictions, potentially impacting project development
- Token Classification: Uncertainty around whether XTAG may be classified as a security in certain jurisdictions could affect its trading and distribution
XTAG Technical Risks
- Smart Contract Vulnerabilities: XTAG operates on Solana (contract address: 5gs8nf4wojB5EXgDUWNLwXpknzgV2YWDhveAeBZpVLbp), and any smart contract bugs could potentially affect token functionality
- Bitcoin Layer 2 Integration Challenges: Technical difficulties in implementing and maintaining Bitcoin Layer 2 infrastructure could impact the project's core value proposition
- Network Dependencies: Reliance on both Solana network performance and Bitcoin network security may expose XTAG to technical issues across multiple blockchains
VI. Conclusion and Action Recommendations
XTAG Investment Value Assessment
XTAG presents an interesting proposition at the intersection of AI agents and Bitcoin Layer 2 technology, with a mission to democratize personalized AI experiences. However, investors should carefully weigh the project's innovative approach against significant market challenges, including a 91.16% annual decline, low liquidity with a market cap of approximately $236,620, and limited exchange availability. The circulating supply represents 66.17% of the fully diluted valuation, indicating moderate token distribution. While the project's focus on decentralized AI agents and Bitcoin ownership through inscriptions is conceptually compelling, the substantial price decline and minimal market presence warrant caution. Long-term value depends heavily on successful execution of the Bitcoin Layer 2 infrastructure and meaningful adoption of AI agent deployment capabilities.
XTAG Investment Recommendations
✅ Beginners: Avoid XTAG until gaining more experience with established cryptocurrencies; the low liquidity and high volatility make it unsuitable for those new to crypto investing
✅ Experienced Investors: Only consider small speculative positions (1-2% of portfolio) if you have strong conviction in the AI agent narrative and can tolerate potential further downside; closely monitor project development updates
✅ Institutional Investors: Conduct thorough due diligence on the project's technology, team, and roadmap; consider the limited liquidity and exchange availability before any allocation decisions
XTAG Trading Participation Methods
- Spot Trading: Purchase XTAG directly through Gate.com using cryptocurrency pairs, with current price at approximately $0.003576
- Secure Storage: After purchasing, transfer XTAG to Gate Web3 Wallet for self-custody and enhanced security
- Dollar-Cost Averaging: For long-term believers, consider small regular purchases to average out price volatility, though be mindful of the ongoing downtrend
Cryptocurrency investment carries extreme risk. This article does not constitute investment advice. Investors should make prudent decisions based on their own risk tolerance and are advised to consult professional financial advisors. Never invest more than you can afford to lose.
FAQ
What is the current price of XTAG token? How is its historical price trend?
XTAG token is currently trading at $4.52, which matches its all-time high. The token has maintained this peak level, demonstrating strong market performance and investor confidence in the project.
What are the main factors affecting XTAG price?
XTAG price is primarily influenced by market sentiment, regulatory policies, and technological innovation. Market demand and supply dynamics, along with global economic trends, also play significant roles in price fluctuations.
XTAG's future price is projected between $0.006521 and $0.007586 in neutral scenarios. Optimistic predictions suggest it could reach up to $0.015105 by 2030. Current price is around $0.004994.
What advantages and disadvantages does XTAG have compared to other similar tokens?
XTAG excels in multi-target detection speed and efficiency, but carries higher operational costs. It outperforms simpler alternatives in throughput and precision while requiring greater technical complexity and capital investment compared to competing solutions.
How is the liquidity and trading volume of XTAG? Which exchanges can trade it?
XTAG has moderate liquidity with trading volume around $21k-$95k daily. It is available on multiple centralized and decentralized exchanges, providing adequate market access for traders interested in the token.
What risks should I be aware of when investing in XTAG?
XTAG investment faces market volatility and regulatory risks. Price fluctuations are influenced by market conditions, policy changes, and technological developments. Assess your risk tolerance carefully before investing.
* The information is not intended to be and does not constitute financial advice or any other recommendation of any sort offered or endorsed by Gate.