BOT vs ETH: Which Cryptocurrency Offers Better Investment Potential in 2024?
Introduction: Investment Comparison Between BOT and ETH
In the cryptocurrency market, the comparison between BOT and ETH remains a topic of ongoing interest for investors. These two assets differ significantly in market capitalization ranking, application scenarios, and price performance, representing distinct positioning within the crypto ecosystem. BOT (Hyperbot): Launched in 2025, this AI-driven on-chain contract trading terminal has gained recognition for its focus on intelligent copy trading and smart money tracking capabilities. ETH (Ethereum): Since its inception in 2014, Ethereum has been recognized as a foundational smart contract platform and is one of the cryptocurrencies with substantial global trading volume and market capitalization. This article will provide a comprehensive analysis of the investment value comparison between BOT and ETH, examining historical price trends, supply mechanisms, institutional adoption, technical ecosystems, and future projections, while addressing the question many investors consider:
"Which is the better buy right now?"
I. Historical Price Comparison and Current Market Status
BOT (Hyperbot) and ETH (Ethereum) Historical Price Trends
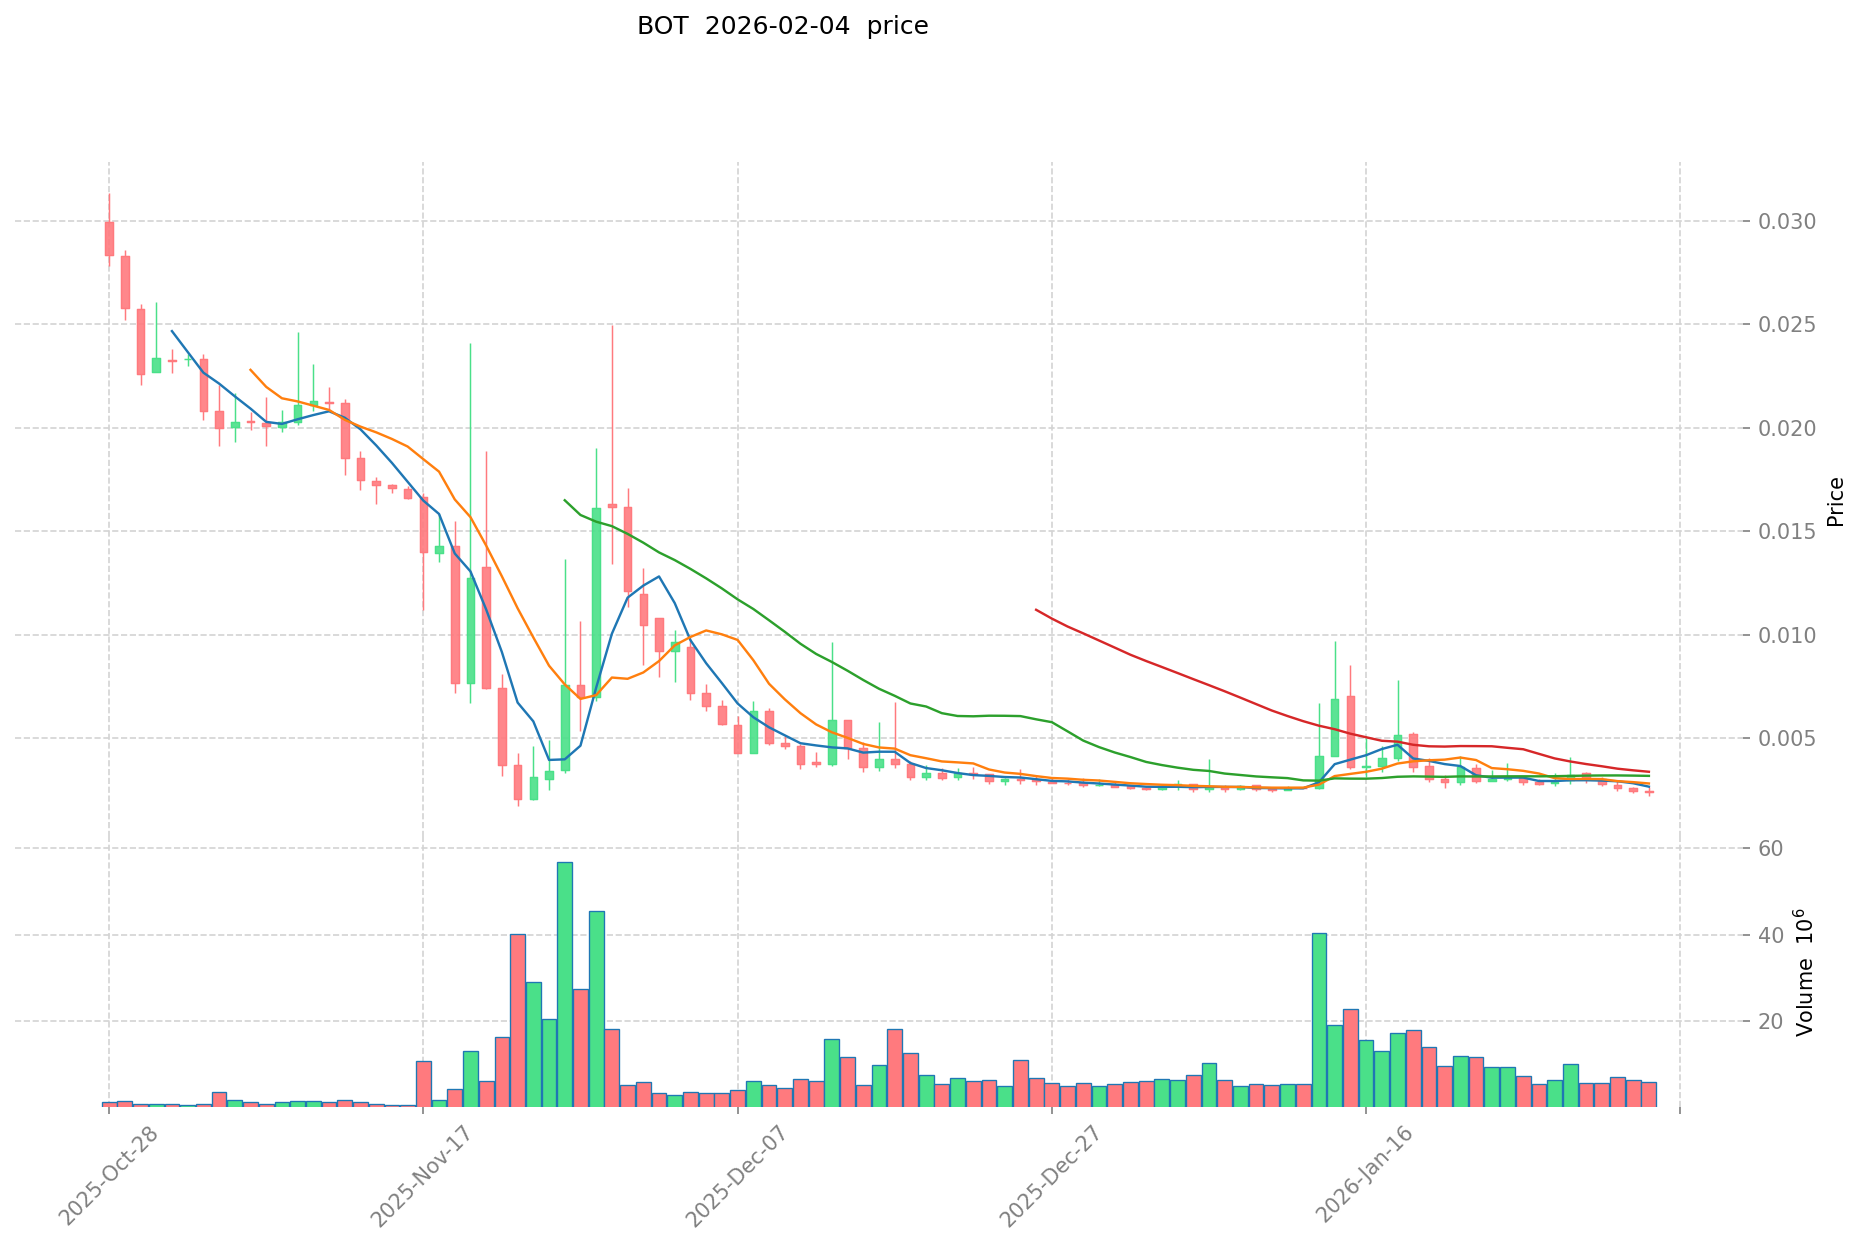
- 2025: BOT experienced notable volatility following its launch in September 2025, reaching an all-time high of $0.18925 on September 24, 2025. The token subsequently declined, reflecting early-stage market adjustment patterns.
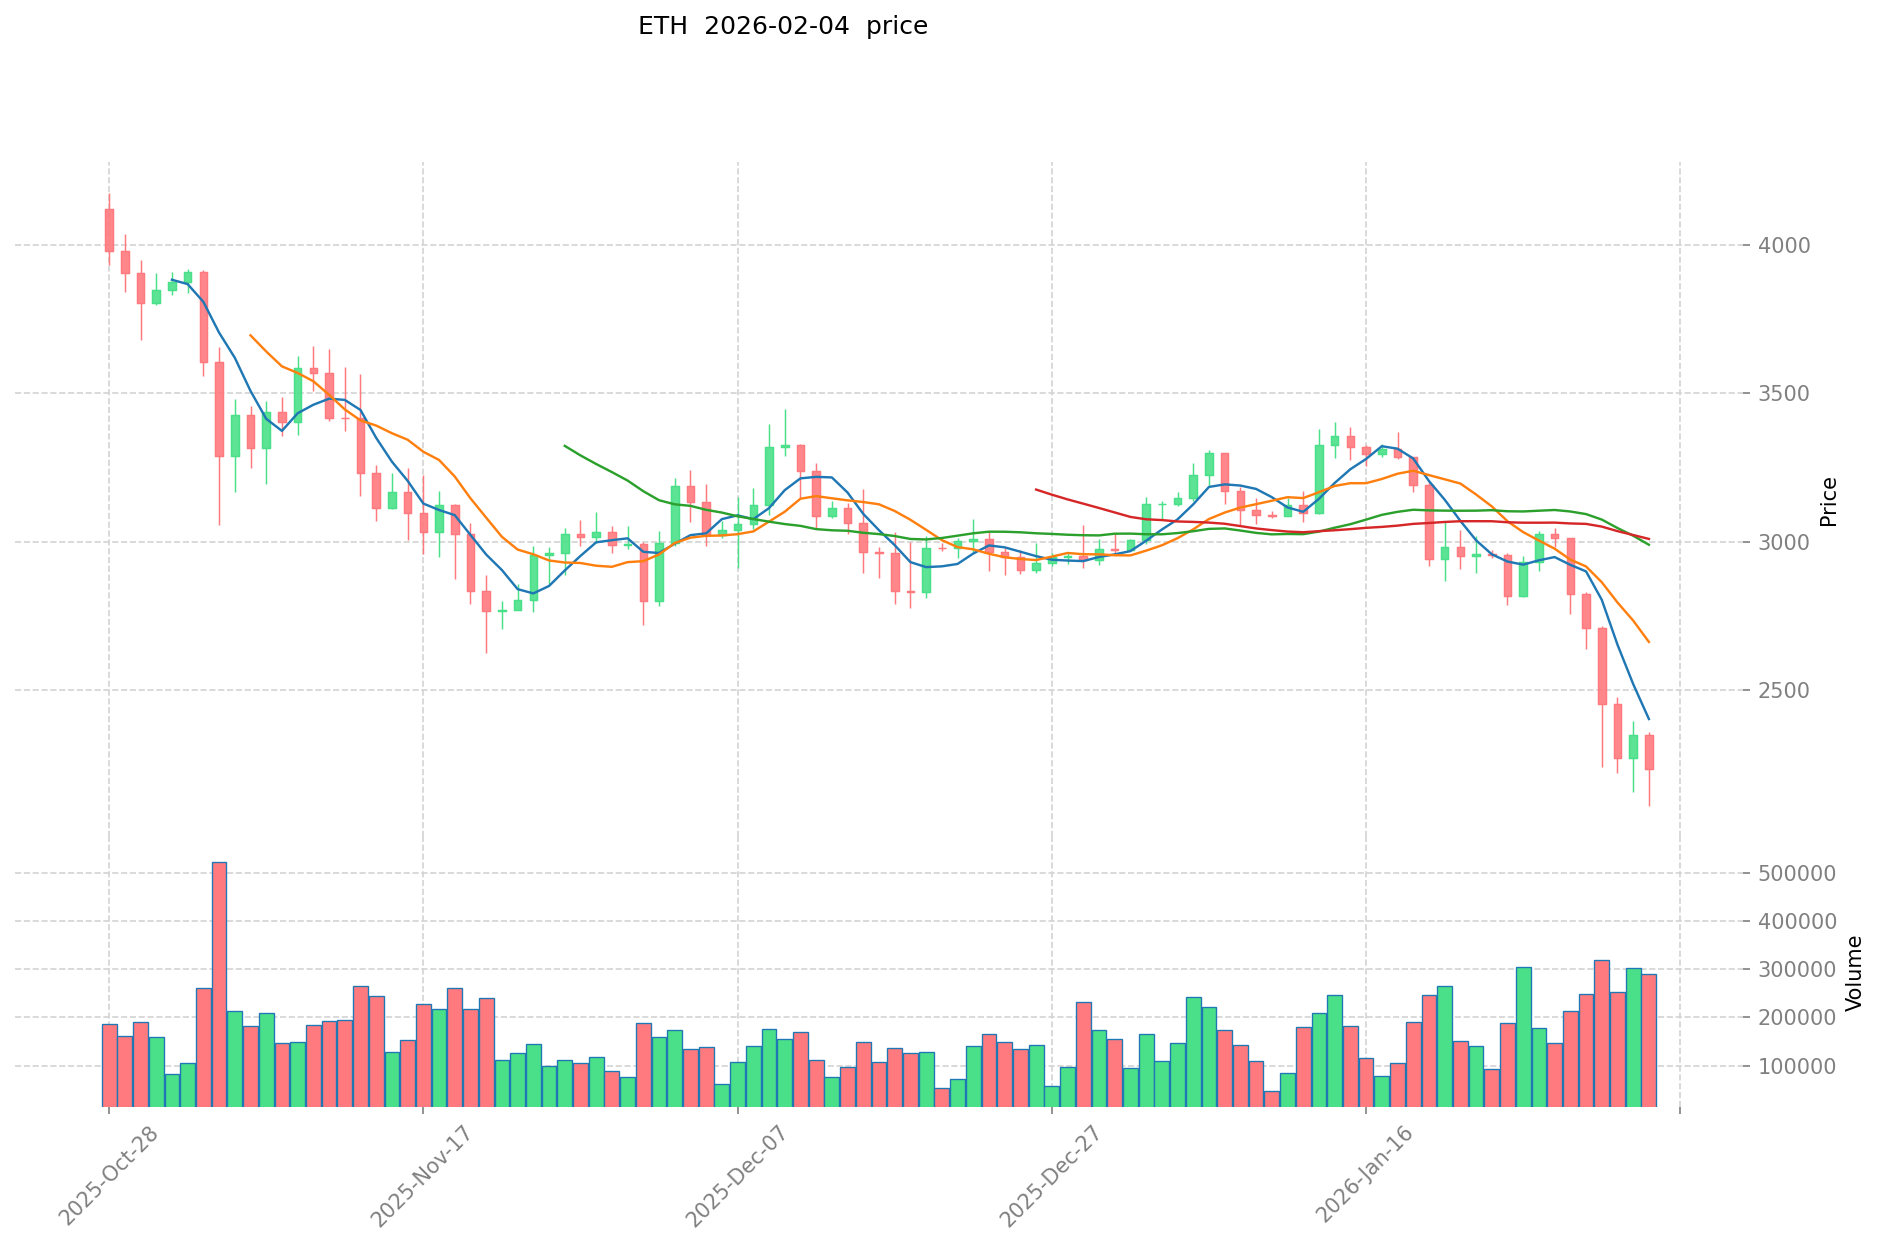
- 2025: ETH recorded its peak at $4,946.05 on August 25, 2025, driven by sustained network activity and institutional adoption. The asset later experienced downward pressure amid broader market conditions.
- Comparative Analysis: During the recent market cycle, BOT declined from its peak of $0.18925 to a low of $0.001714 recorded on November 23, 2025, representing a contraction of over 99%. In contrast, ETH retreated from $4,946.05 to current levels around $2,283.40, showing a more moderate adjustment of approximately 54% from its high.
Current Market Status (February 4, 2026)
- BOT Current Price: $0.002287
- ETH Current Price: $2,283.40
- 24-Hour Trading Volume: BOT recorded $14,582.20 compared to ETH's $631,388,351.05
- Market Sentiment Index (Fear & Greed Index): 14 (Extreme Fear)
View real-time prices:
- Check BOT current price Market Price
- Check ETH current price Market Price
II. Core Factors Influencing BOT vs ETH Investment Value
Supply Mechanism Comparison (Tokenomics)
- BOT: Operates with an AI-driven innovative infrastructure model focused on emerging DeFi tools and smart fund tracking, though specific supply mechanism details are not extensively documented in available materials.
- ETH: Implements a flexible supply model where each on-chain transaction burns a portion of ETH through EIP-1559. This mechanism creates dynamic supply adjustments based on network activity.
- 📌 Historical Pattern: Ethereum's transition to Proof of Stake (PoS) consensus mechanism has altered its supply dynamics, allowing ETH holders to earn passive income through staking while reducing energy consumption.
Institutional Adoption and Market Application
- Institutional Holdings: ETH has demonstrated appeal to institutional participants through its established position as a widely-traded digital asset and its transition to PoS, which enables staking rewards for holders.
- Enterprise Adoption: ETH serves multiple functions including payment of network transaction fees (Gas), execution of smart contracts, and support for decentralized applications. BOT positions itself within AI-driven trading infrastructure and DeFi tool deployment.
- Regulatory Environment: ETH's value responds to various regulatory factors including economic policy shifts, interest rate changes, and evolving frameworks across different jurisdictions.
Technology Development and Ecosystem Building
- BOT Technology Development: Focuses on AI-driven innovation in trading infrastructure with emphasis on accessible DeFi tools and intelligent fund tracking capabilities.
- ETH Technology Evolution: Protocol upgrades such as The Merge and EIP-1559 have transformed supply mechanisms and consensus models. The shift from Proof of Work to Proof of Stake significantly reduced energy consumption while enhancing network scalability and shard chain support.
- Ecosystem Comparison: Ethereum maintains an established presence across DeFi applications, smart contract execution, and decentralized application support. BOT targets emerging opportunities in AI-enhanced trading and DeFi infrastructure.
Macroeconomic Factors and Market Cycles
- Performance Under Economic Conditions: ETH's value reflects interactions with global financial markets, with price movements influenced by broader economic policy shifts and macroeconomic adjustments.
- Monetary Policy Impact: Interest rate changes and dovish policy adjustments can affect market sentiment and capital flows into digital assets. ETH has shown responsiveness to stable spot and ETF inflows alongside supportive macro adjustments.
- Market Position Dynamics: ETH's market standing is shaped by competition from alternative blockchain platforms and evolving technological landscapes, while maintaining its role as a fundamental token within the Ethereum ecosystem.
III. 2026-2031 Price Forecast: BOT vs ETH
Short-term Forecast (2026)
- BOT: Conservative $0.00119 - $0.00225 | Optimistic $0.00225 - $0.00254
- ETH: Conservative $2,026 - $2,276 | Optimistic $2,276 - $2,845
Mid-term Forecast (2028-2029)
- BOT may enter a consolidation phase, with estimated price range of $0.0015 - $0.0030
- ETH may enter an expansion phase, with estimated price range of $1,881 - $3,301
- Key drivers: institutional capital inflows, ETF developments, ecosystem growth
Long-term Forecast (2031)
- BOT: Base scenario $0.0030 - $0.0038 | Optimistic scenario $0.0030 - $0.0038
- ETH: Base scenario $2,994 - $3,403 | Optimistic scenario $3,403 - $4,083
Disclaimer
BOT:
| Year | Predicted High Price | Predicted Average Price | Predicted Low Price | Price Change |
|---|---|---|---|---|
| 2026 | 0.00254363 | 0.002251 | 0.00119303 | -1 |
| 2027 | 0.0029726706 | 0.002397315 | 0.001917852 | 4 |
| 2028 | 0.003007191936 | 0.0026849928 | 0.001530445896 | 17 |
| 2029 | 0.00293147513904 | 0.002846092368 | 0.00176457726816 | 24 |
| 2030 | 0.003206549966407 | 0.00288878375352 | 0.001531055389365 | 26 |
| 2031 | 0.003779106906354 | 0.003047666859963 | 0.002956236854164 | 33 |
ETH:
| Year | Predicted High Price | Predicted Average Price | Predicted Low Price | Price Change |
|---|---|---|---|---|
| 2026 | 2845.1625 | 2276.13 | 2025.7557 | 0 |
| 2027 | 2970.34965 | 2560.64625 | 2381.4010125 | 12 |
| 2028 | 3235.6326015 | 2765.49795 | 1880.538606 | 21 |
| 2029 | 3300.621803325 | 3000.56527575 | 2310.4352623275 | 31 |
| 2030 | 3654.6885058635 | 3150.5935395375 | 2268.427348467 | 38 |
| 2031 | 4083.1692272406 | 3402.6410227005 | 2994.32409997644 | 49 |
IV. Investment Strategy Comparison: BOT vs ETH
Long-term vs Short-term Investment Strategies
- BOT: May appeal to investors focused on emerging AI-driven trading infrastructure and early-stage DeFi innovation opportunities. The asset's current positioning suggests alignment with higher-risk tolerance profiles seeking exposure to developing technology segments.
- ETH: May suit investors prioritizing established network effects, institutional adoption patterns, and proven smart contract platform utility. The asset's maturity and ecosystem development suggest alignment with both growth-oriented and stability-seeking investment approaches.
Risk Management and Asset Allocation
- Conservative Investors: Consideration might involve allocating a higher proportion to established assets with demonstrated market presence and lower volatility characteristics. A sample framework could include ETH: 80-90% vs BOT: 10-20% of crypto portfolio allocation.
- Aggressive Investors: Those with higher risk tolerance might explore balanced or reversed allocations to capture potential emerging opportunities. A sample framework could include ETH: 40-50% vs BOT: 50-60% of crypto portfolio allocation.
- Hedging Tools: Portfolio management approaches may incorporate stablecoin positions for liquidity management, options strategies for downside protection, and cross-asset diversification across multiple cryptocurrencies.
V. Potential Risk Comparison
Market Risk
- BOT: The asset has demonstrated significant price volatility, with a decline exceeding 99% from its peak in 2025. Limited trading volume of $14,582.20 compared to established assets suggests lower liquidity conditions. Early-stage market positioning may result in heightened sensitivity to market sentiment shifts.
- ETH: Price movements reflect broader cryptocurrency market cycles and macroeconomic conditions. The asset experienced a decline of approximately 54% from its peak, showing moderate volatility relative to emerging tokens. Market dynamics are influenced by institutional flows, regulatory developments, and competition from alternative blockchain platforms.
Technology Risk
- BOT: As an emerging AI-driven trading infrastructure, the project's long-term technical development trajectory and network stability remain in early evaluation stages. Limited historical operational data may present uncertainties regarding scalability and sustained platform performance.
- ETH: Network scalability improvements through protocol upgrades have addressed previous congestion concerns. The transition to Proof of Stake consensus has reduced energy consumption while maintaining network security. Ongoing development focuses on shard chain implementation and layer-2 scaling solutions.
Regulatory Risk
- Global regulatory frameworks continue to evolve, with varying approaches across jurisdictions affecting both assets differently. ETH's established market presence may attract greater regulatory scrutiny regarding securities classification and compliance requirements. BOT's emerging status may face evolving DeFi and AI-related regulatory considerations. Policy shifts regarding staking mechanisms, transaction reporting, and cross-border transfers may impact both assets' operational environments.
VI. Conclusion: Which Is the Better Buy?
📌 Investment Value Summary
- BOT Characteristics: Represents exposure to AI-driven trading infrastructure innovation and emerging DeFi tool development. The asset's early-stage positioning offers potential participation in developing technology segments, accompanied by heightened volatility and execution uncertainty.
- ETH Characteristics: Maintains established positioning as a foundational smart contract platform with demonstrated institutional adoption and ecosystem maturity. The asset provides exposure to DeFi infrastructure, transaction utility within the Ethereum network, and potential staking rewards through Proof of Stake consensus.
✅ Investment Considerations
- Beginner Investors: May benefit from focusing initial allocations toward established assets with proven track records and extensive educational resources. Gradual portfolio diversification with thorough research into risk factors and market dynamics can support informed decision-making.
- Experienced Investors: Portfolio construction might incorporate both established platforms and emerging opportunities based on individual risk tolerance and investment timeframes. Regular monitoring of technology developments, ecosystem growth, and macroeconomic conditions can inform allocation adjustments.
- Institutional Investors: Due diligence processes may evaluate regulatory compliance frameworks, liquidity depth, custody solutions, and alignment with investment mandates. Allocation decisions often reflect long-term strategic positioning within digital asset portfolios.
⚠️ Risk Disclosure: Cryptocurrency markets exhibit significant volatility and inherent risks. This content does not constitute investment advice, financial recommendations, or professional guidance. Individuals should conduct independent research and consult qualified professionals before making investment decisions.
VII. FAQ
Q1: What are the main differences between BOT and ETH in terms of market maturity?
ETH represents a mature, established blockchain platform with over a decade of operational history, while BOT is an emerging AI-driven trading infrastructure launched in 2025. ETH maintains a current price of $2,283.40 with 24-hour trading volume of $631,388,351.05, demonstrating substantial market liquidity and institutional adoption. In contrast, BOT trades at $0.002287 with significantly lower trading volume of $14,582.20, reflecting its early-stage market positioning. ETH's ecosystem includes extensive DeFi applications, smart contract functionality, and proven network effects, whereas BOT focuses on innovative AI-enhanced trading tools and smart money tracking capabilities within the developing DeFi infrastructure segment.
Q2: How do the supply mechanisms of BOT and ETH differ?
ETH implements a flexible supply model through EIP-1559, which burns a portion of ETH with each on-chain transaction, creating dynamic supply adjustments based on network activity. Following Ethereum's transition to Proof of Stake consensus, ETH holders can earn passive income through staking while the network maintains reduced energy consumption. BOT operates with an AI-driven infrastructure model focused on emerging DeFi tools, though specific supply mechanism details remain less extensively documented. The fundamental distinction lies in ETH's established deflationary mechanism tied directly to network usage versus BOT's evolving tokenomics within its early-stage development phase.
Q3: What risk profiles do BOT and ETH present to investors?
BOT demonstrates higher volatility characteristics, having experienced a decline exceeding 99% from its September 2025 peak of $0.18925 to a low of $0.001714. Limited trading volume and early-stage market positioning contribute to heightened sensitivity to market sentiment shifts and liquidity constraints. ETH exhibits moderate volatility relative to emerging tokens, with approximately 54% decline from its peak of $4,946.05, reflecting responsiveness to broader cryptocurrency market cycles and macroeconomic conditions. ETH benefits from established institutional adoption, regulatory frameworks, and proven technology infrastructure, while BOT carries execution uncertainties inherent in emerging AI-driven platforms and developing DeFi tools.
Q4: How do the 2026-2031 price forecasts compare between BOT and ETH?
Short-term 2026 forecasts project BOT in a conservative range of $0.00119 - $0.00225 with optimistic scenarios reaching $0.00254, while ETH shows conservative estimates of $2,026 - $2,276 and optimistic projections of $2,276 - $2,845. By 2031, BOT's base scenario estimates $0.0030 - $0.0038, representing potential growth of 33% from current levels, whereas ETH's base scenario projects $2,994 - $3,403 with optimistic scenarios reaching $4,083, indicating potential growth of 49% from current levels. These forecasts reflect ETH's established market position and institutional capital inflows versus BOT's consolidation phase within emerging technology segments, though all cryptocurrency price predictions carry inherent uncertainty.
Q5: What allocation strategies might different investor profiles consider for BOT versus ETH?
Conservative investors might consider allocating 80-90% toward ETH and 10-20% toward BOT within their cryptocurrency portfolio, prioritizing established network effects and lower volatility characteristics. Aggressive investors with higher risk tolerance might explore more balanced allocations such as 40-50% ETH and 50-60% BOT to capture potential emerging opportunities in AI-driven trading infrastructure. Beginner investors may benefit from focusing initial allocations toward ETH's proven track record and extensive educational resources before gradually diversifying into higher-risk emerging assets. All allocation decisions should reflect individual risk tolerance, investment timeframes, and thorough research into market dynamics, technology developments, and regulatory considerations affecting both assets.
Q6: How do institutional adoption patterns differ between BOT and ETH?
ETH has demonstrated substantial institutional appeal through its established position as a widely-traded digital asset with proven utility across DeFi applications, smart contract execution, and decentralized application support. The transition to Proof of Stake consensus enables institutional participants to generate staking rewards while maintaining compliance frameworks and custody solutions. ETH's integration into spot ETFs and sustained institutional capital inflows reflect mature market infrastructure and regulatory clarity. BOT positions itself within emerging AI-driven trading infrastructure targeting early adopters and technology-focused participants, with institutional adoption patterns still developing alongside the platform's growth trajectory and regulatory framework evolution for AI-enhanced DeFi tools.
Q7: What technology development factors should investors monitor for BOT and ETH?
For ETH, key monitoring areas include protocol upgrades such as shard chain implementation, layer-2 scaling solution adoption, and ongoing improvements to network scalability and transaction throughput. The Proof of Stake consensus mechanism's performance, staking participation rates, and energy efficiency metrics provide insights into network health and institutional adoption trends. For BOT, investors should track AI-driven innovation developments in trading infrastructure, smart money tracking capability enhancements, and DeFi tool deployment progress. Platform stability, user adoption metrics, and integration with broader DeFi ecosystems represent critical indicators for evaluating BOT's long-term technical development trajectory and competitive positioning within emerging AI-enhanced trading segments.
Q8: How do macroeconomic factors impact BOT and ETH differently?
ETH's value responds to interactions with global financial markets, including interest rate changes, monetary policy adjustments, and broader economic conditions affecting institutional capital flows into digital assets. Stable spot and ETF inflows alongside supportive macro adjustments have historically influenced ETH's price movements, with regulatory developments across jurisdictions affecting operational environments. BOT, as an emerging asset, exhibits heightened sensitivity to market sentiment shifts and risk-on versus risk-off dynamics within cryptocurrency markets. Both assets face impact from evolving regulatory frameworks, though ETH's established market presence attracts greater scrutiny regarding securities classification and compliance requirements, while BOT navigates developing DeFi and AI-related regulatory considerations affecting early-stage technology platforms.
Share
Content
Introduction: Investment Comparison Between BOT and ETH
I. Historical Price Comparison and Current Market Status
II. Core Factors Influencing BOT vs ETH Investment Value
III. 2026-2031 Price Forecast: BOT vs ETH
IV. Investment Strategy Comparison: BOT vs ETH
V. Potential Risk Comparison
VI. Conclusion: Which Is the Better Buy?
VII. FAQ
How to Buy Cryptocurrency


Trending Cryptocurrencies


How to Mine Ethereum in 2025: A Complete Guide for Beginners

Ethereum 2.0 in 2025: Staking, Scalability, and Environmental Impact
What is Ethereum: A 2025 Guide for Crypto Enthusiasts and Investors

How does Ethereum's blockchain technology work?

What are smart contracts and how do they work on Ethereum?

Ethereum Price Analysis: 2025 Market Trends and Web3 Impact

How to Use Technical Indicators (MACD, RSI, KDJ) to Predict Crypto Price Movements in 2026
What is Euler (EUL) DeFi Super App: Whitepaper logic, use cases, and technical innovations explained

What are the main security risks and vulnerabilities affecting TRX and TRON smart contracts in 2026?

What is Worldcoin (WLD) and how does its iris biometric verification technology work for digital identity authentication?

How to Get Free NFTs: 5 Easy Ways