BOT vs LINK: Which Blockchain Oracle Solution Offers Better Performance and Reliability for Smart Contracts?
Introduction: Investment Comparison Between BOT and LINK
In the cryptocurrency market, the comparison between BOT vs LINK has become a topic of interest for investors. The two projects differ significantly in market cap ranking, application scenarios, and price performance, representing distinct positioning within the crypto asset landscape.
Hyperbot (BOT): Launched in 2025, this AI-driven on-chain contract trading terminal has gained recognition for its ability to aggregate multi-chain and multi-DEX data execution, helping users track smart money and on-chain whales while executing intelligent copy trading strategies.
ChainLink (LINK): Since its launch in 2017, LINK has been positioned as a decentralized oracle network, serving as an ERC20 token that facilitates data retrieval from off-chain sources and ensures blockchain-readable data formatting.
This article will comprehensively analyze the investment value comparison between BOT vs LINK through historical price trends, supply mechanisms, institutional adoption, technical ecosystems, and future forecasts, attempting to address the question most investors care about:
"Which is the better buy right now?"
I. Historical Price Comparison and Current Market Status
BOT (Coin A) and LINK (Coin B) Historical Price Trends
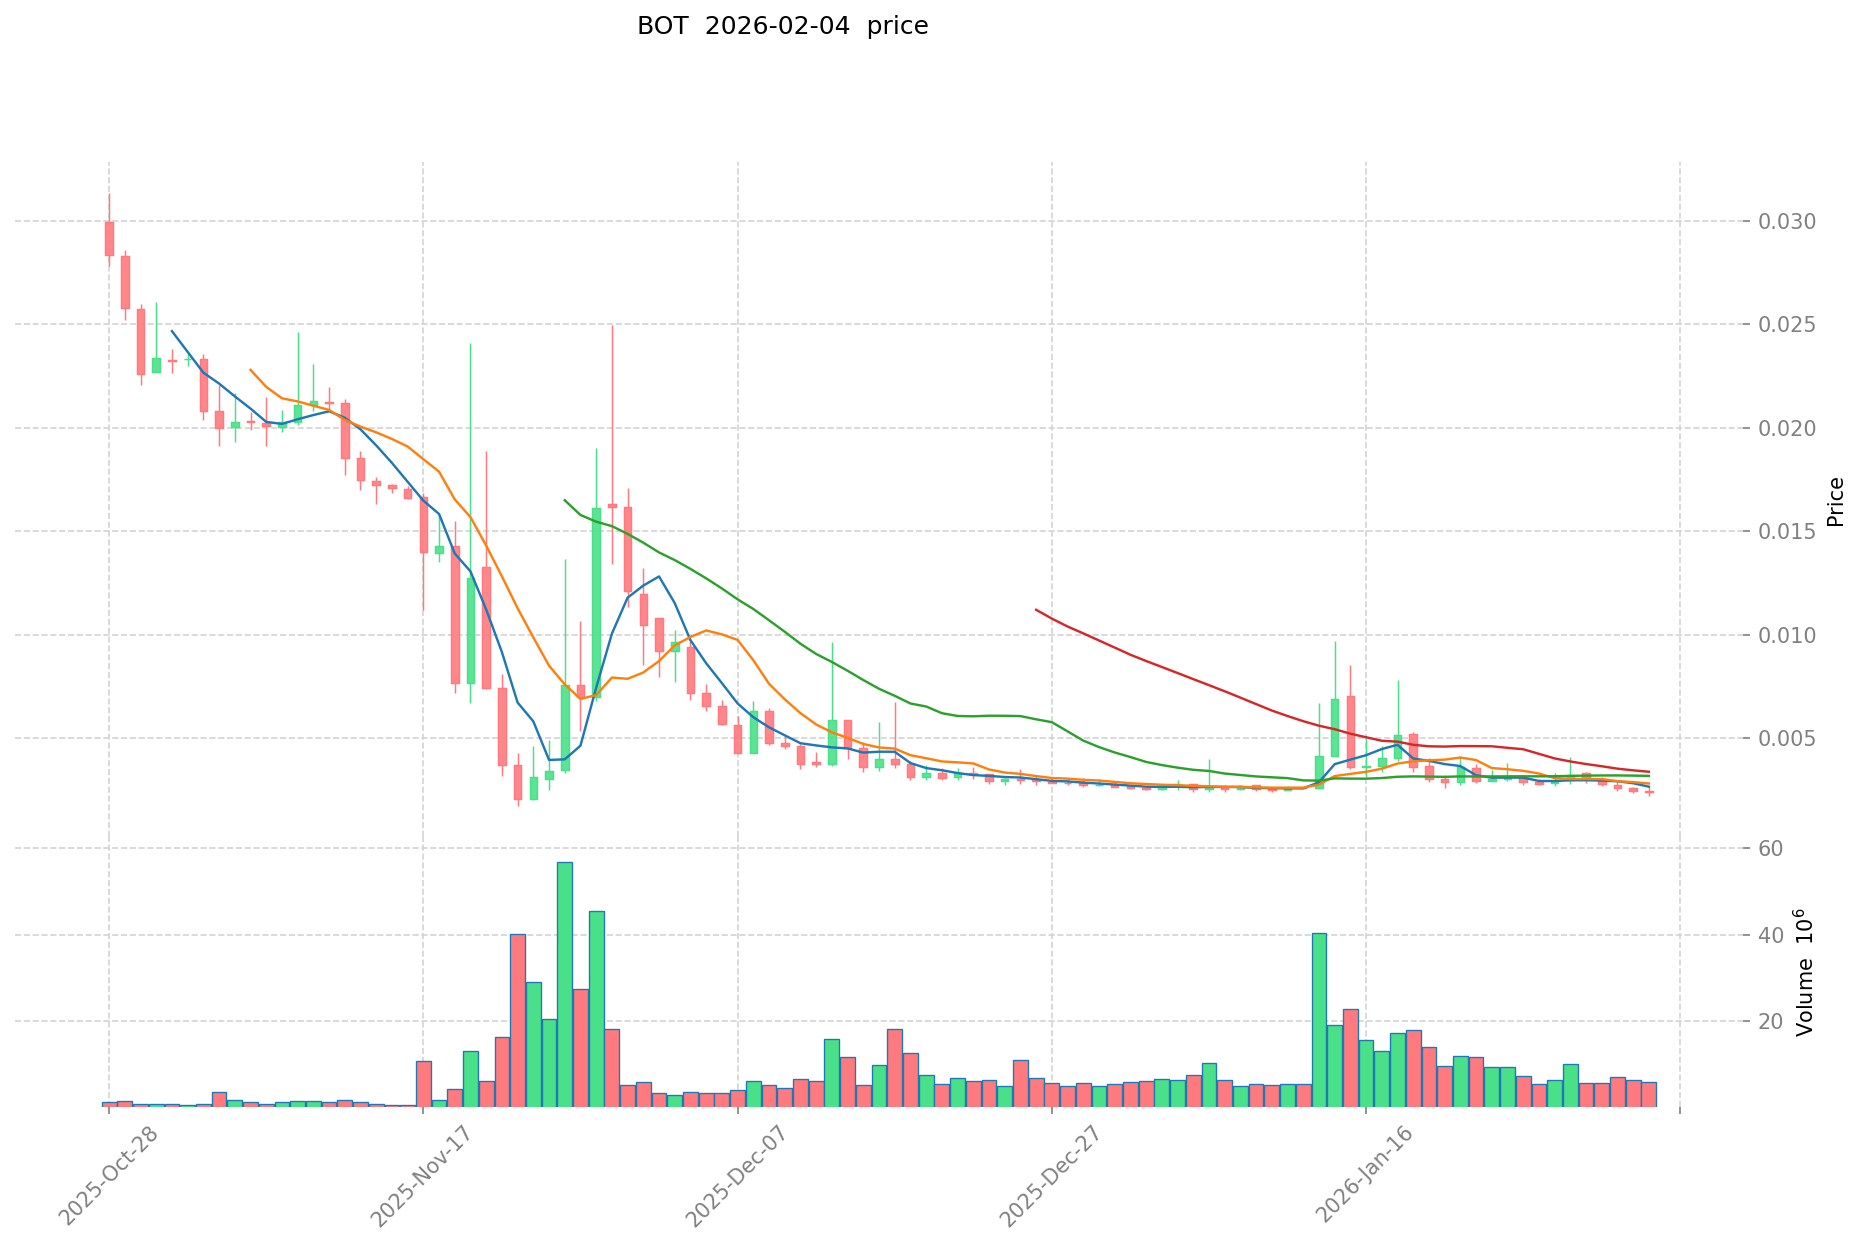
- 2025: BOT launched on the market in September 2025, reaching an all-time high of $0.18925 on September 24, 2025. Following this peak, the token experienced significant downward pressure.
- 2021: LINK reached its all-time high of $52.7 on May 10, 2021, during a period of widespread DeFi expansion. This milestone reflected strong institutional interest and ecosystem adoption.
- 2017-2019: LINK was launched in September 2017 and recorded its all-time low of $0.148183 on November 29, 2017. By May 2019, its mainnet went live, marking a turning point for oracle network adoption.
- Comparative Analysis: During recent market cycles, BOT declined from its high of $0.18925 to a low of $0.001714 recorded on November 23, 2025, representing a drop of approximately 99.09%. In contrast, LINK experienced a decline from its 2021 peak of $52.7 to its current trading range, demonstrating relatively more established price resilience over a longer period.
Current Market Situation (2026-02-04)
- BOT Current Price: $0.002384
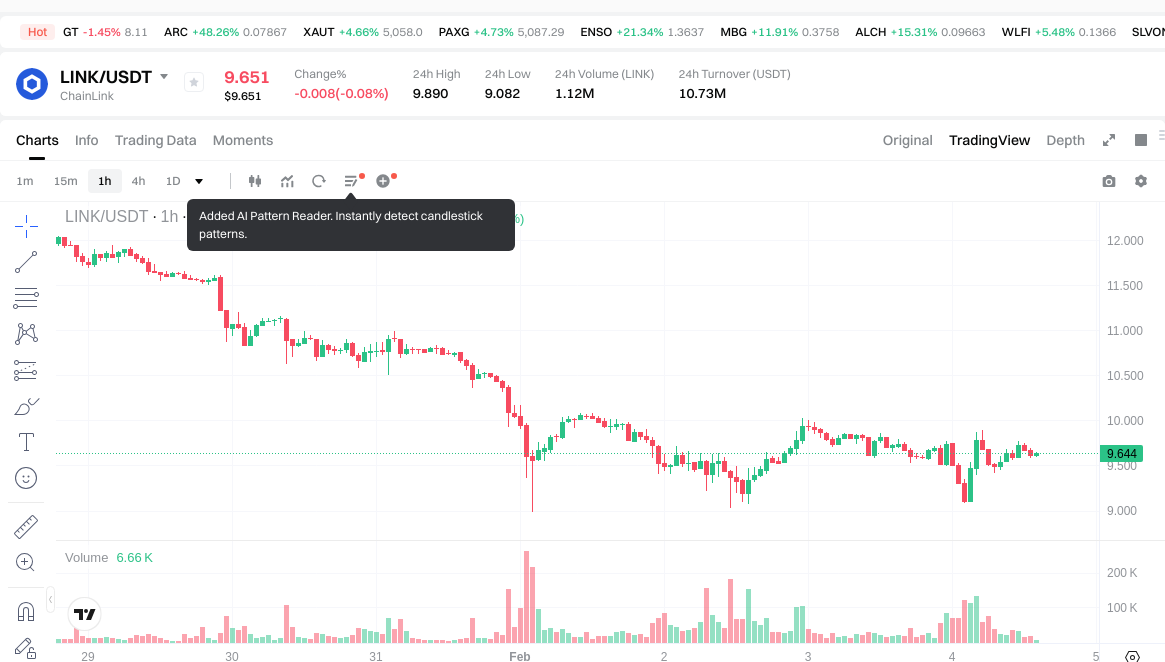
- LINK Current Price: $9.593
- 24-Hour Trading Volume: BOT recorded $14,033.18, while LINK generated $10,773,753.27
- Market Sentiment Index (Fear & Greed Index): 14 (Extreme Fear)
View real-time prices:
- Check BOT current price Market Price
- Check LINK current price Market Price
II. Core Factors Influencing BOT vs LINK Investment Value
Supply Mechanism Comparison (Tokenomics)
- BOT: Information regarding BOT's supply mechanism is not available in the provided materials.
- LINK: According to available data, LINK operates as the native token of the Chainlink decentralized oracle network. The token economics support network operations through staking and payment mechanisms for oracle services.
- 📌 Historical Pattern: Supply mechanisms can influence price cycles through controlling token circulation and incentive structures, though specific historical data for these assets requires further analysis.
Institutional Adoption and Market Application
- Institutional Holdings: Available materials indicate growing institutional interest in decentralized infrastructure projects, though specific comparative data between BOT and LINK institutional holdings is not provided.
- Enterprise Adoption: LINK has demonstrated adoption in decentralized finance (DeFi) ecosystems, serving as infrastructure for smart contracts to interact with real-world data. BOT's enterprise adoption details are not available in the reference materials.
- National Policies: Regulatory attitudes vary across jurisdictions, with increasing attention to oracle networks and blockchain infrastructure, though specific policy comparisons require additional research.
Technology Development and Ecosystem Building
- BOT Technology Upgrades: Specific technical upgrade information for BOT is not available in the provided materials.
- LINK Technology Development: LINK continues to develop its decentralized oracle network infrastructure, enabling smart contracts to access external data sources. The platform serves as foundational infrastructure for DeFi and Web3 applications.
- Ecosystem Comparison: LINK has established presence in DeFi applications, providing oracle services for smart contract execution. Comparative ecosystem data for BOT in DeFi, NFT, payment, and smart contract domains is not available in the reference materials.
Macroeconomic Factors and Market Cycles
- Performance in Inflationary Environments: Comparative analysis of inflation-hedging properties between BOT and LINK requires additional market data not provided in the materials.
- Macroeconomic Monetary Policy: Interest rates and dollar index movements can influence crypto asset valuations broadly, though specific sensitivity analysis for these assets is not available.
- Geopolitical Factors: Cross-border transaction demand and international developments may impact adoption of decentralized infrastructure, though specific effects on BOT and LINK require further examination.
III. 2026-2031 Price Prediction: BOT vs LINK
Short-term Prediction (2026)
- BOT: Conservative $0.00214 - $0.00240 | Optimistic $0.00240 - $0.00279
- LINK: Conservative $8.77 - $9.63 | Optimistic $9.63 - $10.69
Mid-term Prediction (2028-2029)
- BOT may enter a gradual growth phase, with estimated price range of $0.00286 - $0.00428 in 2028, potentially reaching $0.00294 - $0.00431 by 2029
- LINK may enter an expansion phase, with estimated price range of $8.68 - $18.22 in 2028, potentially reaching $14.24 - $19.14 by 2029
- Key drivers: institutional capital inflows, ETF developments, ecosystem expansion
Long-term Prediction (2030-2031)
- BOT: Baseline scenario $0.00361 - $0.00397 | Optimistic scenario $0.00423 - $0.00553
- LINK: Baseline scenario $11.24 - $17.22 | Optimistic scenario $16.19 - $21.56
Disclaimer
BOT:
| Year | Predicted High Price | Predicted Average Price | Predicted Low Price | Price Change |
|---|---|---|---|---|
| 2026 | 0.00278748 | 0.002403 | 0.00213867 | 0 |
| 2027 | 0.0033478596 | 0.00259524 | 0.0017128584 | 8 |
| 2028 | 0.004279031712 | 0.0029715498 | 0.002852687808 | 24 |
| 2029 | 0.00431409599964 | 0.003625290756 | 0.00293648551236 | 52 |
| 2030 | 0.005319389126278 | 0.00396969337782 | 0.003612420973816 | 66 |
| 2031 | 0.005527004089938 | 0.004644541252049 | 0.004226532539364 | 94 |
LINK:
| Year | Predicted High Price | Predicted Average Price | Predicted Low Price | Price Change |
|---|---|---|---|---|
| 2026 | 10.69152 | 9.632 | 8.76512 | 0 |
| 2027 | 14.6329344 | 10.16176 | 6.7067616 | 5 |
| 2028 | 18.224100384 | 12.3973472 | 8.67814304 | 29 |
| 2029 | 19.13840474 | 15.310723792 | 14.23897312656 | 59 |
| 2030 | 19.63600326324 | 17.224564266 | 16.19109041004 | 79 |
| 2031 | 21.5634320046054 | 18.43028376462 | 11.2424730964182 | 92 |
IV. Investment Strategy Comparison: BOT vs LINK
Long-term vs Short-term Investment Strategies
- BOT: May be suitable for investors with higher risk tolerance who are exploring emerging AI-driven trading tools and on-chain analytics infrastructure. Given the limited historical data and recent significant price volatility, this asset carries substantial uncertainty.
- LINK: May be suitable for investors seeking exposure to established blockchain infrastructure with demonstrated ecosystem adoption. The oracle network's role in DeFi applications provides a foundation for longer-term strategic positioning.
Risk Management and Asset Allocation
- Conservative Investors: Consider limiting exposure to highly volatile assets. A potential allocation framework might include LINK (5-10%) with minimal or no BOT allocation, supplemented by stablecoin holdings for capital preservation.
- Aggressive Investors: Those with higher risk appetite might consider LINK (15-25%) and BOT (3-5%) allocations, recognizing the elevated volatility profile of emerging assets.
- Hedging Tools: Diversification through stablecoin allocation, options strategies for downside protection, and cross-asset portfolio construction to manage correlation risks.
V. Potential Risk Comparison
Market Risks
- BOT: Exhibits extreme price volatility, with a decline of approximately 99.09% from its September 2025 peak to its November 2025 low. Limited trading volume ($14,033.18 as of February 4, 2026) suggests liquidity constraints that may amplify price movements.
- LINK: While demonstrating more established market presence, LINK remains subject to broader cryptocurrency market cycles and sentiment shifts. Current market conditions show an Extreme Fear index reading of 14, indicating heightened risk aversion across the sector.
Technical Risks
- BOT: Technical infrastructure details are not available in the reference materials, limiting assessment of scalability and network stability factors.
- LINK: As oracle network infrastructure, LINK faces technical considerations related to data accuracy, network coordination among node operators, and potential security vulnerabilities inherent in bridging on-chain and off-chain systems.
Regulatory Risks
- Global regulatory frameworks for cryptocurrency infrastructure continue to evolve, with varying approaches across jurisdictions. Oracle networks like LINK may face scrutiny related to data provision and financial market integration. Emerging projects like BOT may encounter regulatory uncertainty as authorities develop policies for AI-driven trading tools and on-chain analytics platforms.
VI. Conclusion: Which Is the Better Buy?
📌 Investment Value Summary:
- BOT Characteristics: Represents an emerging category in AI-driven on-chain trading infrastructure with limited historical performance data. The project launched in September 2025 and has experienced significant price decline from its initial peak.
- LINK Characteristics: Established presence as decentralized oracle infrastructure with demonstrated adoption in DeFi ecosystems. Longer operational history since 2017 provides more extensive performance data for analysis.
✅ Investment Considerations:
- Beginning Investors: Consider focusing on more established assets with greater liquidity and longer track records. If exploring this sector, prioritize comprehensive research and limit position sizes to capital that can be allocated to high-risk investments.
- Experienced Investors: May evaluate LINK as infrastructure exposure within diversified crypto portfolios, while approaching BOT with appropriate risk management given its emerging status and volatility profile. Consider dollar-cost averaging and disciplined position sizing.
- Institutional Investors: Infrastructure projects like LINK may align with strategic allocations to blockchain middleware and DeFi enabling technologies. Thorough due diligence on governance structures, tokenomics, and ecosystem adoption metrics remains essential.
⚠️ Risk Disclosure: The cryptocurrency market exhibits extreme volatility. This analysis does not constitute investment advice. Market participants should conduct independent research and consult qualified financial professionals before making investment decisions.
VII. FAQ
Q1: What are the main differences between BOT and LINK in terms of their core use cases?
BOT and LINK serve fundamentally different purposes in the blockchain ecosystem. BOT is an AI-driven on-chain contract trading terminal launched in 2025, designed to aggregate multi-chain and multi-DEX data for tracking smart money movements and executing intelligent copy trading strategies. LINK, operational since 2017, functions as a decentralized oracle network that enables smart contracts to access off-chain data sources and bridges real-world information with blockchain applications, serving as foundational infrastructure for DeFi protocols.
Q2: Why has BOT experienced such significant price volatility compared to LINK?
BOT has experienced extreme volatility due to its recent market entry and limited liquidity profile. Since launching in September 2025, BOT declined approximately 99.09% from its all-time high of $0.18925 to its November 2025 low of $0.001714, with current 24-hour trading volume of only $14,033.18. In contrast, LINK demonstrates more established price resilience with substantially higher liquidity ($10,773,753.27 in 24-hour volume) and a longer operational history spanning multiple market cycles since 2017, providing greater market depth and institutional participation.
Q3: Which asset is more suitable for conservative investors with limited risk tolerance?
LINK may be more appropriate for conservative investors seeking blockchain infrastructure exposure. The project offers an established operational track record since 2017, demonstrated adoption in DeFi ecosystems, and significantly higher trading liquidity compared to BOT. Conservative allocation frameworks might include LINK at 5-10% of crypto portfolio allocation, supplemented by stablecoin holdings for capital preservation. BOT carries substantially higher risk given its emerging status, extreme volatility profile, and limited liquidity, making it less suitable for risk-averse investment strategies.
Q4: How do the 2026-2031 price predictions compare between BOT and LINK?
Price predictions indicate divergent trajectories reflecting each asset's maturity level. For 2026, BOT projections range from $0.00214 (conservative) to $0.00279 (optimistic), while LINK estimates span $8.77 to $10.69. By 2031, BOT baseline scenarios project $0.00361-$0.00397 with optimistic scenarios reaching $0.00423-$0.00553, whereas LINK baseline forecasts indicate $11.24-$17.22 with optimistic scenarios of $16.19-$21.56. These projections suggest LINK maintains higher absolute price levels with more measured growth expectations, while BOT shows percentage-based growth potential from a significantly lower base price, accompanied by correspondingly higher uncertainty.
Q5: What are the primary risks investors should consider when evaluating BOT versus LINK?
Both assets present distinct risk profiles requiring careful evaluation. BOT's primary risks include extreme price volatility (99.09% decline from peak), minimal liquidity constraints that amplify price movements, limited historical performance data for analysis, and uncertain regulatory treatment for AI-driven trading tools. LINK faces technical considerations related to oracle network security, data accuracy coordination among node operators, and exposure to broader cryptocurrency market cycles. Additionally, both assets operate within evolving regulatory frameworks, though LINK's established presence in DeFi infrastructure provides more regulatory precedent compared to BOT's emerging category.
Q6: How does institutional adoption differ between BOT and LINK?
Institutional adoption patterns show significant disparity between these assets. LINK has demonstrated established presence in decentralized finance ecosystems, serving as critical infrastructure enabling smart contracts to interact with real-world data across numerous DeFi protocols and Web3 applications. This foundational role has attracted institutional interest in oracle network infrastructure as blockchain middleware. In contrast, specific data regarding BOT's institutional adoption, enterprise partnerships, and ecosystem integration remains limited in available materials, reflecting its recent market entry in September 2025 and emerging status within the AI-driven trading tools sector.
Q7: What allocation strategies should aggressive investors consider for BOT and LINK exposure?
Aggressive investors with higher risk tolerance might consider differentiated allocation approaches reflecting each asset's characteristics. A potential framework could include LINK allocation at 15-25% of crypto portfolio holdings, recognizing its established infrastructure role and demonstrated ecosystem adoption. BOT allocation might range from 3-5%, acknowledging its emerging status, extreme volatility profile, and speculative nature. Risk management strategies should incorporate diversification through stablecoin holdings, options strategies for downside protection, disciplined position sizing, and dollar-cost averaging to mitigate timing risks. Portfolio construction should account for correlation risks and maintain capital allocated to high-volatility assets within acceptable loss tolerance parameters.
Q8: What market conditions might favor investment in BOT versus LINK during 2026-2031?
Different market environments may create varying opportunity sets for these assets. LINK may benefit from expansion in DeFi adoption, increased institutional allocation to blockchain infrastructure, regulatory clarity for oracle networks, and broader smart contract ecosystem growth. BOT might see favorable conditions during periods of heightened trading activity, growing interest in AI-driven analytics tools, expansion of on-chain trading volumes, and innovation cycles in automated trading strategies. However, both assets remain subject to macroeconomic factors including monetary policy shifts, broader cryptocurrency market sentiment (currently showing Extreme Fear at index level 14), and evolving regulatory frameworks that could impact infrastructure projects and trading platforms differently across jurisdictions.
Share
Content
Introduction: Investment Comparison Between BOT and LINK
I. Historical Price Comparison and Current Market Status
II. Core Factors Influencing BOT vs LINK Investment Value
III. 2026-2031 Price Prediction: BOT vs LINK
IV. Investment Strategy Comparison: BOT vs LINK
V. Potential Risk Comparison
VI. Conclusion: Which Is the Better Buy?
VII. FAQ
How to Buy Cryptocurrency


Trending Cryptocurrencies


What will be the market capitalization of USDC in 2025? Analysis of the stablecoin market landscape.

How is DeFi different from Bitcoin?

What is DeFi: Understanding Decentralized Finance in 2025

USDC stablecoin 2025 Latest Analysis: Principles, Advantages, and Web3 Eco-Applications

Development of Decentralized Finance Ecosystem in 2025: Integration of Decentralized Finance Applications with Web3

2025 USDT USD Complete Guide: A Must-Read for Newbie Investors

7 Indicators for Beginner Traders

What is a Non-Custodial Wallet vs. a Custodial Wallet?

Comprehensive Guide to Cryptocurrency Airdrops
What are Satoshis, and why is Bitcoin divided into smaller units

Comprehensive Guide to Camelot DEX