Comprehensive Guide to Inverted Hammer Candlestick Pattern for Cryptocurrency Trading

What Is the Inverted Hammer Candlestick?
The inverted hammer candlestick, also referred to as an inverse hammer, serves as a technical indicator signaling the potential end of a downtrend. When traders identify this candlestick pattern on a price chart, it suggests the presence of buying pressure, indicating that prices could begin to rise. The inverse hammer acts as an early warning signal that a bullish reversal pattern may be approaching. A bullish reversal occurs when buyers gain control of the market and successfully reverse a downward trend into an upward trajectory.
Candlestick patterns represent the visual representation of price movements displayed on candlestick charts. These patterns help cryptocurrency traders attempt to forecast the future price direction of digital assets. The concept of candlestick charts was originally developed by Munehisa Homma, a Japanese rice trader, during the 18th century. In modern times, crypto traders extensively utilize candlestick charts as part of their technical analysis toolkit to predict potential price movements and market behavior.
For example, when a trader observes an inverted hammer forming after a prolonged period of declining prices, they might interpret this as a signal to prepare for a potential buying opportunity. The pattern's effectiveness lies in its ability to capture the psychological shift in market sentiment from bearish to bullish.
What Does the Inverted Hammer Look Like?
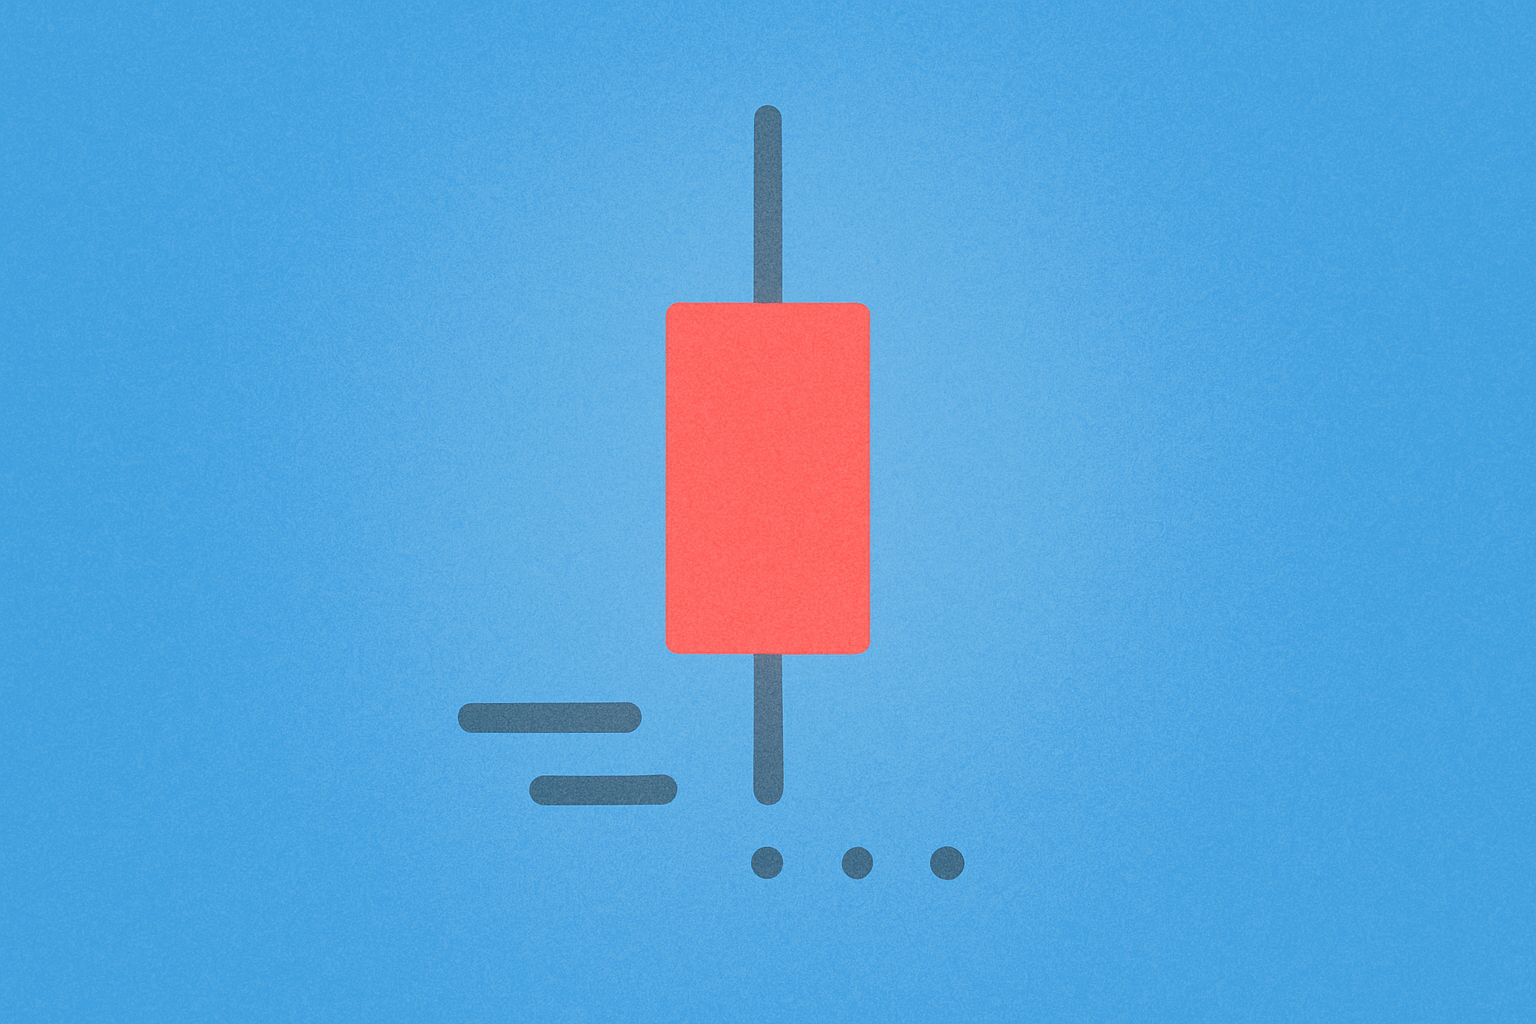
The inverted hammer candlestick presents a distinctive appearance resembling an upside-down hammer or an inverted capital letter "T." The defining characteristics include a short body positioned at the bottom, accompanied by a long upper wick (also called a shadow) that extends significantly upward. The pattern may feature a tiny lower wick or none at all. The upper wick is notably extended, measuring at least double the size of the real body, which creates the characteristic inverted hammer shape.
Understanding the components of a candlestick is essential for proper pattern recognition:
- Body: This central portion represents the range between the opening and closing prices during the trading period. A larger body indicates greater price movement between open and close.
- Wick (Shadow): The thin lines extending from the body depict the intra-day high and low prices, showing the full range of price action during the trading session.
- Color: The color coding of candlestick bodies provides immediate visual information about price direction. White or green bodies indicate that the closing price was higher than the opening price, suggesting bullish pressure. Conversely, black or red bodies signify that the closing price was lower than the opening price, indicating bearish pressure.
The visual simplicity of the inverted hammer makes it one of the more accessible patterns for traders to identify, even those with limited experience in technical analysis.
Green and Red Inverted Hammers
An inverted hammer candlestick can manifest in either green or red coloration, with each carrying slightly different implications for traders.
A green inverted hammer candlestick forms when the closing price exceeds the opening price, combined with a long extended upper wick. This configuration suggests that despite intraday volatility that pushed prices significantly higher, the closing price settled above where trading began, indicating sustained buying interest.
Conversely, a red inverted hammer candlestick develops when the closing price falls below the opening price while still maintaining a long extended upper wick. This pattern shows that although buyers pushed prices higher during the session, sellers managed to drive the price back down by the close, though not to the session's lowest point.
In both scenarios, the closing and opening prices remain very close together, which is crucial for creating the distinctive hammer shape of the candlestick. The narrow body reflects the minimal difference between open and close, while the long upper wick demonstrates significant price rejection at higher levels.
A green inverted hammer is generally considered a more bullish indicator than its red counterpart, as it shows buyers maintained control through the close. However, both color variations are interpreted as potentially bullish signals when appearing in the proper context of a downtrend.
How Does an Inverted Hammer Form?
An inverted hammer forms through a specific sequence of market dynamics that reflects a shift in the balance of power between buyers and sellers. The pattern develops when bullish traders begin to gain confidence following a downtrend, resulting in the open, low, and close prices clustering at nearly identical levels. This clustering at the lower end of the trading range is a critical characteristic of the pattern.
The long upper shadow emerges as bullish traders assert themselves and push prices as high as possible during the trading session. This upward push demonstrates that buyers are testing higher price levels and attempting to establish support for a reversal. On the opposing side, bears or short sellers create the tiny lower wick as they resist the rising prices and attempt to push them back toward the opening level. However, with an inverted hammer actually materializing, the buying pressure ultimately overpowers the bearish forces, and the price settles at a higher level relative to the session's low.
The formation process can be understood as a battle between buyers and sellers, where buyers make a strong attempt to reverse the trend but face resistance. The long upper wick represents this failed attempt to maintain higher prices, while the close near the open shows that neither side achieved complete dominance.
Therefore, the inverted hammer is interpreted as a bullish signal because prices demonstrate resistance to continuing the downward trend thanks to powerful buying pressure from buyers. The candlestick that appears on the following trading day is closely watched by traders as a confirmation signal to determine whether prices are likely to surge higher or whether the downward trend might resume.
Interestingly, an inverse hammer can also occur during an uptrend, though in this context it carries a different interpretation. When this pattern appears at the top of an upward trend, it is called a shooting star and serves as a warning to traders of an upcoming bearish reversal. A shooting star forms when the prices of open, low, and close are approximately the same, but in this case, it indicates that bears have overcome bulls and have pushed the closing price below the opening level.
Inverted Hammer Formation in Detail
The bullish inverse hammer formation involves a specific two-candle pattern that traders should understand thoroughly. The pattern includes a tall black or red candle followed by a short candle with a long upper wick. The tall candle appears on the first day of the pattern, establishing the continuation of the existing downtrend. The short inverted hammer candle emerges on the second day. Both candles form at the bottom of the trading range, which is crucial for the pattern's bullish interpretation.
On the day the inverted hammer candle appears, the market typically opens at or near the bottom of the recent trading range, continuing the bearish sentiment. During the session, buyers attempt to reverse the downtrend by pushing prices significantly higher, creating the long upper wick. However, this upward movement isn't strong enough to be sustained, primarily due to resistance from sellers who remain active in the market. As a result, the asset's price closes near its opening price, forming the characteristic small body of the inverted hammer.
The confirmation of a potential reversal can only be considered more reliable on the second day following the inverted hammer's appearance. At this critical juncture, the price should open above the body of the inverted hammer candle. This gap up or higher open serves as confirmation that buyers have indeed gained control. The confirmation becomes increasingly reliable as the market opens progressively higher above the inverted hammer's body.
Traders often wait for this confirmation candle before entering positions, as the inverted hammer alone does not guarantee a reversal. The confirmation candle provides additional evidence that the shift in market sentiment is genuine and not merely a temporary fluctuation.
What Does the Inverted Candlestick Hammer Mean?
After a prolonged downtrend, the appearance of an inverted candlestick hammer carries significant meaning for market participants. The pattern signals increasing buyer pressure and warns traders that a bullish reversal could be approaching. The short candlestick body is particularly meaningful, as it suggests that while asset prices have been dropping, sellers are beginning to lose their control over price direction.
The psychological interpretation of this pattern is important to understand. The long upper wick demonstrates that buyers attempted to push prices significantly higher during the trading session, showing their willingness to step in at these lower price levels. Although sellers managed to push prices back down by the close, the fact that buyers were able to drive prices so high during the session indicates growing bullish conviction.
However, traders must not view the inverted hammer in isolation. Making trading decisions based solely on this single pattern would be imprudent. Instead, traders need to observe other candlestick characteristics, technical indicators, and subsequent candlestick patterns to make well-informed decisions. For instance, a particularly long upper wick is generally considered a stronger indicator of a potential bullish reversal, as it demonstrates more aggressive buying activity. Additionally, a green inverted hammer typically implies a stronger bullish bias compared to a red one, as it shows buyers maintained control through the close.
Depending on what various indicators and subsequent candles reveal, traders should consider entering long positions only if multiple signals suggest the uptrend will continue. Conversely, traders should consider selling (going short) or staying out of the market if they believe the inverted hammer isn't powerful enough and the downtrend will most likely resume. Risk management tools such as stop-loss orders should always be employed when trading based on candlestick patterns.
The Pros and Cons of an Inverted Hammer Candlestick
Pros
-
Easy to Identify: The inverse hammer is relatively straightforward to recognize on price charts since it appears at the bottom of the trading range and possesses the distinct shape of an upside-down hammer. This visual simplicity means this candlestick pattern is particularly beginner-friendly, allowing new traders to incorporate it into their analysis without extensive experience. The pattern's distinctive appearance makes it difficult to confuse with other candlestick formations.
-
Multiple Entry Points: The inverse hammer enables investors to enter their positions at various stages of a potential trend reversal. Traders can enter at the start of the uptrend immediately following confirmation, or they can wait until the uptrend begins acquiring momentum and shows additional signs of strength. This flexibility allows traders to align their entry strategy with their risk tolerance and trading style.
Cons
-
Potentially Short-Lived Signal: The inverse hammer may prove to be a short-lived indicator rather than a signal of a long-term trend reversal. The pattern can sometimes represent merely a temporary pause in the downtrend rather than a genuine reversal. Therefore, it's critically important to confirm the market's direction through additional analysis before making any trading decisions. Traders who act too quickly on an inverted hammer without confirmation may find themselves caught in a false reversal.
-
Requires Complementary Analysis: Traders cannot rely on the inverse hammer in isolation to make sound trading decisions. They need to examine other technical indicators, volume data, support and resistance levels, and broader market context to make the best possible decisions. The pattern should be viewed as one piece of evidence rather than definitive proof of a trend reversal.
Why Traders Should Know the Inverted Hammer
The inverted hammer candlestick represents a valuable pattern that cryptocurrency traders can incorporate into their decision-making process for establishing, selling, or buying positions. Its significance extends beyond its relatively straightforward nature, making it accessible even to beginners who are still developing their technical analysis skills.
Understanding the inverted hammer provides traders with an additional tool for identifying potential trend reversals, which are among the most profitable trading opportunities in any market. The pattern helps traders recognize when market sentiment may be shifting from bearish to bullish, allowing them to position themselves advantageously ahead of potential price increases.
However, it's essential to emphasize that making trading decisions should be based on a comprehensive combination of factors and trading signals. This includes fundamental analysis, sentiment factors, technical analysis tools, chart patterns, volume analysis, and broader market conditions. Making decisions based solely on the inverted hammer pattern is not advisable and can lead to poor trading outcomes. The pattern is one of many tools that, when combined effectively, can contribute to successful market analysis and trading decisions.
Traders should also consider the broader market context, including overall cryptocurrency market trends, news events, and macroeconomic factors that might influence price movements. The inverted hammer becomes more reliable when it aligns with other bullish signals and appears in a market environment conducive to reversals.
FAQ
What is an Inverted Hammer Candlestick Pattern? What are its characteristics?
An Inverted Hammer is a bullish reversal signal with a small body and long upper wick, indicating price rejection after a sharp decline. It typically appears at the end of downtrends, signaling potential trend reversal and market recovery.
How to identify and correctly draw the Inverted Hammer candlestick pattern? What conditions must be met?
Identify Inverted Hammer by its long upper wick, short or absent lower wick, and distinct body-to-wick ratio. The standard form has minimal lower shadow. Stronger signals occur when body and upper wick show greater disparity, appearing at support levels after downtrends.
What does the Inverted Hammer candlestick pattern mean in trading? What price movement does it signal?
The Inverted Hammer indicates a potential bullish reversal, suggesting price may shift from downtrend to uptrend. It typically appears after a downtrend, signaling strengthening bullish momentum and possible trend reversal.
What is the difference between Inverted Hammer and Hammer candlestick patterns?
The Inverted Hammer has a long upper wick and small body, resembling an inverted hammer. The Hammer has a long lower wick and small body, resembling a hammer. They appear at opposite ends of price movements and signal different reversal patterns in technical analysis.
How effective are Inverted Hammer Candlestick Pattern trading signals under different market conditions (uptrend, downtrend, consolidation)?
In uptrends, Inverted Hammer signals are reliable, but watch for pressure level breakthroughs followed by reversals. In downtrends, signals lose effectiveness unless support breaks. During consolidation periods, signal reliability diminishes significantly.
What is the success rate of inverted hammer candlestick patterns in trading? Which other indicators should be combined for confirmation?
Inverted hammer patterns show relatively high success rates when confirmed with additional indicators. Combine with moving averages, trading volume, and RSI for reliability. Using this pattern alone may generate false signals in volatile markets.
How to formulate trading strategies using inverted hammer candlestick patterns? How should entry and stop-loss points be set?
Enter at the lowest price when inverted hammer forms, set stop-loss below the lowest point. Combine with KDJ indicator and trend analysis for confirmation. This pattern signals potential reversal opportunities with clear technical levels for risk management.
What is the relationship between the Inverted Hammer candlestick pattern and other reversal patterns such as the Shooting Star and Morning Star?
The Inverted Hammer is a bullish reversal signal at support levels, while patterns like Shooting Star and Morning Star serve similar roles in identifying trend reversals. These patterns complement each other in technical analysis to confirm potential price direction changes and market turning points.
Share
Content
What Is the Inverted Hammer Candlestick?
What Does the Inverted Hammer Look Like?
Green and Red Inverted Hammers
How Does an Inverted Hammer Form?
Inverted Hammer Formation in Detail
What Does the Inverted Candlestick Hammer Mean?
The Pros and Cons of an Inverted Hammer Candlestick
Why Traders Should Know the Inverted Hammer
FAQ
How to Buy Cryptocurrency


Trending Cryptocurrencies


How to Withdraw Money from Crypto Exchanges in 2025: A Beginner's Guide

Hedera Hashgraph (HBAR): Founders, Technology, and Price Outlook to 2030

Jasmy Coin: A Japanese Crypto Tale of Ambition, Hype, and Hope

IOTA (MIOTA) – From Tangle Origins to 2025 Price Outlook
Bitcoin Price in 2025: Analysis and Market Trends

How to Trade Bitcoin in 2025: A Beginner's Guide

Anonymity vs. Pseudonymity: Key Differences Explained
Cryptocurrency staking: What is it and how can you earn profits from it
Money-Making Games: Top 23 Projects for Earning

Can quantum computers break Bitcoin?

What is MEPAD: A Comprehensive Guide to Mobile Electronic Personal Assistant Devices