Comprehensive Guide to Wyckoff Pattern for Bitcoin Trading

Bitcoin Price Outlook Through Wyckoff Pattern
Analysts may have different perspectives when analyzing Bitcoin's Wyckoff Pattern. The following represents the view of Onchain Edge, an analyst active on CryptoQuant.
Onchain Edge indicates that Bitcoin price was in a re-accumulation phase during recent periods. Bitcoin's price oscillated between horizontal support levels (approximately $57,178) and resistance levels (approximately $71,587), demonstrating the typical sideways movement characteristic of re-accumulation.
Generally, the re-accumulation phase occurs in the early stages of the distribution phase in the Wyckoff Pattern. This signals that institutions or experienced investors are re-purchasing assets. During this period, prices may rise again or stabilize at certain levels. Unlike the accumulation phase, trading volume tends to decrease during re-accumulation. Bitcoin's trading volume formed red bars, indicating more selling than buying. Additionally, the volume size decreased to nearly half compared to previous peaks.
However, Onchain Edge pointed out that in the short term, Bitcoin's price could potentially decline from $57,000 to $51,000. This corresponds to the final stage of distribution in the Wyckoff Pattern. If this occurs, significant Bitcoin outflows from exchanges may happen.
If the re-accumulation phase continues, the Wyckoff Pattern could transition to the next stage: uptrend/breakout. However, to confirm this, it's crucial to carefully monitor on-chain indicators such as exchange inflows, market value to realized value, and profit/loss ratios relative to holding periods.
Understanding Wyckoff Pattern
Unlike other tools that track price reversals and trend-based movements, Wyckoff Pattern is particularly useful for understanding and trading within expected price ranges.
This method views the market from a broader perspective through supply and demand, price and volume. It helps identify price movements that may be hidden within wide price ranges or behind whipsaws (abandoning broad trends for short-term significant price changes).
Additionally, it helps traders predict future price movements related to assets by dividing investment scenarios and price cycles into stages. Wyckoff Pattern is broadly divided into accumulation and distribution periods. Every standard Wyckoff price cycle can be divided into four stages: Accumulation, Markup (Uptrend), Distribution, and Markdown (Downtrend).
Accumulation Phase
The first stage concerns smart money. Smart money refers to experienced investors or institutional investors with extensive information in the investment market. This phase describes the process where these groups accumulate desired coins or specific asset classes.
This phase appears as trading following a steady price decline. To ordinary investors, it may look like range-bound movement, but in reality, it's a zone where smart money enters buying positions. Informed investors recognize the characteristics of undervalued assets during the accumulation phase and carefully continue buying.
The declining coin price eventually finds support and begins moving sideways.
Think of the accumulation phase as a shopping mall conducting clearance sales. This means inventory is available in the market at very cheap prices. In other words, it also suggests that the coin's price has bottomed and could rise from this point.
Distribution Phase
The distribution phase is the third stage of the Wyckoff price cycle. After the accumulation and markup phases are complete, following a sustained uptrend, a certain trading range appears. At this point, smart money or well-informed and experienced investors begin secretly disposing of their holdings. However, ordinary investors continue attempting to buy because overall market sentiment remains bullish even after price increases.
The distribution phase is the exact opposite of the accumulation phase and requires preparation for sustained price declines.
Wyckoff Pattern Use Cases
Wyckoff Pattern is one of many trading strategy tools, including moving averages and relative strength index. Using Wyckoff Pattern in conjunction with other cryptocurrency investment strategies can help capture notable investment momentum.
Below are examples demonstrating accumulation zones before significant price movements in Bitcoin and traditional markets. These patterns illustrate how the methodology applies across different asset classes and timeframes.
Historical price charts show clear accumulation patterns preceding major rallies, where smart money systematically accumulated positions while retail investors remained uncertain. Similarly, distribution patterns have accurately predicted significant market corrections across various market cycles.
History of Wyckoff Pattern
Wyckoff Pattern was first introduced by market analyst Richard Demille Wyckoff in his 1931 book "Stock Market Technique." He believed that market flow significantly changes according to the behavior of experienced traders or institutional investors. When developing this tool, Wyckoff closely observed market experts like JP Morgan and legendary investor Jesse Livermore.
The principles governing Wyckoff Pattern movement are as follows:
- All markets consist of cycles of accumulation, uptrend, distribution, and downtrend.
- Markets determine prices through supply and demand. Investors must read price and volume data together.
- Institutional investors or smart money can influence market movements. Their behavior must be tracked when predicting trends.
- To capture potential opportunities, compare the asset to benchmarks (Bitcoin for coins) or indices (S&P 500 for stocks). This helps understand the asset's strengths and weaknesses.
- Accurate trading timing is essential. Even when using the Wyckoff method, identify entry and exit points, then adjust position size with stop losses.
In-Depth Analysis of Wyckoff Method
Wyckoff trading consists of five main approaches:
- Determining market cycle or phase
- Analyzing supply and demand dynamics
- Assessing market conditions (strengths and weaknesses)
- Analyzing market readiness (finding signs and optimal timing for entry or exit)
As previously explained, Wyckoff Pattern consists of four phases: Accumulation, Markup (Uptrend), Distribution, and Markdown (Downtrend).
Accumulation Phase Details
This occurs immediately after a downtrend and is characterized by low-price buying, steady buying volume increases, and slight price fluctuations.
Price charts demonstrate Bitcoin in the accumulation phase. The accumulation phase began when the Relative Strength Index (RSI) dropped below 25. Oversold and undervalued zones play a role in further pushing the accumulation phase.
Toward the end of the accumulation phase, green candles can be observed accumulating.
Markup Phase (Uptrend)
Historical Bitcoin charts show similar situations. When Bitcoin prices declined, conversely, the RSI signaled preparation for an upward move.
Distribution Phase Characteristics
The distribution phase begins after a prolonged uptrend. High RSI and increasing red candles are characteristic features. This also signifies increasing selling pressure.
Price charts from previous market cycles show Bitcoin reaching peak levels during distribution phases. At that time, RSI was in the overbought zone, suggesting an imminent correction. As visible in the chart, trading volume was also declining sharply. Subsequently, a distribution phase followed with a significant RSI decline.
Just before the distribution phase ends, progressively accumulating red columns indicate an incoming correction.
Markdown Phase (Downtrend)
The distribution phase (markdown) still represents a range-bound market, but during the price reduction phase, prices decline. This is when selling pressure becomes evident, and even unconsciously invested investors begin cashing out.
Market Dynamics in Wyckoff Pattern
The price charts above also include supply and demand situations according to volume columns:
- Price increases with high volume indicate strong buying pressure, while price decreases with high volume (red columns) indicate strong selling pressure. These points are key to accumulation-markup and distribution-decline formations.
- If active accumulation and distribution phases are ongoing, candlestick boundaries can act as resistance and support levels. These can serve as entry and exit points for trading.
- Some Wyckoff patterns occur between each phase. Understanding Wyckoff patterns can help identify climaxes of price surges and drops.
- The timeframe for analyzing Wyckoff patterns can vary. Therefore, it's advisable to approach through trial and error. For example, Wyckoff patterns may not appear on daily charts but may appear on 4-hour charts of the same asset.
Key Points for Better Predictions
Now let's explore detailed analysis points within the Wyckoff Pattern.
Preliminary Support (PS)
Preliminary Support (PS) precedes the accumulation phase and represents the asset's lowest point. In the accumulation phase or trading range, preliminary support also refers to the point where price stabilizes. Alternatively, it's recognized as the starting point where smart money flows in.
Selling Climax (SC)
Although Selling Climax (SC) occurs after PS (Preliminary Support), SC appears first on charts. SC is the zone before the asset enters the accumulation trading range under significant selling pressure. During the PS or preliminary support phase, smart money (experienced investors) begins absorbing selling pressure.
This zone is often called the panic selling zone, which completely weakens selling pressure and initiates a new trading range.
Automatic Rally (AR)
Automatic Rally (AR) occurs after the Selling Climax when price receives support in the preliminary support zone. This happens because smart money or investors suddenly enter the market. Although this process isn't very noticeable, slight upward momentum appears. When price exits the Accumulation Phase, this creates resistance for the next Markup Phase.
Secondary Test (ST)
Secondary Test (ST) is a price decline occurring after the Automatic Rally, showing that selling pressure still exists and ends near preliminary support. Some investors panic sell seeing this decline, giving institutional investors more opportunities to buy.
After multiple Automatic Rallies and Secondary Tests, the Markup Phase may follow.
Spring
Another bearish consolidation phase arrives where price drops below preliminary support during the accumulation phase. This approach shakes out bearish stop losses and removes selling pressure until the last moment. 'Spring' is characterized by decreasing volume after price decline, indicating weakening selling momentum.
Last Point of Support (LPS)
At this point, the asset price tests the previous Secondary Test support level once more. When testing completes, the Markup Phase begins, breaking through Automatic Rally resistance.
This concludes the accumulation phase. Next is the distribution phase.
Preliminary Supply (PSY)
We know the distribution phase follows the uptrend. When a specific coin's price chart enters the distribution phase, the price uptrend breaks and encounters resistance zones in the range. Selling begins at this point. This point is also called Preliminary Supply (PSY).
Buying Climax (BC)
Buying Climax (BC) appears before preliminary supply, with sudden buyer influx or buying pressure occurring. Rapid price increases happen, which are again absorbed by trader selling.
Automatic Reaction (AR) or Automatic Sell-off (AS)
This is the opposite phenomenon of the Automatic Rally seen in the Accumulation Phase. Automatic Reaction (AR) or Automatic Sell-off (AS) is a rapid price correction caused by smart money selling assets. Uninformed investors view this as normal correction and continue holding their assets. This phase also helps establish strong support levels for the asset.
UpThrust (UT)
After the automatic sell-off, a rally called UpThrust (UT), meaning pushing upward, follows. At this point, more investors jump into the price rally, forming resistance levels higher than preliminary resistance. More buying occurs at this level, but smart money selling absorbs additional buying pressure.
Secondary Test (ST)
This point can occur before or after the uptrend, where asset price retests PSY or PR (Preliminary Resistance) before starting correction again.
UpThrust After Distribution (UTAD)
UpThrust After Distribution (UTAD) is a rare case that can be viewed as the asset price's final attempt to rise. However, price increases appear with low volume, indicating weakening buying momentum.
Last Point of Supply
The actual decline phase begins when price breaks the Automatic Rally support and starts declining. This point is also called 'Sign of Weakness' (SoW). This point is suitable for short-selling assets and presents a good opportunity if accurately identified.
This concludes the distribution phase. Various Wyckoff patterns operate regardless of phase, allowing traders or investors to capture better buying and selling points.
Historical Bitcoin charts demonstrate how peak levels during distribution phases represented UpThrusts, showing how many investors fell into this trap.
Assessing Market Strength: Complementing Wyckoff Method
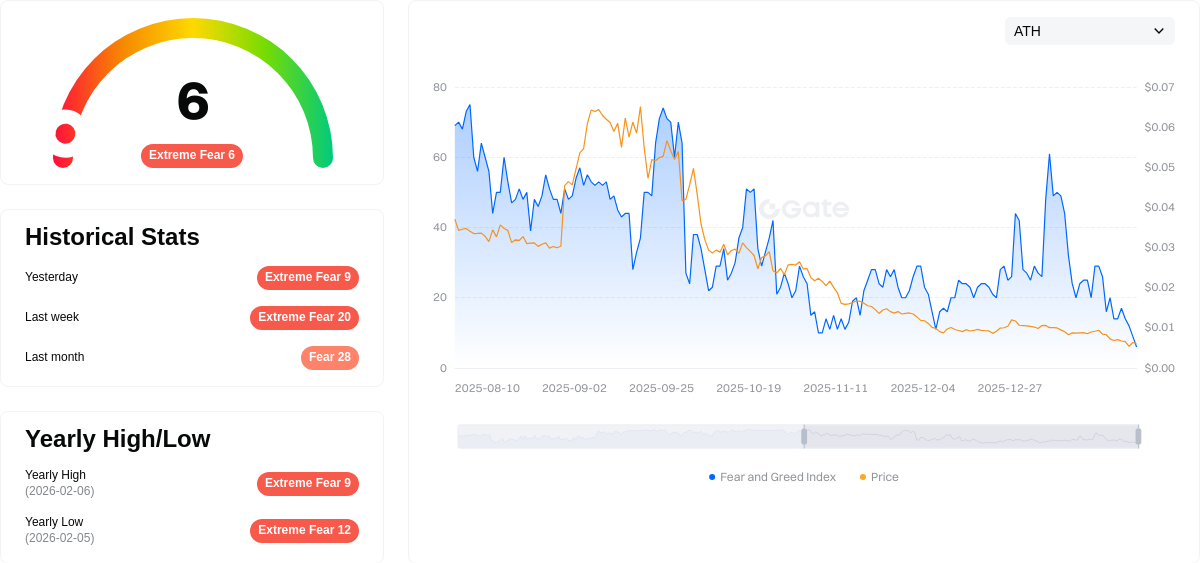
Understanding Wyckoff patterns helps find important investment momentum. However, assessing market strength to gain additional insights is also important. For example, when investing in coins, checking Bitcoin Dominance and Fear and Greed Index is advisable. These can serve as benchmarks for testing Wyckoff patterns.
Alternatively, observe RSI correlations. When assets are in the accumulation phase, if bullish divergence appears (price lowers but RSI rises), this can be interpreted as Markup Phase or long-term upward movement. Conversely, if RSI forms bearish divergence with price movement despite upward movement (price rises but RSI falls), entering the market may not be optimal.
Limitations of Wyckoff Pattern Analysis
Wyckoff method also has limitations:
- Time-consuming: Learning Wyckoff patterns can take considerable time.
- Should not rely solely: Don't depend only on Wyckoff patterns. Use various analytical tools like moving averages together for trend analysis.
- Volatility exists: Depending on market sentiment, assets can immediately rise or fall. In cryptocurrency trading, market sentiment on specific days can override Wyckoff patterns.
Conclusion
Wyckoff Pattern is a proven tool that more closely analyzes market dynamics such as supply and demand, price and volume, and accumulation and distribution. Investors can further enhance the utility of Wyckoff patterns by using them alongside key technical analysis tools such as moving averages, various indicators, and market sentiment.
FAQ
What is Wyckoff Pattern and what is its core principle?
Wyckoff Pattern is a technical analysis method based on supply and demand dynamics. Its core principle analyzes price and trading volume to identify institutional participation, helping traders understand market trends and major price movements driven by smart money.
What are the four stages of Wyckoff Pattern? How to identify accumulation and distribution phases?
Wyckoff Pattern comprises four stages: accumulation, uptrend, distribution, and downtrend. Accumulation phase shows buyers controlling market at low prices with increasing trading volume. Distribution phase exhibits sellers dominating at high prices with declining volume strength.
How to apply Wyckoff Pattern in actual trading to determine buy and sell points?
Identify price and volume trends at market reversals. Monitor relative volume levels during accumulation and distribution phases. Buy when price breaks above resistance with high volume; sell when it breaks below support with increased trading amount.
What is the role of trading volume in Wyckoff Pattern? Why combine volume analysis?
In Wyckoff Pattern, trading volume identifies institutional behavior and confirms trend strength. Combining volume analysis enables more accurate market predictions and reveals whether price moves are backed by genuine demand or supply.
What is the difference between Wyckoff Pattern and other technical analysis methods (such as candlestick patterns and moving averages)?
Wyckoff Pattern analyzes supply-demand dynamics through sequential candlestick analysis, focusing on accumulation and distribution phases. Unlike candlestick patterns emphasizing price formations or moving averages tracking average prices, Wyckoff identifies institutional behavior and trend reversals with higher probability by examining effort versus results in trading volume.
How to identify key support and resistance levels in Wyckoff Pattern?
Observe price action at historical bounce and pullback points. Support levels form where price rebounds upward, resistance levels form where price pulls back downward. These key levels help identify potential entry and exit opportunities in Wyckoff market structure analysis.
How effective is Wyckoff Pattern application across different time periods?
Wyckoff Pattern demonstrates strong effectiveness across multiple timeframes. Shorter periods like hourly charts excel at identifying precise entry points, while longer timeframes effectively determine overall trend direction. Its reliability adapts to various market conditions, making it a versatile tool for traders seeking consistent trading signals and market analysis across different temporal scales.
What are the risks to pay attention to when trading with Wyckoff Pattern?
Wyckoff Pattern trading risks include sudden market reversals, misidentifying key phases leading to wrong decisions, and potential losses. Market complexity means pattern interpretation may contain errors requiring careful analysis and risk management.
Share
How to Buy Cryptocurrency


Trending Cryptocurrencies


How to Withdraw Money from Crypto Exchanges in 2025: A Beginner's Guide

Hedera Hashgraph (HBAR): Founders, Technology, and Price Outlook to 2030

Jasmy Coin: A Japanese Crypto Tale of Ambition, Hype, and Hope
IOTA (MIOTA) – From Tangle Origins to 2025 Price Outlook

Bitcoin Price in 2025: Analysis and Market Trends
How to Trade Bitcoin in 2025: A Beginner's Guide

Hot Wallet vs Cold Wallet: Understanding the Key Differences

INX Review: Security Token Trading Platform
The Ultimate Beginner's Guide to CPU Mining
What is FRONTIERS: A Comprehensive Guide to Understanding the Global Open-Access Research Publishing Platform
What is STBU: A Comprehensive Guide to Understanding Secure Token-Based Authentication in Modern Systems