CRU vs ICP: A Comprehensive Comparison of Two Leading Decentralized Storage Solutions


Introduction: CRU vs ICP Investment Comparison
In the cryptocurrency market, the comparison between CRU and ICP has consistently been a topic investors cannot overlook. The two differ significantly in market cap ranking, application scenarios, and price performance, representing distinct positioning within the crypto asset landscape. CRU (Crust): Launched in 2020, it has gained market recognition through its positioning as a decentralized storage network for the Web3 ecosystem, supporting multiple storage layer protocols including IPFS. ICP (Internet Computer): Since its inception in 2019, it has been regarded as a decentralized cloud blockchain, among the cryptocurrencies with substantial global trading volume and market capitalization. This article will comprehensively analyze the investment value comparison between CRU and ICP around historical price trends, supply mechanisms, institutional adoption, technical ecosystems, and future forecasts, attempting to answer the question investors care about most:
"Which is the better buy right now?"
I. Historical Price Comparison and Market Overview
Price History of CRU (Coin A) and ICP (Coin B)
- 2021: CRU experienced significant price volatility, reaching an all-time high of $179.24 on April 12, 2021, during the broader crypto market bull run.
- 2021: ICP launched in May 2021 and achieved its historical peak of $700.65 on May 11, 2021, shortly after its debut, driven by strong initial market interest.
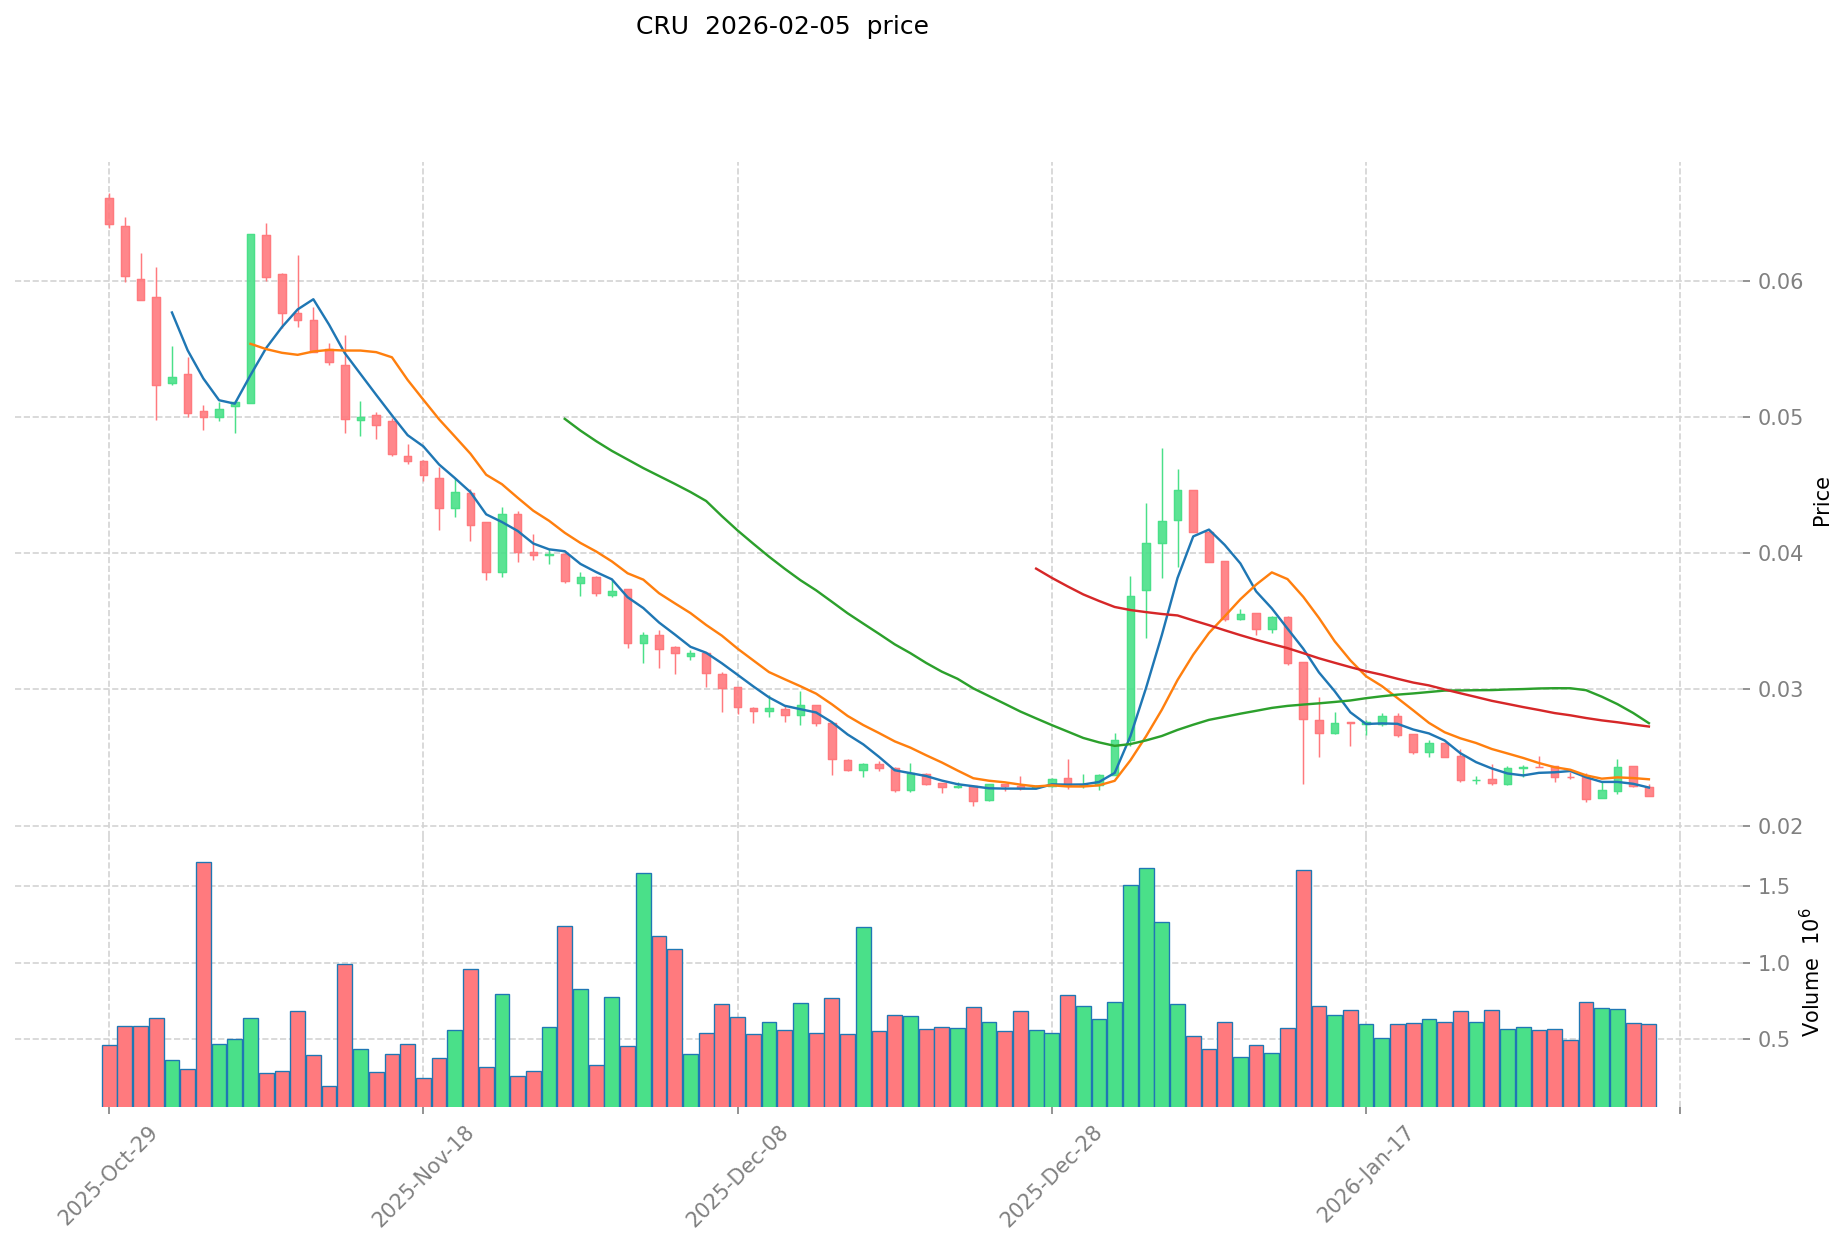
- 2026: CRU recorded its all-time low of $0.02160223 on February 1, 2026, reflecting a substantial decline from its peak.
- Comparative Analysis: Throughout the market cycle from 2021 to 2026, CRU declined from its high of $179.24 to a low of $0.02160223, representing a decrease of over 99.9%. During the same period, ICP fell from its peak of $700.65 to $2.23 (recorded on October 11, 2025), showing a decline of approximately 99.7%.
Current Market Status (February 5, 2026)
- CRU Current Price: $0.0222
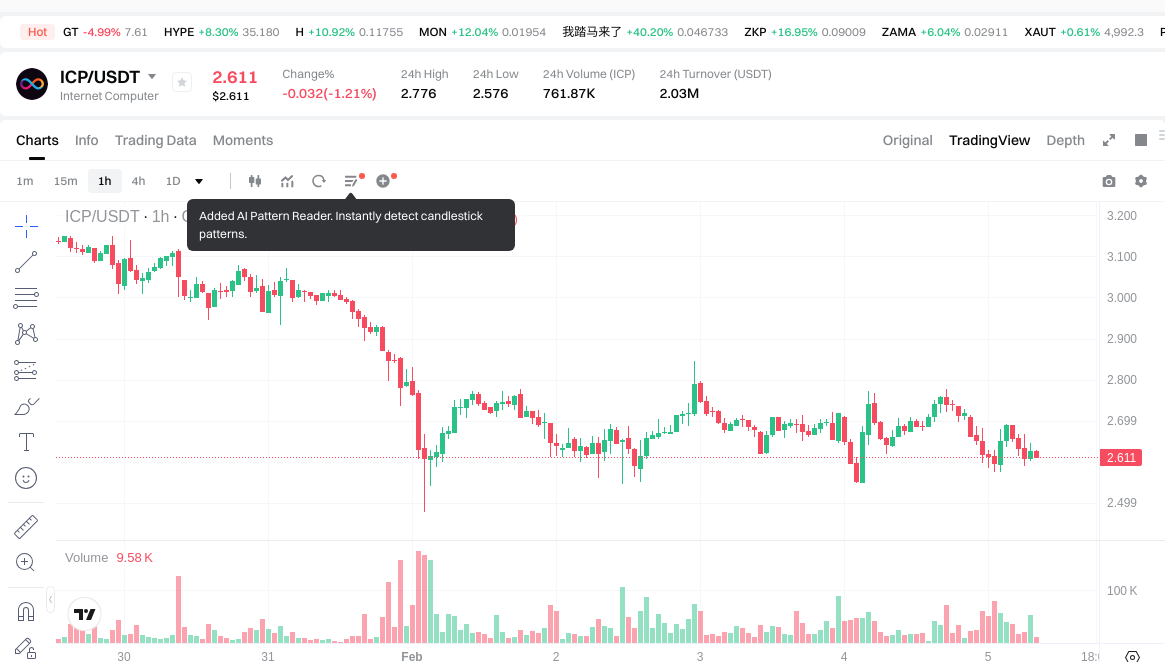
- ICP Current Price: $2.627
- 24-Hour Trading Volume: CRU recorded $13,657.35 compared to ICP's $2,024,347.18
- Market Sentiment Index (Fear & Greed Index): 14 (Extreme Fear)
View real-time prices:
- Check CRU current price Market Price
- Check ICP current price Market Price
II. Core Factors Influencing CRU vs ICP Investment Value
Supply Mechanism Comparison (Tokenomics)
Based on available materials, specific tokenomics details for CRU and ICP were not provided in the reference documents. The materials primarily discussed commodity market dynamics (particularly aluminum and copper markets via CRU commodity research) and pharmaceutical development (ICP as drug compound identifiers) rather than cryptocurrency token economics.
Note: CRU in the materials refers to CRU Group (Commodity Research Unit), a commodities research organization providing market analysis for metals and materials sectors, not a cryptocurrency token.
Institutional Adoption and Market Application
CRU (as Commodity Research Institution)
- Market positioning: Global authority in aluminum, copper, and materials market forecasting
- Enterprise adoption: Referenced by major aluminum producers including Innovation Industry Group, which ranks as China's 12th largest electrolytic aluminum producer with 788,100 tons annual capacity
- Policy influence: CRU forecasts indicate Chinese aluminum prices may rise to approximately 611 yuan/ton by 2028 due to increased imported bauxite usage
ICP (as Pharmaceutical Compounds)
- Clinical application: ICP-332 demonstrates promising results in autoimmune disease treatment, particularly atopic dermatitis (AD)
- Market potential: Phase II trials showed 78.2% and 72.5% improvement in EASI scores at 80mg and 120mg doses respectively (p<0.0001)
- Regulatory pathway: Advancing toward Phase III clinical trials in China with plans for US trial initiation
Technology Development and Ecosystem Construction
CRU Market Intelligence Technology
- Advanced forecasting models for commodity supply-demand dynamics
- Integration with industrial planning: Supports electrolytic aluminum industry capacity optimization
- Market gap analysis: Projects 313 million tons cumulative copper supply deficit from 2026-2029
ICP Pharmaceutical Innovation
- ICP-332 mechanism: TYK2 allosteric inhibitor demonstrating rapid symptom relief (statistically significant improvement from day 2)
- ICP-488 development: Targeting psoriasis treatment through TYK2 JH2 domain inhibition
- Safety profile: Phase trials show treatment-related adverse events limited to mild-moderate severity
Macroeconomic and Market Cycle Factors
Commodity Market Context (Relevant to CRU Analysis)
- Inflationary pressures: Global aluminum prices projected to rise moderately with Shanghai Futures Exchange prices increasing from 20,100 yuan/ton (2025) to 22,900 yuan/ton (2028)
- Supply constraints: Bauxite import dependency creates vulnerability, with Guinea instability driving Chinese bauxite prices from 528 yuan/ton (January-May 2024) to 720 yuan/ton (same period 2025)
- Demand drivers: AI data centers expected to become primary growth factor for fiber optic cable markets with 23% CAGR through future periods
Pharmaceutical Sector Dynamics (Relevant to ICP Compounds)
- Healthcare expenditure trends: Growing investment in autoimmune disease treatments
- Regulatory environment: Advancing clinical trial frameworks supporting innovative drug development
- Patient needs: Significant unmet medical demand with 33-90% of moderate-to-severe AD patients experiencing sleep disturbances
Investment Value Differentiation
The comparison reveals fundamentally different investment categories:
CRU represents commodity market intelligence services supporting industrial strategic planning in metals and materials sectors, with value derived from accurate forecasting enabling operational optimization.
ICP designates pharmaceutical compounds in clinical development, with investment value contingent on regulatory approval success, clinical efficacy validation, and commercial market penetration potential.
Cross-category comparison proves challenging given the distinct asset classes, valuation methodologies, and risk-return profiles inherent to commodity research services versus pharmaceutical development assets.
III. 2026-2031 Price Prediction: CRU vs ICP
Short-term Prediction (2026)
- CRU: Conservative range $0.0114-$0.0223 | Optimistic range $0.0223-$0.0321
- ICP: Conservative range $2.02-$2.62 | Optimistic range $2.62-$2.91
Mid-term Prediction (2028-2029)
- CRU may enter a gradual accumulation phase, with estimated price range of $0.0206-$0.0456
- ICP may enter a steady growth phase, with estimated price range of $2.65-$5.18
- Key drivers: institutional capital inflows, ETF developments, ecosystem expansion
Long-term Prediction (2030-2031)
- CRU: Baseline scenario $0.0237-$0.0497 | Optimistic scenario $0.0497-$0.0706
- ICP: Baseline scenario $2.51-$5.58 | Optimistic scenario $5.41-$6.67
Disclaimer
CRU:
| Year | Predicted High Price | Predicted Average Price | Predicted Low Price | Price Change |
|---|---|---|---|---|
| 2026 | 0.0320688 | 0.02227 | 0.0113577 | 0 |
| 2027 | 0.030973116 | 0.0271694 | 0.02445246 | 22 |
| 2028 | 0.04331617442 | 0.029071258 | 0.02064059318 | 30 |
| 2029 | 0.0456040824246 | 0.03619371621 | 0.0304027216164 | 63 |
| 2030 | 0.058485426023739 | 0.0408988993173 | 0.023721361604034 | 84 |
| 2031 | 0.070562870992137 | 0.049692162670519 | 0.043232181523351 | 123 |
ICP:
| Year | Predicted High Price | Predicted Average Price | Predicted Low Price | Price Change |
|---|---|---|---|---|
| 2026 | 2.91153 | 2.623 | 2.01971 | 0 |
| 2027 | 3.40373595 | 2.767265 | 1.46665045 | 5 |
| 2028 | 4.47397568875 | 3.085500475 | 2.6535304085 | 17 |
| 2029 | 5.17824117216875 | 3.779738081875 | 3.06158784631875 | 44 |
| 2030 | 6.673694544262593 | 4.478989627021875 | 2.50823419113225 | 70 |
| 2031 | 5.855159189924346 | 5.576342085642234 | 5.409051823072967 | 112 |
IV. Investment Strategy Comparison: CRU vs ICP
Long-term vs Short-term Investment Strategies
- CRU: May suit investors focused on emerging decentralized storage ecosystem opportunities, particularly those willing to accept elevated volatility in exchange for potential recovery scenarios from current depressed price levels
- ICP: May appeal to investors seeking exposure to decentralized cloud infrastructure with relatively larger market capitalization and trading liquidity compared to CRU
Risk Management and Asset Allocation
- Conservative Investors: CRU 10-15% vs ICP 85-90% allocation within crypto portfolio segment, reflecting ICP's comparatively higher liquidity and market establishment
- Aggressive Investors: CRU 30-40% vs ICP 60-70% allocation, potentially capturing asymmetric upside from CRU's substantially lower price base while maintaining ICP core position
- Hedging Instruments: Stablecoin reserves for opportunistic rebalancing, options strategies where available, cross-asset diversification across storage and infrastructure protocol categories
V. Potential Risk Comparison
Market Risk
- CRU: Exhibits extreme price volatility with 99.9% decline from peak levels, minimal trading volume ($13,657.35 daily) suggesting limited liquidity and elevated slippage risk during position adjustments
- ICP: Demonstrates significant historical drawdown (99.7% from peak) though maintains substantially higher trading activity ($2,024,347.18 daily), providing relatively improved liquidity conditions
Technical Risk
- CRU: Scalability and network stability considerations inherent to decentralized storage protocol architecture, dependency on IPFS infrastructure integration
- ICP: Computational resource distribution patterns, potential security considerations in decentralized cloud environment implementation
Regulatory Risk
- Global regulatory frameworks continue evolving regarding decentralized storage networks and cloud infrastructure protocols, with potential differential treatment based on data sovereignty considerations and cross-border information flow regulations
- Both assets face ongoing scrutiny as cryptocurrency regulatory landscape develops across major jurisdictions
VI. Conclusion: Which Is the Better Buy?
📌 Investment Value Summary:
- CRU Advantages: Positioning within decentralized storage sector aligned with Web3 ecosystem growth narratives, substantially depressed valuation potentially offering asymmetric return profile for risk-tolerant capital
- ICP Advantages: Established market presence with significantly higher liquidity facilitating position management, decentralized cloud infrastructure positioning addresses growing computational resource decentralization demand
✅ Investment Recommendations:
- Novice Investors: Consider ICP allocation within diversified crypto portfolio given relatively superior liquidity characteristics, limit exposure to highly speculative assets like CRU until developing comprehensive risk management frameworks
- Experienced Investors: May evaluate graduated position building across both assets based on individual risk tolerance, utilizing dollar-cost averaging approaches during current extreme fear market conditions (Fear & Greed Index: 14)
- Institutional Investors: Conduct thorough due diligence regarding protocol fundamentals, ecosystem development trajectories, and tokenomics structures before capital deployment, prioritizing liquidity provisions and regulatory compliance considerations
⚠️ Risk Disclosure: Cryptocurrency markets exhibit extreme volatility. This content does not constitute investment advice. Investors should conduct independent research and consult qualified financial advisors before making investment decisions.
VII. FAQ
Q1: What accounts for the extreme price declines (>99%) experienced by both CRU and ICP from their historical peaks?
Both assets suffered from severe post-launch market corrections following initial speculative enthusiasm. CRU declined from $179.24 (April 2021) to $0.0222 (February 2026), while ICP fell from $700.65 (May 2021) to $2.627 (February 2026). These declines reflect broader cryptocurrency market cycles, diminished speculative demand following launch hype, extended crypto winter conditions from 2022-2025, and fundamental repricing as both projects transitioned from theoretical value propositions to operational reality with measurable adoption metrics.
Q2: How do the trading volumes of CRU and ICP compare, and why does this matter for investors?
ICP demonstrates substantially higher liquidity with $2,024,347.18 in 24-hour trading volume compared to CRU's $13,657.35—approximately 148 times greater. This liquidity differential significantly impacts investors through reduced slippage during position entries and exits, improved price discovery mechanisms, lower market manipulation vulnerability, and enhanced ability to execute risk management strategies. CRU's minimal trading volume creates elevated execution risk, particularly for larger position sizes, potentially resulting in substantial price impact during transactions.
Q3: Which asset presents greater upside potential based on current valuations and price predictions?
CRU theoretically offers higher percentage return potential from its extremely depressed $0.0222 base, with 2031 optimistic scenarios projecting $0.0706 (218% gain). However, ICP's predictions range from $2.627 current to $6.67 optimistic 2031 scenario (154% gain) while maintaining substantially superior liquidity and lower execution risk. The percentage advantage for CRU must be weighed against dramatically higher volatility risk, liquidity constraints, and existential uncertainty inherent to micro-cap assets. Risk-adjusted returns may favor ICP despite lower percentage projections.
Q4: What differentiates CRU's decentralized storage positioning from ICP's decentralized cloud infrastructure?
CRU focuses specifically on decentralized storage layer protocols supporting Web3 ecosystem requirements, emphasizing IPFS integration and data persistence capabilities. ICP positions as comprehensive decentralized cloud blockchain infrastructure enabling smart contract computation, hosting, and application deployment beyond storage functionality. This distinction suggests CRU targets narrower but potentially critical infrastructure component, while ICP addresses broader computational resource decentralization encompassing storage, processing, and application hosting. Investment implications center on market size differentials—storage represents specific segment versus ICP's holistic cloud alternative positioning.
Q5: How should conservative versus aggressive investors approach allocation between CRU and ICP?
Conservative investors should consider 10-15% CRU / 85-90% ICP allocation within their cryptocurrency portfolio segment, prioritizing ICP's superior liquidity and established market presence while maintaining limited CRU exposure for asymmetric upside potential. Aggressive investors may pursue 30-40% CRU / 60-70% ICP allocation, accepting elevated volatility risk in exchange for potentially amplified returns from CRU's depressed valuation base. Both strategies presume cryptocurrency allocation represents appropriate portfolio percentage based on individual risk tolerance, with dollar-cost averaging recommended given current extreme fear market conditions (Fear & Greed Index: 14).
Q6: What are the primary regulatory risks affecting CRU and ICP investments?
Both assets face evolving global regulatory frameworks addressing decentralized infrastructure protocols, with particular scrutiny regarding data sovereignty, cross-border information flows, and computational resource governance. CRU's storage focus intersects with data localization regulations and content moderation requirements potentially varying across jurisdictions. ICP's broader cloud infrastructure positioning encounters additional regulatory considerations surrounding financial services applications, identity verification requirements, and jurisdictional determinations for smart contract enforcement. Regulatory fragmentation across major markets (United States, European Union, Asia-Pacific) creates ongoing uncertainty affecting both protocol adoption trajectories and token valuation frameworks.
Q7: Given current market conditions (Extreme Fear: Index 14), is this an opportune entry point for CRU or ICP?
Extreme fear conditions (Index: 14) historically correlate with market bottoms presenting favorable risk-reward entry opportunities, though timing precision remains challenging. Both CRU and ICP trade near multi-year lows with substantial declines from peak valuations, potentially representing capitulation phases. However, macro uncertainties persist, and further downside cannot be excluded. Investors should consider graduated position building through dollar-cost averaging rather than concentrated lump-sum deployment, maintaining stablecoin reserves for potential additional accumulation opportunities. Current conditions favor patient capital willing to accept near-term volatility in exchange for potential multi-year recovery scenarios as cryptocurrency adoption progresses.
Q8: What are the key ecosystem development indicators investors should monitor for CRU versus ICP?
For CRU, critical metrics include IPFS integration milestones, total storage capacity utilization rates, number of active storage providers, ecosystem dApp deployments leveraging decentralized storage, and partnership announcements with Web3 projects. For ICP, monitor smart contract deployment volume, active canister (application container) growth, developer ecosystem expansion metrics, enterprise adoption announcements, and cross-chain integration developments. Both protocols require sustained ecosystem development demonstrating real-world utility beyond speculative trading to justify valuation recovery from current depressed levels. Quarterly ecosystem reports and on-chain activity metrics provide essential fundamental analysis inputs beyond price action monitoring.
Share
Content
Introduction: CRU vs ICP Investment Comparison
I. Historical Price Comparison and Market Overview
II. Core Factors Influencing CRU vs ICP Investment Value
III. 2026-2031 Price Prediction: CRU vs ICP
IV. Investment Strategy Comparison: CRU vs ICP
V. Potential Risk Comparison
VI. Conclusion: Which Is the Better Buy?
VII. FAQ
How to Buy Cryptocurrency


Trending Cryptocurrencies


Bitcoin Fear and Greed Index: Market Sentiment Analysis for 2025

Newbie Must Read: How to Formulate Investment Strategies When Nasdaq Turns Positive in 2025
Bitcoin Market Cap in 2025: Analysis and Trends for Investors

How to Mine Ethereum in 2025: A Complete Guide for Beginners

Best Crypto Wallets 2025: How to Choose and Secure Your Digital Assets
TapSwap Listing Date: What Investors Need to Know in 2025

How to Avoid Slippage in Cryptocurrency Trading

What Is a Blockchain Game Guild? Should You Join a Game Guild?

Free Money for App Registration: Crypto Rewards Guide
Top 4 Cryptocurrency Exchanges for Free Registration Bonuses

What is Slippage? How Can We Avoid It While Trading Crypto?