ETHS vs XTZ: A Comprehensive Comparison of Two Leading Blockchain Platforms and Their Investment Potential

Introduction: Investment Comparison Between ETHS and XTZ
In the cryptocurrency market, the comparison between ETHS vs XTZ has been a topic that investors cannot bypass. The two not only show significant differences in market cap ranking, application scenarios, and price performance, but also represent different positioning in the crypto asset space.
ETHS (ETHS): Launched in 2023, it has gained market recognition as the core asset of Facet, a decentralized Ethereum L1 scaling protocol funded by the Ethereum Foundation as an unstoppable rollup, empowering the secure expansion of the Ethereum mainnet.
Tezos (XTZ): Since its launch in 2017, it has been positioned as a self-amending blockchain that simplifies formal verification through a decentralized governance model, making it a universal and self-evolving cryptographic ledger.
This article will provide a comprehensive analysis of the investment value comparison between ETHS vs XTZ, covering historical price trends, supply mechanisms, institutional adoption, technical ecosystems, and future predictions, attempting to answer investors' most pressing question:
"Which is the better buy right now?"
I. Historical Price Comparison and Current Market Status
Historical Price Trends of ETHS (Coin A) and XTZ (Coin B)
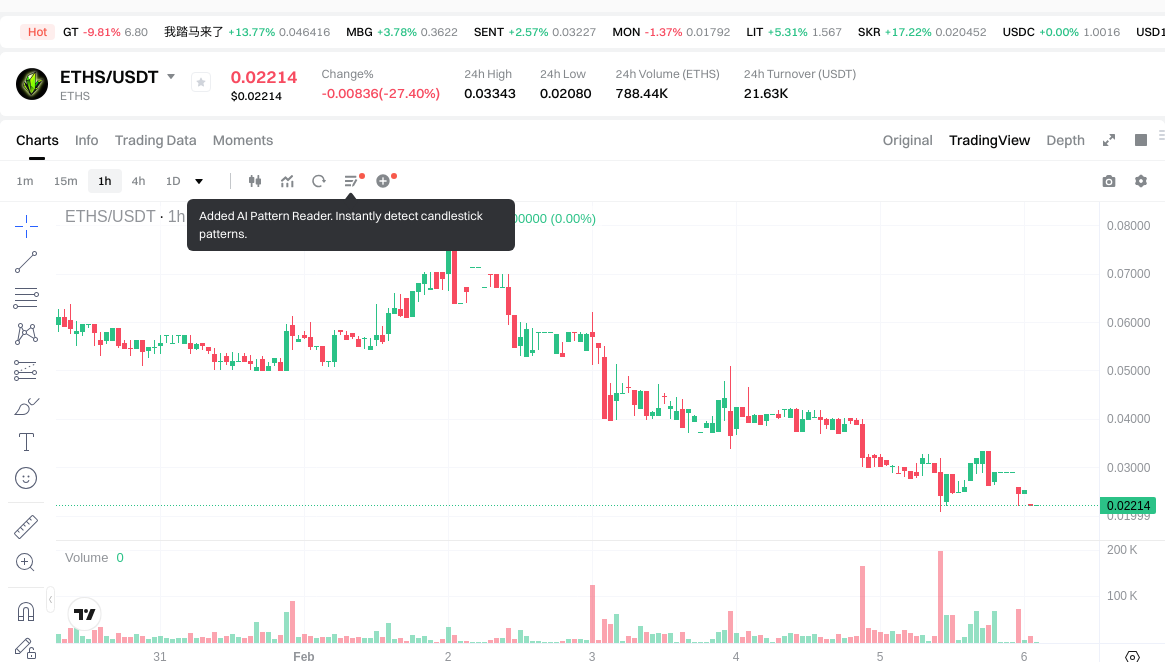
- 2023: ETHS experienced significant volatility, with price reaching $13.9 in December 2023, driven by its association with the Facet protocol and Ethereum Foundation support.
- 2024: ETHS price declined substantially from its peak, entering a prolonged correction phase throughout 2024.
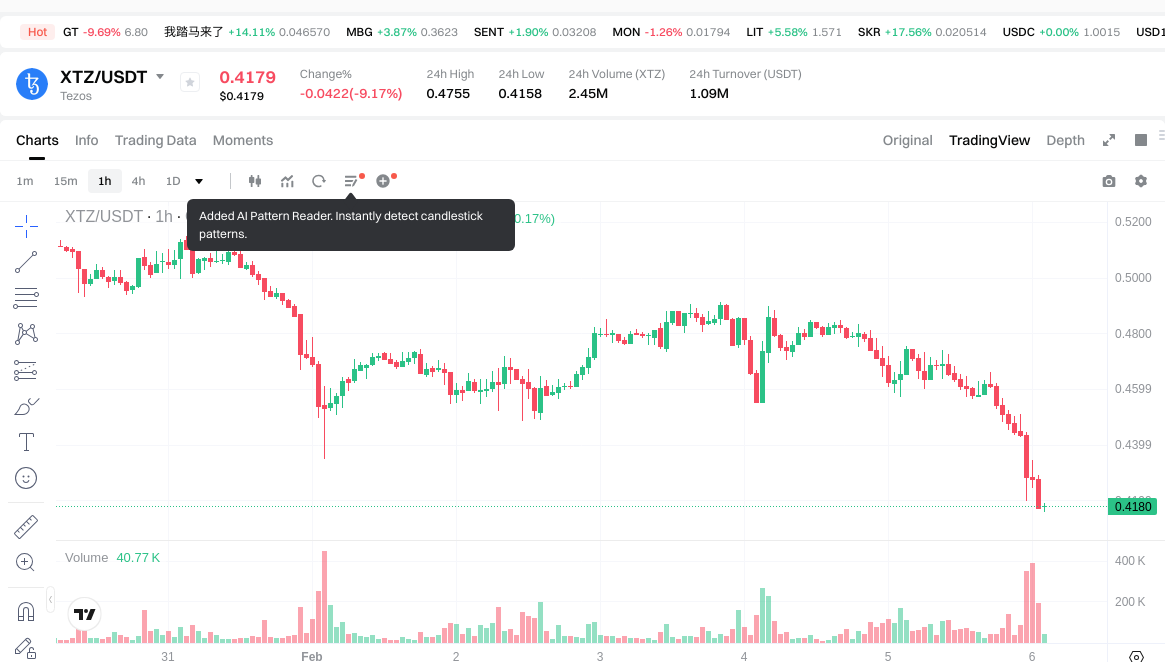
- 2021: XTZ reached its historical high of $9.12 in October 2021, coinciding with broader cryptocurrency market momentum.
- 2018: XTZ recorded its historical low of $0.350476 in December 2018, during the broader crypto market downturn.
- Comparative analysis: During recent market cycles, ETHS declined from $13.9 to $0.02214, representing a significant correction, while XTZ decreased from $9.12 to $0.4197, showing relatively more stability in price retention.
Current Market Status (February 6, 2026)
- ETHS current price: $0.02214
- XTZ current price: $0.4197
- 24-hour trading volume: ETHS $21,716.53 vs XTZ $1,099,140.91
- Market sentiment index (Fear & Greed Index): 12 (Extreme Fear)
- 24-hour price change: ETHS -27.95%, XTZ -9.86%
- Market capitalization: ETHS $464,940 vs XTZ $450,935,671.05
- Circulating supply: ETHS 21,000,000 (100% of total supply) vs XTZ 1,074,423,805.22 (98.17% of total supply)
View real-time prices:
- Check ETHS current price Market Price
- Check XTZ current price Market Price
II. Core Factors Influencing ETHS vs XTZ Investment Value
Supply Mechanism Comparison (Tokenomics)
- ETHS: The supply mechanism details are not extensively documented in available materials, though community consensus appears to be a significant factor in its tokenomics design
- XTZ: Specific supply mechanism information requires further technical documentation for comprehensive analysis
- 📌 Historical Pattern: Supply mechanisms play a role in shaping price cycle dynamics, though specific historical data for these assets requires additional research
Institutional Adoption and Market Application
- Institutional Holdings: Current institutional preference data between ETHS and XTZ requires comprehensive market analysis
- Enterprise Adoption: Both assets show varying degrees of application potential in cross-border payments, settlements, and investment portfolios, with XTZ demonstrating technical advantages in certain use cases
- National Policies: Regulatory attitudes toward both assets vary across different jurisdictions and continue to evolve
Technology Development and Ecosystem Building
- ETHS Technology: The project emphasizes community consensus as a core value proposition, positioning itself as providing foundational infrastructure elements
- XTZ Technology: Demonstrates technical advantages and broader application potential across various sectors
- Ecosystem Comparison: Both assets participate in DeFi, NFT, payment solutions, and smart contract implementations, with different levels of adoption and development maturity
Macroeconomic Factors and Market Cycles
- Performance in Inflationary Environment: The anti-inflation characteristics of both assets depend on multiple factors including adoption rates and technological development
- Macroeconomic Monetary Policy: Interest rates and US dollar index movements influence both assets through broader crypto market dynamics
- Geopolitical Factors: Cross-border transaction demand and international situations may affect adoption and utilization patterns differently for each asset
III. 2026-2031 Price Forecast: ETHS vs XTZ
Short-term Forecast (2026)
- ETHS: Conservative $0.019926 - $0.02214 | Optimistic $0.030996
- XTZ: Conservative $0.380562 - $0.4182 | Optimistic $0.510204
Mid-term Forecast (2028-2029)
- ETHS may enter a consolidation phase, with projected prices ranging from $0.022596 to $0.045192
- XTZ may enter a growth phase, with projected prices ranging from $0.371700 to $0.845318
- Key drivers: institutional capital inflows, ETF developments, ecosystem expansion
Long-term Forecast (2030-2031)
- ETHS: Baseline scenario $0.030635 - $0.039714 | Optimistic scenario $0.049581
- XTZ: Baseline scenario $0.518876 - $0.722417 | Optimistic scenario $1.165476
Disclaimer
ETHS:
| Year | Predicted High Price | Predicted Average Price | Predicted Low Price | Price Change |
|---|---|---|---|---|
| 2026 | 0.030996 | 0.02214 | 0.019926 | 0 |
| 2027 | 0.03772656 | 0.026568 | 0.01647216 | 20 |
| 2028 | 0.0363264264 | 0.03214728 | 0.0231460416 | 45 |
| 2029 | 0.045192646224 | 0.0342368532 | 0.022596323112 | 54 |
| 2030 | 0.04090619220336 | 0.039714749712 | 0.03058035727824 | 79 |
| 2031 | 0.049581879277946 | 0.04031047095768 | 0.030635957927836 | 82 |
XTZ:
| Year | Predicted High Price | Predicted Average Price | Predicted Low Price | Price Change |
|---|---|---|---|---|
| 2026 | 0.510204 | 0.4182 | 0.380562 | 0 |
| 2027 | 0.67773492 | 0.464202 | 0.35743554 | 10 |
| 2028 | 0.628065306 | 0.57096846 | 0.4681941372 | 36 |
| 2029 | 0.84531880503 | 0.599516883 | 0.37170046746 | 42 |
| 2030 | 0.87412559125815 | 0.722417844015 | 0.64295188117335 | 72 |
| 2031 | 1.165476707749399 | 0.798271717636575 | 0.518876616463773 | 90 |
IV. Investment Strategy Comparison: ETHS vs XTZ
Long-term vs Short-term Investment Strategies
- ETHS: May suit investors focused on emerging protocol infrastructure and community-driven development, though the asset demonstrates considerable volatility and requires careful risk assessment
- XTZ: May appeal to investors seeking established blockchain platforms with formal verification capabilities and self-amending governance mechanisms
Risk Management and Asset Allocation
- Conservative investors: ETHS 10-15% vs XTZ 85-90%
- Aggressive investors: ETHS 30-40% vs XTZ 60-70%
- Hedging instruments: stablecoin allocation, options strategies, cross-asset portfolio diversification
V. Potential Risk Comparison
Market Risk
- ETHS: Exhibits substantial price volatility with significant decline from historical peaks, limited trading volume at $21,716.53 in 24 hours, and relatively small market capitalization of $464,940
- XTZ: Demonstrates price fluctuations with 24-hour decline of 9.86%, though maintains considerably higher trading volume at $1,099,140.91 and market capitalization of $450,935,671.05
Technical Risk
- ETHS: Scalability considerations and network stability factors require ongoing monitoring as the protocol develops
- XTZ: Technical implementation aspects including network performance and potential security considerations warrant evaluation
Regulatory Risk
- Global regulatory frameworks continue evolving, potentially affecting both assets differently based on their respective use cases, technical implementations, and jurisdictional classifications
VI. Conclusion: Which Is the Better Buy?
📌 Investment Value Summary:
- ETHS Advantages: Association with Ethereum Foundation-funded scaling protocol, full circulating supply (100%), community consensus-driven approach
- XTZ Advantages: Established market presence since 2017, substantially higher market capitalization and trading volume, self-amending blockchain architecture with formal verification capabilities
✅ Investment Recommendations:
- Novice investors: Consider prioritizing XTZ due to higher liquidity, established market presence, and relatively larger market capitalization, while maintaining diversified portfolio approach
- Experienced investors: May explore strategic allocation across both assets based on risk tolerance, with emphasis on fundamental analysis and technical ecosystem development tracking
- Institutional investors: Conduct comprehensive due diligence on regulatory compliance, liquidity requirements, and alignment with investment mandates before allocation decisions
⚠️ Risk Disclosure: Cryptocurrency markets exhibit extreme volatility. This content does not constitute investment advice.
VII. FAQ
Q1: What is the current price difference between ETHS and XTZ, and which shows better liquidity?
As of February 6, 2026, XTZ is priced at $0.4197 while ETHS trades at $0.02214, representing approximately 19x price difference. XTZ demonstrates significantly superior liquidity with 24-hour trading volume of $1,099,140.91 compared to ETHS's $21,716.53, indicating approximately 50x higher trading activity. This substantial liquidity advantage makes XTZ more suitable for investors requiring position entry/exit flexibility and reduced slippage risk.
Q2: How do the supply mechanisms differ between ETHS and XTZ?
ETHS maintains a fully circulating supply of 21,000,000 tokens (100% of total supply), suggesting a fixed supply model with no remaining token releases. XTZ currently has 1,074,423,805.22 tokens in circulation (98.17% of total supply), indicating near-complete distribution with minimal remaining supply. The complete circulation of ETHS eliminates future inflation concerns, while XTZ's near-complete distribution suggests minimal future dilution impact on existing holders.
Q3: What are the projected price ranges for ETHS and XTZ through 2031?
For ETHS, short-term 2026 projections range from $0.019926 (conservative) to $0.030996 (optimistic), extending to $0.030635-$0.049581 by 2031. XTZ demonstrates higher projected values with 2026 estimates ranging from $0.380562 (conservative) to $0.510204 (optimistic), potentially reaching $0.518876-$1.165476 by 2031. These projections suggest XTZ maintains higher absolute price levels throughout the forecast period, though both assets demonstrate potential growth trajectories dependent on ecosystem development and market conditions.
Q4: Which asset presents higher risk for investors?
ETHS exhibits substantially higher risk characteristics including extreme volatility (24-hour decline of 27.95%), significantly lower market capitalization ($464,940), and minimal trading volume creating potential liquidity constraints. XTZ demonstrates relatively lower risk profile with larger market capitalization ($450,935,671.05), established market presence since 2017, and superior liquidity, though still experiences considerable volatility (9.86% 24-hour decline). Risk-averse investors should prioritize XTZ's stability, while risk-tolerant investors might consider ETHS for higher potential returns alongside elevated risk exposure.
Q5: What technical advantages distinguish ETHS and XTZ?
ETHS positions itself as core infrastructure for Facet, an Ethereum L1 scaling protocol backed by the Ethereum Foundation, emphasizing community consensus and scalability solutions for Ethereum mainnet expansion. XTZ operates as a self-amending blockchain featuring formal verification capabilities and decentralized governance mechanisms, enabling protocol upgrades without hard forks. The fundamental difference lies in ETHS's focus on Ethereum scaling infrastructure versus XTZ's emphasis on self-evolving blockchain architecture with built-in governance and formal verification for smart contract security.
Q6: How should different investor types allocate between ETHS and XTZ?
Conservative investors should consider 10-15% ETHS allocation versus 85-90% XTZ to prioritize stability and liquidity while maintaining limited exposure to higher-risk opportunities. Aggressive investors might allocate 30-40% to ETHS and 60-70% to XTZ, accepting elevated volatility for potentially higher returns. Novice investors should prioritize XTZ due to established market presence, superior liquidity, and relatively lower volatility, while experienced investors can strategically balance both assets based on risk tolerance and market analysis capabilities.
Q7: What institutional factors favor XTZ over ETHS?
XTZ demonstrates substantially higher institutional viability through significantly larger market capitalization ($450.9M vs $464.9K), approximately 50x higher daily trading volume enabling efficient large-position execution, and established 9-year operational history since 2017 providing regulatory clarity and technical track record. These factors reduce institutional barriers including liquidity constraints, compliance concerns, and operational risk assessment challenges that ETHS currently faces with its limited market depth and relatively nascent development stage.
Q8: What macroeconomic factors should investors monitor when comparing these assets?
Both assets respond to broader cryptocurrency market cycles influenced by monetary policy shifts, particularly interest rate adjustments and US dollar strength affecting crypto capital flows. Regulatory developments across jurisdictions impact both assets differently based on their technical classifications and use cases. Inflationary environments may drive crypto adoption, though the magnitude of impact depends on ecosystem development maturity, institutional adoption rates, and utility expansion. Geopolitical factors affecting cross-border transaction demand may influence adoption patterns, with XTZ's established presence potentially providing advantages in regulatory acceptance and integration timelines.
Share
Content
Introduction: Investment Comparison Between ETHS and XTZ
I. Historical Price Comparison and Current Market Status
II. Core Factors Influencing ETHS vs XTZ Investment Value
III. 2026-2031 Price Forecast: ETHS vs XTZ
IV. Investment Strategy Comparison: ETHS vs XTZ
V. Potential Risk Comparison
VI. Conclusion: Which Is the Better Buy?
VII. FAQ
How to Buy Cryptocurrency


Trending Cryptocurrencies


XZXX: A Comprehensive Guide to the BRC-20 Meme Token in 2025

Survey Note: Detailed Analysis of the Best AI in 2025

Detailed Analysis of the Best 10 GameFi Projects to Play and Earn in 2025
Kaspa’s Journey: From BlockDAG Innovation to Market Buzz
Best Crypto Wallets 2025: How to Choose and Secure Your Digital Assets
Popular GameFi Games in 2025

What is an IOU in Crypto?

What is Consensus Mechanism and What Types of Consensus Systems Exist

Top 10 Enterprise Blockchain Solutions from Global Leaders

Comprehensive Guide to Leverage Trading

What is ROI? How to Calculate Return on Investment and What is a Good ROI?