GAIN vs APT: A Comprehensive Comparison of Advanced Persistent Threat Groups and Their Impact on Cybersecurity

Introduction: GAIN vs APT Investment Comparison
In the cryptocurrency market, the comparison between Griffin AI (GAIN) and Aptos (APT) presents a noteworthy case study for investors evaluating different crypto asset categories. These two projects differ substantially in market positioning, capitalization rankings, and technical approaches. Griffin AI (GAIN): Launched in 2025, this project positions itself as a no-code agent builder platform targeting the DeFi sector, with over 15,000 active agents deployed across multiple blockchain ecosystems. Aptos (APT): Introduced in October 2022, this project operates as a Layer 1 blockchain utilizing the Move programming language, focusing on security and scalability in blockchain infrastructure. This article examines historical price movements, supply mechanisms, ecosystem integrations, technical development, and market positioning to provide a comprehensive analysis of GAIN vs APT. The comparison aims to address key considerations for investors evaluating these two distinct approaches within the crypto asset landscape.
I. Historical Price Comparison and Current Market Status
Griffin AI (GAIN) and Aptos (APT) Historical Price Trends
-
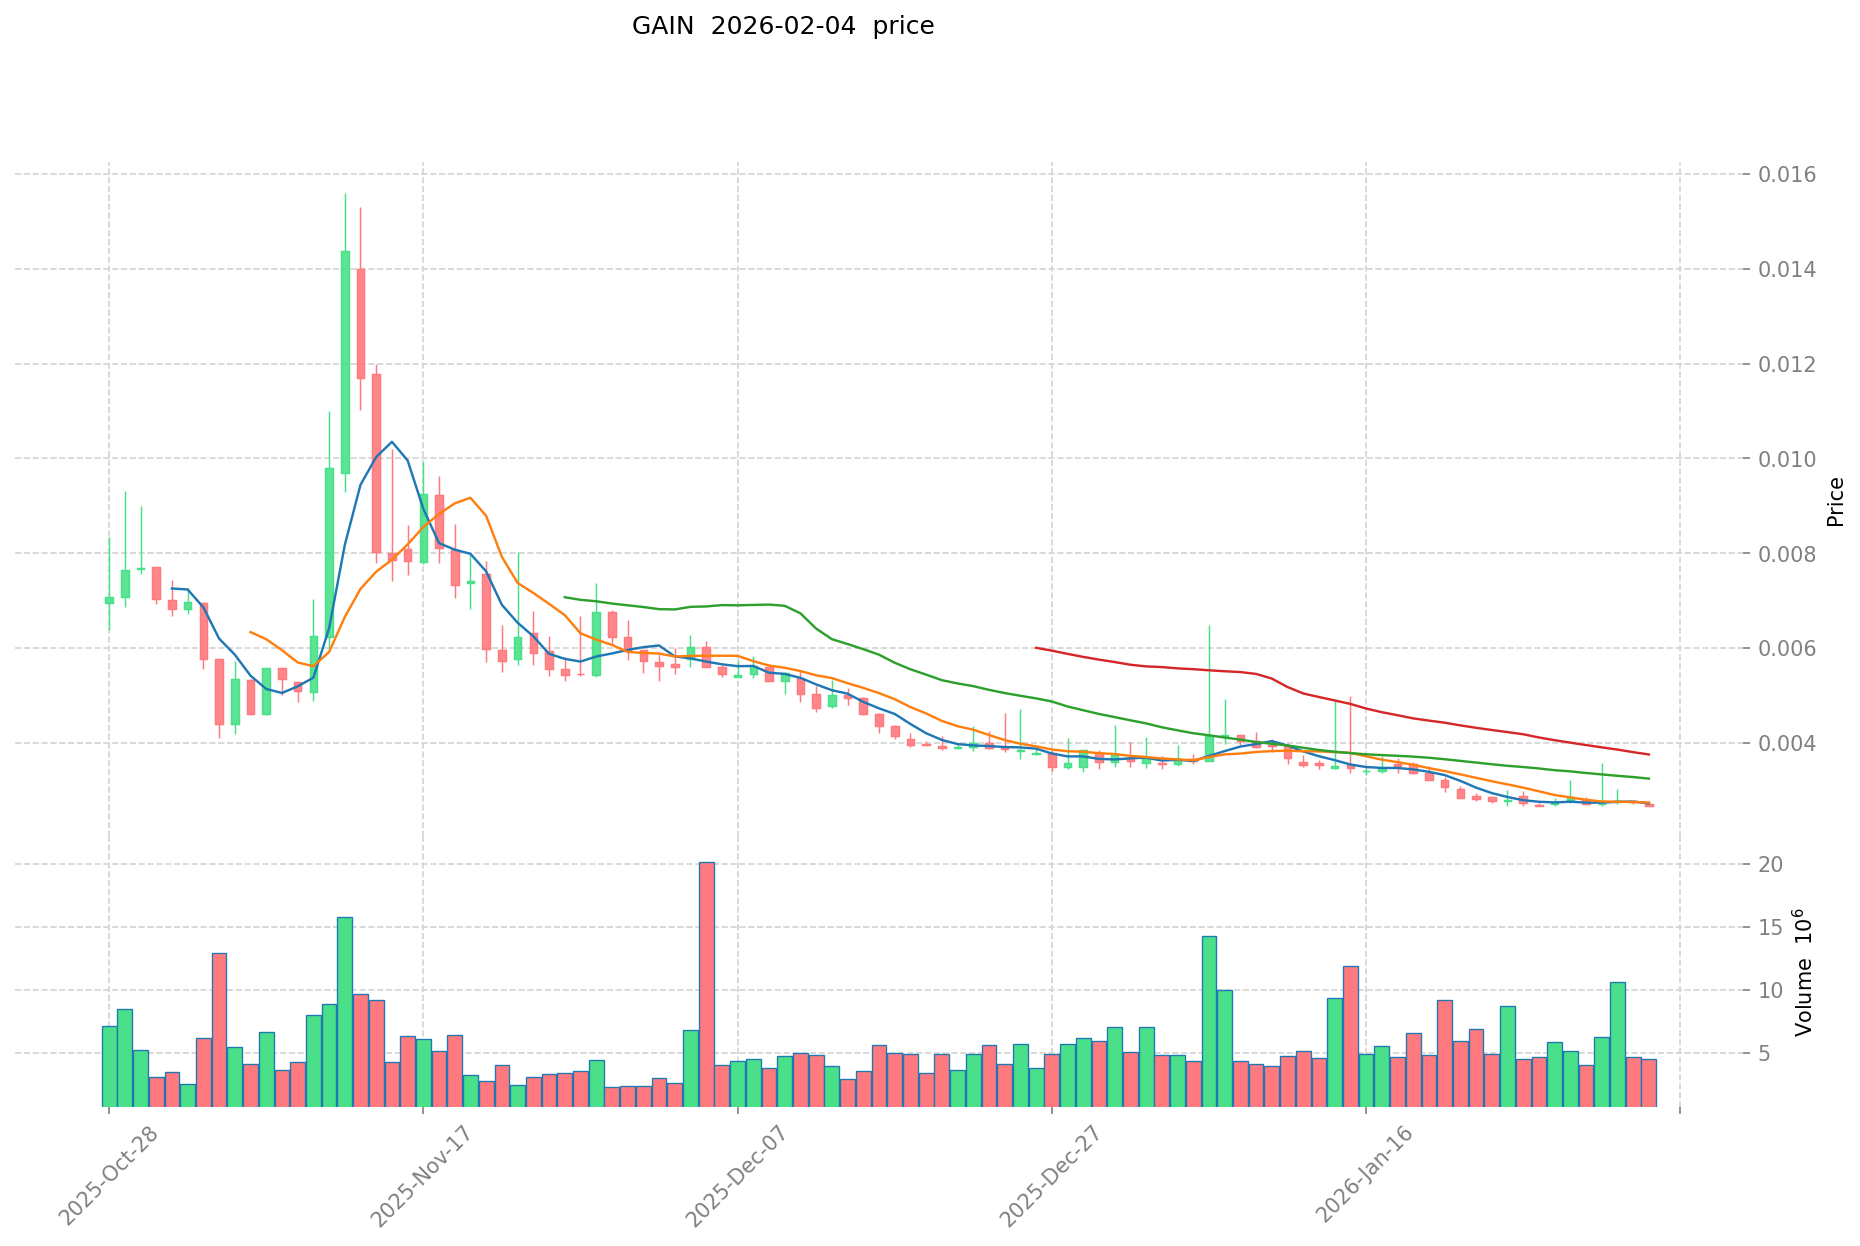
2025: Griffin AI (GAIN) launched on the market and reached a peak price of $0.24997 in September 2025, representing a period of initial market enthusiasm for the project's no-code agent builder platform for DeFi.
-
2023: Aptos (APT) experienced a notable price movement, reaching its all-time high of $19.92 in January 2023, driven by strong market interest in its high-performance Layer-1 blockchain capabilities.
-
2026: GAIN encountered significant price corrections, declining from its all-time high of $0.24997 to a historical low of $0.002676 in January 2026, reflecting a decline of approximately 98.93% from peak levels. During this same period, APT experienced substantial downward pressure, falling from its historical high to approximately $1.20 in February 2026, representing a decline of roughly 93.98% from its all-time high.
-
Comparative Analysis: During the 2025-2026 market cycle, GAIN demonstrated higher volatility with a more pronounced correction from its peak to trough compared to APT. While both assets experienced significant price retracements consistent with broader crypto market conditions, APT maintained a relatively larger market capitalization and trading volume base throughout the period.
Current Market Status (February 5, 2026)
- GAIN Current Price: $0.002725
- APT Current Price: $1.2214
- 24-Hour Trading Volume: GAIN recorded $13,468.51 compared to APT's $1,720,262.75, indicating substantially higher liquidity and market activity for APT.
- Market Sentiment Index (Fear & Greed Index): 14 (Extreme Fear), suggesting widespread caution and risk-averse behavior among crypto market participants.
- 24-Hour Price Movement: GAIN showed a modest increase of 1.03%, while APT declined by 0.65%.
- 7-Day Performance: GAIN decreased by 3.84%, while APT experienced a more significant decline of 23.99%.
- Market Capitalization: GAIN's circulating market cap stands at approximately $626,750, while APT maintains a substantially larger market cap of approximately $935.66 million.
View real-time prices:
- Check GAIN current price Market Price
- Check APT current price Market Price

II. Core Factors Influencing GAIN vs APT Investment Value
Supply Mechanism Comparison (Tokenomics)
Based on the Arbitrage Pricing Theory (APT) framework referenced in the materials, asset returns are influenced by multiple macroeconomic factors rather than single market risk alone. The APT model assumes markets operate under no-arbitrage equilibrium conditions, where pricing discrepancies are quickly eliminated through arbitrage activities.
- Multi-factor influence: APT suggests that asset valuations are driven by various systematic risk factors including inflation rates, interest rate changes, and GDP growth, which cannot be reduced through portfolio diversification.
- Risk factor sensitivity: Different assets exhibit varying degrees of sensitivity to these macroeconomic variables, measured through factor beta coefficients.
- 📌 Historical pattern: Asset pricing models demonstrate that equilibrium prices emerge through arbitrage mechanisms when market participants exploit pricing inefficiencies.
Institutional Adoption and Market Application
The materials reference investment strategies emphasizing competitive advantage through addressing overlooked market problems, though specific institutional holdings data for GAIN or APT was not detailed in the provided sources.
- Portfolio construction: APT framework enables investors to build diversified portfolios by identifying asset sensitivities to various factors, reducing exposure to specific risk dimensions.
- Performance attribution: The multi-factor approach allows for decomposing fund manager performance into contributions from different factors, providing more accurate capability assessment beyond simple benchmark comparisons.
Technical Development and Ecosystem Building
The APT model framework indicates that asset expected returns follow linear relationships with multiple factors:
- Factor model structure: E(Ri) = Rf + βi1F1 + βi2F2 + ..., where each factor's impact is measured by specific sensitivity coefficients.
- Systematic risk exposure: The model distinguishes between market-wide risks and asset-specific factors, including macroeconomic variables, industry-specific elements, and company-particular characteristics.
- Model limitations: Factor selection remains subjective in practical applications, and estimating factor betas and risk premiums requires complex statistical methods with potential estimation errors.
Macroeconomic Environment and Market Cycles
According to the APT framework outlined in the materials:
- Inflation sensitivity: Common macroeconomic factors used in expected return assessment include inflation rates, which represent systematic risks affecting asset valuations.
- Interest rate dynamics: Rate changes constitute a key risk factor in the multi-factor pricing model, influencing asset returns through their impact on discount rates and investment opportunity sets.
- Economic growth indicators: GDP growth represents another systematic factor affecting asset pricing, though the specific relationship varies based on individual asset characteristics and factor loadings.
- No-arbitrage equilibrium: The APT core assumption posits that when asset prices deviate from model predictions, investors engage in arbitrage transactions—simultaneously buying undervalued and selling overvalued assets—driving prices back to equilibrium levels.
III. 2026-2031 Price Forecast: GAIN vs APT
Short-term Forecast (2026)
- GAIN: Conservative $0.00158 - $0.00268 | Optimistic $0.00268 - $0.00357
- APT: Conservative $0.932 - $1.210 | Optimistic $1.210 - $1.501
Mid-term Forecast (2028-2029)
- GAIN may enter a gradual growth phase, with projected prices ranging from $0.00280 to $0.00533 in 2028, and $0.00392 to $0.00633 in 2029
- APT may enter a consolidation phase, with projected prices ranging from $1.420 to $1.640 in 2028, and $1.164 to $2.017 in 2029
- Key drivers: institutional capital inflows, ETF developments, ecosystem expansion
Long-term Forecast (2030-2031)
- GAIN: Baseline scenario $0.00337 - $0.00647 | Optimistic scenario $0.00517 - $0.00835
- APT: Baseline scenario $1.231 - $1.998 | Optimistic scenario $1.699 - $2.658
Disclaimer: Price predictions are based on historical data analysis and market trends. Cryptocurrency markets are highly volatile and subject to various unpredictable factors. These forecasts should not be considered as investment advice, and actual prices may differ significantly from projections.
GAIN:
| Year | Predicted High Price | Predicted Average Price | Predicted Low Price | Price Change |
|---|---|---|---|---|
| 2026 | 0.00356573 | 0.002681 | 0.00158179 | -1 |
| 2027 | 0.0044351783 | 0.003123365 | 0.0029984304 | 14 |
| 2028 | 0.0053287730265 | 0.00377927165 | 0.002796661021 | 38 |
| 2029 | 0.006330091050167 | 0.00455402233825 | 0.003916459210895 | 67 |
| 2030 | 0.007510038238008 | 0.005442056694208 | 0.005169953859498 | 99 |
| 2031 | 0.008354101231279 | 0.006476047466108 | 0.003367544682376 | 137 |
APT:
| Year | Predicted High Price | Predicted Average Price | Predicted Low Price | Price Change |
|---|---|---|---|---|
| 2026 | 1.500648 | 1.2102 | 0.931854 | 0 |
| 2027 | 1.57229184 | 1.355424 | 0.89457984 | 10 |
| 2028 | 1.6395208704 | 1.46385792 | 1.4199421824 | 19 |
| 2029 | 2.01719621376 | 1.5516893952 | 1.1637670464 | 27 |
| 2030 | 2.2127090775552 | 1.78444280448 | 1.2312655350912 | 46 |
| 2031 | 2.658106001553408 | 1.9985759410176 | 1.69878954986496 | 63 |
IV. Investment Strategy Comparison: GAIN vs APT
Long-term vs Short-term Investment Strategies
-
GAIN: May appeal to investors with higher risk tolerance who are interested in emerging DeFi infrastructure and no-code agent platforms. The asset's significant price volatility and lower liquidity suggest suitability for investors comfortable with speculative positions and willing to accept substantial price fluctuations.
-
APT: May appeal to investors seeking exposure to Layer 1 blockchain infrastructure with established market presence. The relatively larger market capitalization and trading volume indicate more developed market liquidity compared to GAIN, potentially attracting investors interested in blockchain scalability solutions.
Risk Management and Asset Allocation
-
Conservative Investors: A portfolio allocation approach might consider GAIN at 10-20% and APT at 80-90% of crypto holdings, reflecting APT's relatively larger market capitalization and established trading history. This allocation acknowledges the higher volatility characteristics observed in GAIN's price movements.
-
Aggressive Investors: A more balanced allocation might include GAIN at 40-50% and APT at 50-60%, allowing for exposure to both emerging DeFi platforms and established Layer 1 infrastructure. This approach accepts higher volatility in exchange for potential growth opportunities across different blockchain sectors.
-
Hedging Instruments: Risk management strategies may incorporate stablecoin allocations to maintain liquidity reserves, derivatives instruments for downside protection, and cross-asset portfolio construction to reduce concentration risk in individual tokens.
V. Potential Risk Comparison
Market Risk
-
GAIN: The token has demonstrated significant price volatility, with an observed decline of approximately 98.93% from its peak to trough during 2025-2026. The relatively low trading volume of $13,468.51 suggests limited market liquidity, which may amplify price movements during periods of buying or selling pressure.
-
APT: The token experienced a substantial price correction of approximately 93.98% from historical peak levels. Despite this volatility, APT maintains considerably higher trading volume at $1,720,262.75, indicating more developed market liquidity structures compared to GAIN. The 7-day performance showing a 23.99% decline reflects sensitivity to broader market conditions.
Technical Risk
-
GAIN: As a no-code agent builder platform for DeFi with over 15,000 deployed agents, the project faces technical challenges related to platform scalability, agent performance optimization, and cross-chain integration reliability. The relatively early stage of development since its 2025 launch introduces uncertainty regarding long-term technical architecture sustainability.
-
APT: Operating as a Layer 1 blockchain utilizing Move programming language, the platform encounters technical considerations including network throughput capacity, validator decentralization, and smart contract security. The project's focus on security and scalability requires ongoing technical development to maintain competitive positioning within the Layer 1 blockchain sector.
Regulatory Risk
- Global regulatory developments may impact both assets differently based on their respective use cases and technical implementations. DeFi-focused platforms like GAIN may face regulatory scrutiny related to decentralized financial services, automated trading systems, and cross-border transactions. Layer 1 blockchains such as APT may encounter regulatory considerations regarding network governance, validator operations, and compliance frameworks for blockchain infrastructure providers.
VI. Conclusion: Which Is the Better Buy?
📌 Investment Value Summary
-
GAIN Characteristics: The token represents exposure to no-code DeFi agent infrastructure with over 15,000 active deployments across multiple blockchain ecosystems. The asset's market capitalization of approximately $626,750 and significant historical volatility indicate an early-stage project profile with corresponding risk-return characteristics.
-
APT Characteristics: The token provides exposure to Layer 1 blockchain infrastructure with Move programming language implementation, emphasizing security and scalability. The substantially larger market capitalization of approximately $935.66 million and higher trading liquidity reflect more established market presence compared to GAIN.
✅ Investment Considerations
-
New Investors: Consider starting with tokens demonstrating larger market capitalizations and established trading liquidity before allocating to higher-volatility assets. Prioritize understanding fundamental blockchain concepts, market dynamics, and risk management principles.
-
Experienced Investors: Evaluate portfolio allocation based on risk tolerance, investment horizon, and conviction in specific blockchain sectors. Consider diversification across different market capitalization tiers and technical approaches within the crypto asset landscape.
-
Institutional Investors: Assess liquidity requirements, regulatory compliance frameworks, and due diligence processes when evaluating exposure to different market capitalization segments. Consider how each asset's characteristics align with portfolio construction objectives and risk management policies.
⚠️ Risk Disclosure: The cryptocurrency market exhibits substantial volatility and involves significant risks including potential loss of capital. This analysis does not constitute investment advice, financial recommendations, or solicitation to buy or sell any securities. Investors should conduct independent research and consult qualified financial advisors before making investment decisions.
VII. FAQ
Q1: What are the primary differences between GAIN and APT in terms of blockchain infrastructure?
GAIN operates as a no-code agent builder platform for DeFi with over 15,000 active agents deployed across multiple blockchain ecosystems, while APT functions as a Layer 1 blockchain utilizing the Move programming language with emphasis on security and scalability. GAIN focuses on enabling decentralized financial automation through accessible agent deployment tools, positioning itself within the DeFi infrastructure sector. In contrast, APT provides foundational blockchain infrastructure designed for high-performance transaction processing and smart contract execution. The technical architectures differ substantially: GAIN builds on top of existing blockchain networks to facilitate agent creation, whereas APT operates as an independent blockchain layer with its own consensus mechanism and programming environment.
Q2: How do the market capitalizations and liquidity profiles of GAIN and APT compare?
APT demonstrates significantly larger market presence with approximately $935.66 million market capitalization compared to GAIN's approximately $626,750. The 24-hour trading volumes reflect this disparity substantially, with APT recording $1,720,262.75 versus GAIN's $13,468.51. This difference indicates that APT maintains considerably deeper market liquidity and more developed trading infrastructure. The liquidity gap suggests that APT may experience less price impact from individual transactions and potentially lower bid-ask spreads. For investors, this liquidity differential implies that APT offers easier entry and exit points with reduced slippage risk, while GAIN's limited liquidity may result in higher transaction costs and greater price volatility during periods of concentrated buying or selling activity.
Q3: What were the peak-to-trough price corrections experienced by GAIN and APT?
GAIN experienced a decline of approximately 98.93% from its peak price of $0.24997 in September 2025 to its historical low of $0.002676 in January 2026, while APT declined approximately 93.98% from its all-time high of $19.92 in January 2023 to approximately $1.20 in February 2026. Both assets underwent substantial corrections reflecting broader cryptocurrency market conditions during their respective timeframes. GAIN's sharper percentage decline occurred within a compressed 4-month period following its 2025 launch, demonstrating the heightened volatility characteristic of newly introduced tokens. APT's correction unfolded over a longer three-year period from its 2023 peak, following typical patterns observed in established cryptocurrency assets during market downturns. These historical movements underscore the significant price risk inherent in both assets, though manifesting differently based on their distinct market maturity stages.
Q4: What factors influence the price forecasts for GAIN and APT through 2031?
Price projections consider multiple systematic factors including institutional capital flows, ecosystem expansion, regulatory developments, and broader macroeconomic conditions. For GAIN, the forecast ranges from conservative estimates of $0.00158-$0.00268 in 2026 to optimistic projections of $0.00517-$0.00835 by 2031, reflecting potential growth in DeFi agent adoption and platform development. For APT, projections span from conservative $0.932-$1.210 in 2026 to optimistic $1.699-$2.658 by 2031, incorporating factors such as Layer 1 blockchain competition, network utilization metrics, and validator ecosystem growth. Both forecasts account for cryptocurrency market cyclicality, technological advancement trajectories, and potential ETF developments. However, these projections carry substantial uncertainty given the high volatility demonstrated in historical price movements and the unpredictable nature of cryptocurrency market dynamics influenced by regulatory changes, technological disruptions, and shifting investor sentiment.
Q5: How should risk tolerance influence allocation decisions between GAIN and APT?
Conservative investors might consider allocation weighting of 10-20% GAIN and 80-90% APT within crypto holdings, prioritizing APT's larger market capitalization and established trading history. This approach acknowledges GAIN's higher volatility profile and limited liquidity, which may result in amplified price movements during market stress periods. Aggressive investors comfortable with higher risk exposure might adopt more balanced allocations of 40-50% GAIN and 50-60% APT, accepting increased volatility in exchange for potential growth opportunities across different blockchain sectors. Risk tolerance assessment should incorporate factors including investment horizon, portfolio diversification objectives, and capacity to withstand potential capital loss. The significant historical price corrections experienced by both assets—98.93% for GAIN and 93.98% for APT—demonstrate the substantial downside risk requiring careful consideration regardless of risk tolerance level.
Q6: What regulatory risks differentiate GAIN and APT as investment considerations?
GAIN faces regulatory scrutiny related to decentralized financial services, automated trading systems, and cross-border transaction frameworks given its positioning as a DeFi agent platform. Regulatory developments affecting decentralized finance protocols, algorithmic trading systems, and financial automation tools may impact GAIN's operational environment and market acceptance. APT encounters regulatory considerations specific to Layer 1 blockchain infrastructure, including network governance frameworks, validator operation requirements, and compliance standards for blockchain platform providers. The regulatory landscape for both assets remains evolving, with potential jurisdiction-specific approaches affecting different aspects of their technical implementations. Global regulatory coordination efforts regarding cryptocurrency classification, securities law applicability, and decentralized protocol oversight introduce uncertainty for both projects. Investors should monitor regulatory developments across major jurisdictions and assess how regulatory changes might impact each asset's use case viability and market accessibility.
Q7: What technical risks should investors evaluate when comparing GAIN and APT?
GAIN's technical risk profile encompasses platform scalability challenges, agent performance optimization requirements, and cross-chain integration reliability given its role coordinating over 15,000 deployed agents across multiple blockchain ecosystems. The relatively early development stage since its 2025 launch introduces uncertainty regarding long-term technical architecture sustainability and competitive differentiation as the no-code DeFi agent sector matures. APT's technical considerations include network throughput capacity maintenance, validator decentralization balance, and smart contract security within its Move programming environment. As a Layer 1 blockchain competing in an established infrastructure sector, APT must continuously develop technical capabilities to maintain competitive positioning against alternative Layer 1 platforms. Both assets face technical obsolescence risk from rapid blockchain technology evolution and potential security vulnerabilities inherent in complex distributed systems requiring ongoing auditing and protocol upgrades.
Q8: How do current market sentiment conditions affect GAIN and APT investment timing?
The current Fear & Greed Index reading of 14 (Extreme Fear) indicates widespread caution and risk-averse behavior among cryptocurrency market participants as of February 5, 2026. This sentiment environment historically correlates with depressed asset valuations and reduced trading activity across cryptocurrency markets. GAIN's modest 1.03% 24-hour increase contrasts with its 3.84% weekly decline, while APT's 0.65% daily decrease compounds to a more substantial 23.99% weekly drop, demonstrating continued selling pressure despite extreme fear conditions. Extreme fear readings have historically preceded market bottoms in cryptocurrency cycles, though timing recovery inflection points remains challenging given the unpredictable nature of sentiment shifts. Investors employing contrarian strategies might view extreme fear conditions as potential accumulation opportunities, while momentum-focused approaches may await confirmation of sentiment improvement before establishing positions. The divergent short-term performance between GAIN and APT during this sentiment environment suggests asset-specific factors operating beyond broad market sentiment dynamics.
Share
Content
Introduction: GAIN vs APT Investment Comparison
I. Historical Price Comparison and Current Market Status
II. Core Factors Influencing GAIN vs APT Investment Value
III. 2026-2031 Price Forecast: GAIN vs APT
IV. Investment Strategy Comparison: GAIN vs APT
V. Potential Risk Comparison
VI. Conclusion: Which Is the Better Buy?
VII. FAQ
How to Buy Cryptocurrency


Trending Cryptocurrencies


What will be the market capitalization of USDC in 2025? Analysis of the stablecoin market landscape.

How is DeFi different from Bitcoin?

What is DeFi: Understanding Decentralized Finance in 2025

USDC stablecoin 2025 Latest Analysis: Principles, Advantages, and Web3 Eco-Applications
Development of Decentralized Finance Ecosystem in 2025: Integration of Decentralized Finance Applications with Web3

2025 USDT USD Complete Guide: A Must-Read for Newbie Investors

Comprehensive Guide to Trading Systems

What Does DYOR Mean in Crypto?

How to Profit from Investing in Esports — A Comprehensive Guide

Comprehensive Guide to Fiat Currency
What is mobile mining, and can you earn money with it?