GET vs SAND: A Comprehensive Comparison of Two Essential Web Development Concepts
Introduction: Investment Comparison Between GET and SAND
In the cryptocurrency market, the comparison between GET vs SAND has consistently been a topic that investors cannot overlook. The two differ significantly in market capitalization ranking, application scenarios, and price performance, representing distinct crypto asset positioning.
GET (Global Entertainment Token): Launched in 2025, it has gained market recognition with its positioning as a universal currency for the global entertainment industry.
SAND (Sandbox): Since its launch in 2020, it has been recognized as a virtual gaming world platform, ranking among the cryptocurrencies with substantial trading volume and market presence.
This article will comprehensively analyze the investment value comparison of GET vs SAND around historical price trends, supply mechanisms, institutional adoption, technical ecosystems, and future predictions, attempting to answer the question that investors care most about:
"Which is the better buy right now?"
I. Historical Price Comparison and Current Market Status
GET (Coin A) and SAND (Coin B) Historical Price Trends
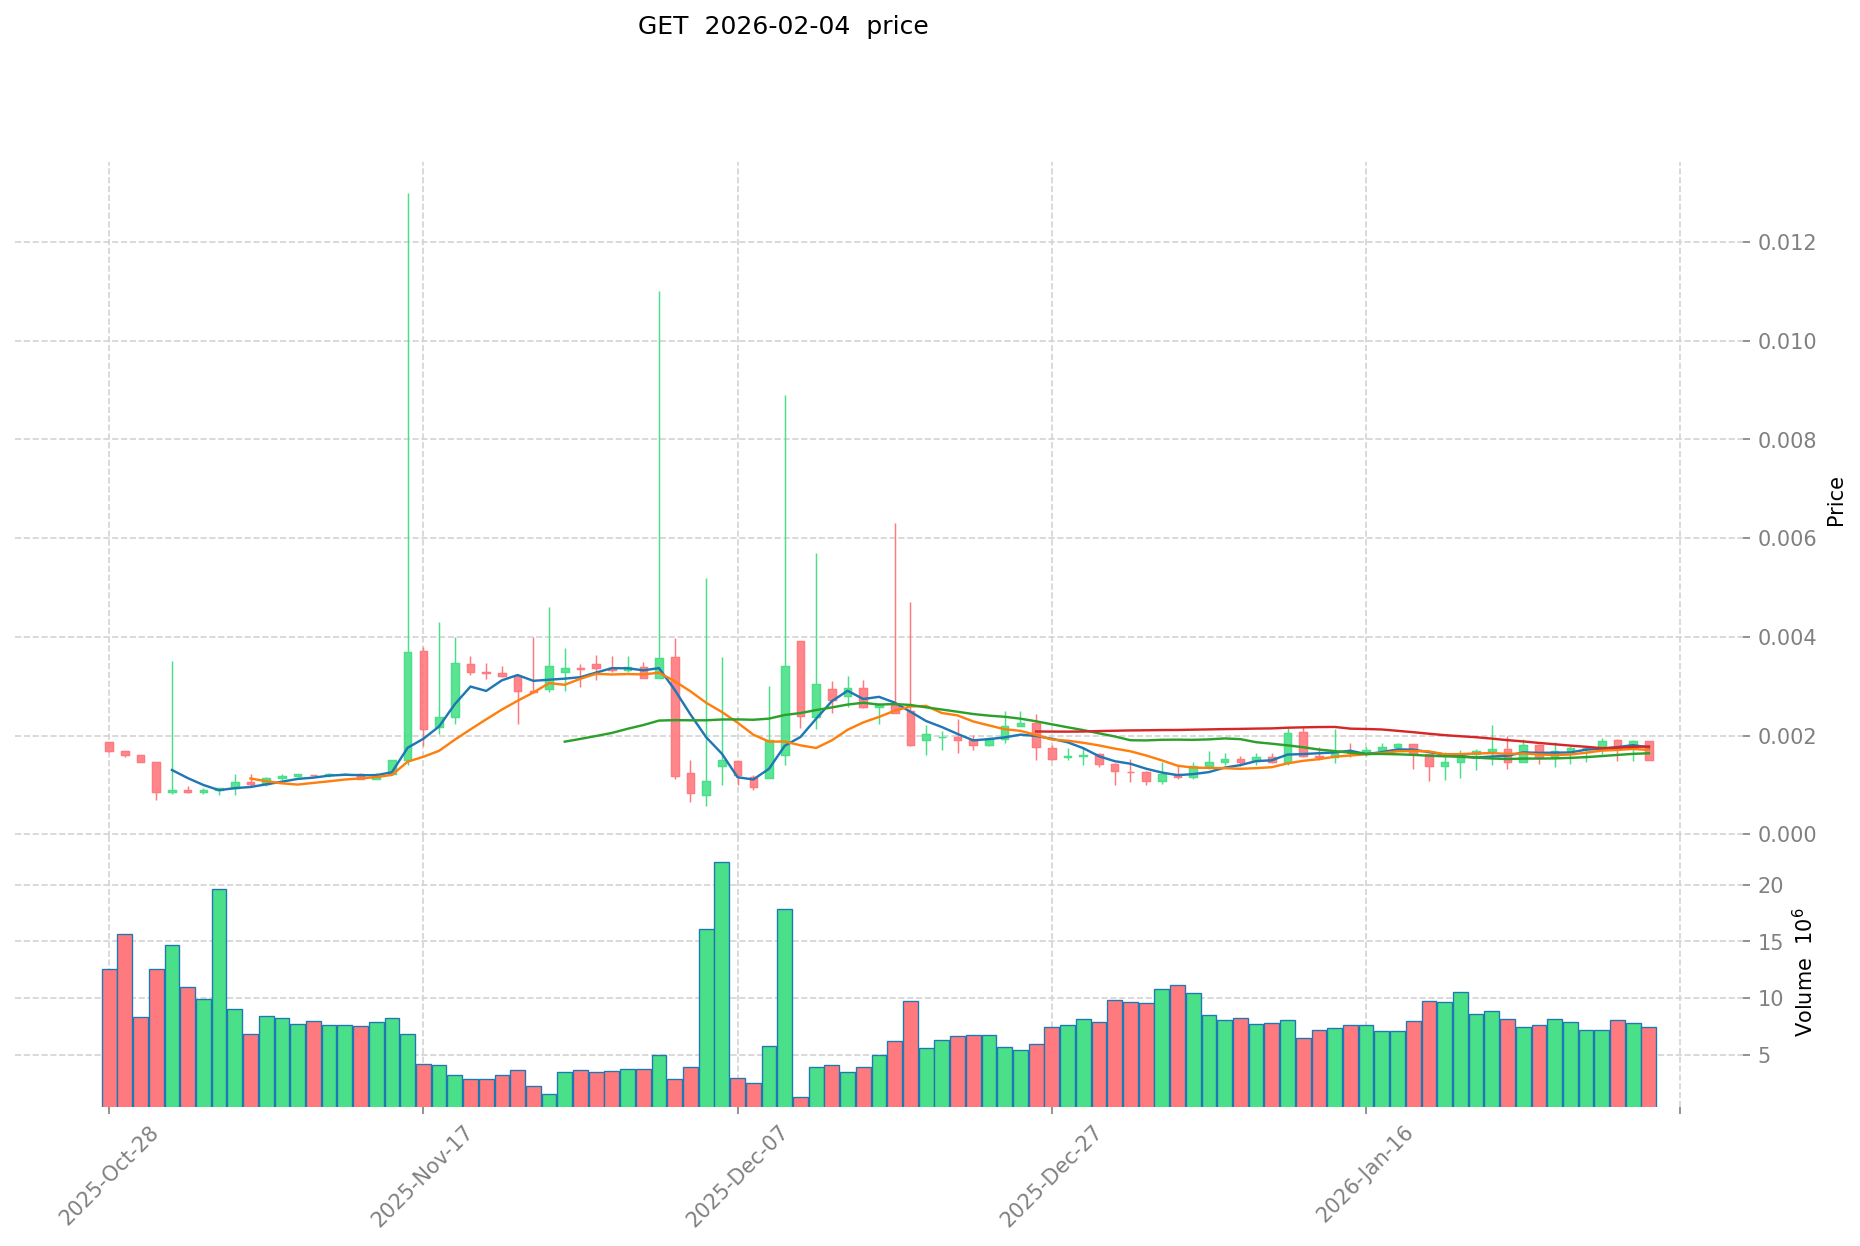
- 2025: GET experienced a price increase following its launch, with the token reaching a recorded high of $0.0336 on May 14, 2025.
- 2021: SAND was influenced by the NFT and metaverse boom, with its price reaching $8.4 on November 25, 2021.
- Comparative Analysis: During different market cycles, GET declined from its high of $0.0336 to a low of $0.0005705 (recorded on December 5, 2025), while SAND experienced a decline from its peak of $8.4 to a low of $0.02897764 (recorded on November 4, 2020).
Current Market Situation (2026-02-04)
- GET Current Price: $0.0014465
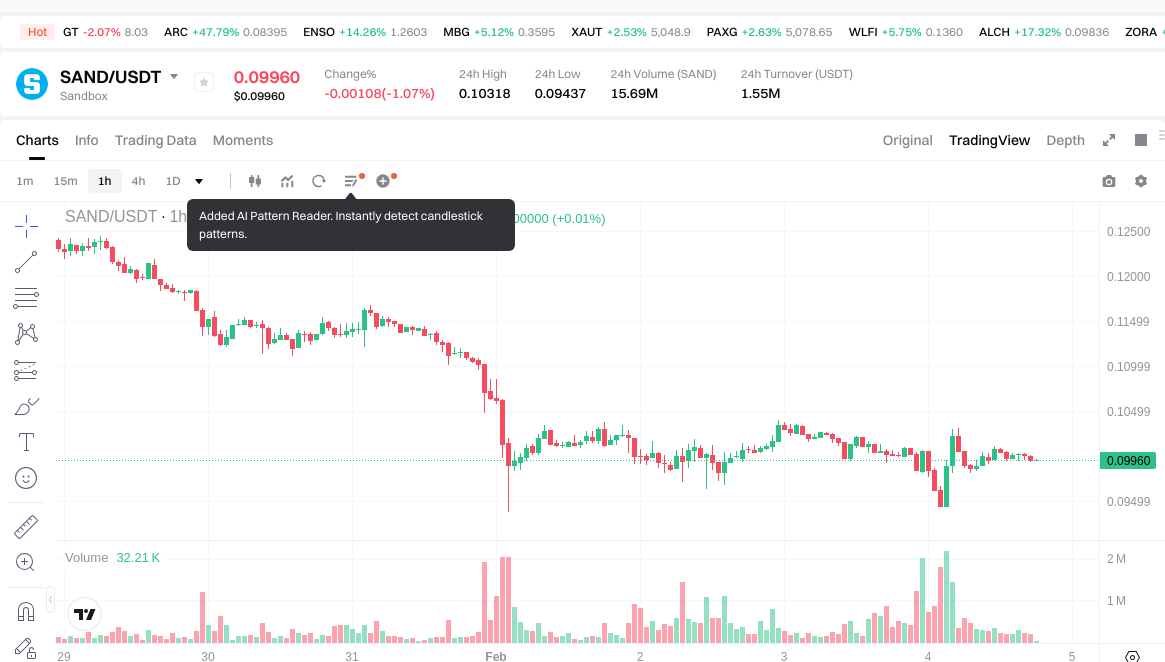
- SAND Current Price: $0.09963
- 24-Hour Trading Volume: GET $12,681.82 vs SAND $1,562,196.45
- Market Sentiment Index (Fear & Greed Index): 14 (Extreme Fear)
Click to view real-time prices:
- View GET current price Market Price
- View SAND current price Market Price
II. Core Factors Influencing GET vs SAND Investment Value
Supply Mechanism Comparison (Tokenomics)
-
GET: The supply mechanism details are not publicly disclosed in available materials. The token distribution and emission schedule require further investigation through official project documentation.
-
SAND: Token supply information is not comprehensively provided in the reference materials. Standard metaverse token economics typically involve ecosystem rewards and staking mechanisms.
-
📌 Historical Pattern: Supply mechanisms can create cyclical price dynamics through scarcity effects and predictable emission schedules, though specific historical data for these tokens requires additional research.
Institutional Adoption and Market Application
-
Institutional Holdings: Current institutional preference between GET and SAND is not documented in available materials. Market data platforms may provide updated institutional positioning.
-
Enterprise Adoption: Comparative analysis of GET and SAND in cross-border payments, settlement systems, and investment portfolios is not available in the provided sources. Both projects target different market segments that may attract varying institutional interest.
-
National Policies: Regulatory attitudes toward these specific tokens across different jurisdictions are not detailed in reference materials. General cryptocurrency regulatory trends continue to evolve globally.
Technology Development and Ecosystem Building
-
GET Technology Upgrades: Specific technical developments and their potential market impact are not detailed in available documentation.
-
SAND Technology Development: Technical roadmap and upgrade plans are not comprehensively covered in reference materials.
-
Ecosystem Comparison: The comparative presence of GET and SAND within DeFi protocols, NFT marketplaces, payment systems, and smart contract implementations is not documented in provided sources. Each project operates within distinct ecosystem frameworks.
Macroeconomic Factors and Market Cycles
-
Performance in Inflationary Environments: Comparative anti-inflation characteristics between GET and SAND are not analyzed in available materials. Digital asset behavior during inflationary periods varies based on multiple market factors.
-
Macroeconomic Monetary Policy: The specific impact of interest rate changes and US Dollar Index movements on these tokens is not quantified in reference sources. Both may respond to broader cryptocurrency market trends.
-
Geopolitical Factors: Cross-border transaction demand and international situations affecting GET and SAND adoption are not detailed in provided materials. Geopolitical developments can influence overall cryptocurrency market sentiment.
III. 2026-2031 Price Forecast: GET vs SAND
Short-term Forecast (2026)
- GET: Conservative $0.001086 - $0.001508 | Optimistic $0.001508 - $0.002216
- SAND: Conservative $0.0756 - $0.0995 | Optimistic $0.0995 - $0.1304
Mid-term Forecast (2028-2029)
- GET may enter a gradual growth phase, with estimated price range of $0.001456 - $0.003271
- SAND may enter a consolidation phase, with estimated price range of $0.1040 - $0.1943
- Key drivers: institutional capital inflows, ETF developments, ecosystem expansion
Long-term Forecast (2030-2031)
- GET: Baseline scenario $0.001580 - $0.003564 | Optimistic scenario $0.002352 - $0.004775
- SAND: Baseline scenario $0.1518 - $0.2075 | Optimistic scenario $0.1598 - $0.2656
Disclaimer
GET:
| Year | Predicted High Price | Predicted Average Price | Predicted Low Price | Price Change |
|---|---|---|---|---|
| 2026 | 0.002216466 | 0.0015078 | 0.001085616 | 4 |
| 2027 | 0.00258836487 | 0.001862133 | 0.00173178369 | 28 |
| 2028 | 0.00327111593445 | 0.002225248935 | 0.00162443172255 | 53 |
| 2029 | 0.003215373448628 | 0.002748182434725 | 0.001456536690404 | 89 |
| 2030 | 0.00414467133893 | 0.002981777941676 | 0.001580342309088 | 106 |
| 2031 | 0.004774721018006 | 0.003563224640303 | 0.0023517282626 | 146 |
SAND:
| Year | Predicted High Price | Predicted Average Price | Predicted Low Price | Price Change |
|---|---|---|---|---|
| 2026 | 0.1303712 | 0.09952 | 0.0756352 | 0 |
| 2027 | 0.13793472 | 0.1149456 | 0.088508112 | 15 |
| 2028 | 0.1795450272 | 0.12644016 | 0.1049453328 | 26 |
| 2029 | 0.194300593872 | 0.1529925936 | 0.104034963648 | 53 |
| 2030 | 0.24136876529304 | 0.173646593736 | 0.15975486623712 | 74 |
| 2031 | 0.265609829778585 | 0.20750767951452 | 0.151480606045599 | 108 |
IV. Investment Strategy Comparison: GET vs SAND
Long-term vs Short-term Investment Strategies
-
GET: May suit investors interested in emerging entertainment industry applications and early-stage ecosystem participation. The token's current development phase presents characteristics associated with higher volatility and growth-oriented positioning.
-
SAND: May appeal to investors seeking exposure to established metaverse and virtual gaming platforms. The token has demonstrated market presence since 2020, potentially offering comparatively mature ecosystem dynamics.
Risk Management and Asset Allocation
-
Conservative Investors: A balanced approach might consider GET: 20-30% vs SAND: 30-40%, with remaining allocation to established cryptocurrencies and stablecoins to manage volatility exposure.
-
Aggressive Investors: A growth-focused portfolio might allocate GET: 40-50% vs SAND: 30-40%, acknowledging higher risk tolerance for emerging market segments.
-
Hedging Tools: Portfolio risk management may incorporate stablecoin allocations (20-30%), options strategies for downside protection, and cross-asset diversification across different cryptocurrency sectors.
V. Potential Risk Comparison
Market Risks
-
GET: Trading volume data shows $12,681.82 in 24-hour activity, indicating relatively lower liquidity conditions. The token experienced significant price movement from $0.0336 to $0.0005705 during 2025, demonstrating substantial volatility characteristics. Current market sentiment (Fear & Greed Index: 14) reflects broader risk-averse conditions.
-
SAND: With 24-hour trading volume of $1,562,196.45, the token demonstrates comparatively higher liquidity. Historical price movement from $8.4 to $0.02897764 illustrates notable volatility patterns common to metaverse-focused assets. Market dynamics remain subject to broader cryptocurrency sector trends.
Technical Risks
-
GET: Specific technical infrastructure details, including scalability solutions and network stability parameters, are not comprehensively documented in available materials. Investors should conduct independent research regarding technical development roadmaps.
-
SAND: Technical architecture considerations, including network capacity and security framework details, require further investigation through official project documentation. Platform stability and upgrade mechanisms warrant evaluation for long-term investment decisions.
Regulatory Risks
- Global regulatory frameworks continue to evolve across different jurisdictions, with varying approaches to digital asset classification and oversight. Both GET and SAND may experience distinct regulatory impacts based on their respective application areas (entertainment industry vs virtual gaming platforms). Investors should monitor regulatory developments in key markets and assess potential compliance implications for each project.
VI. Conclusion: Which Is the Better Buy?
📌 Investment Value Summary:
-
GET Characteristics: Positioned in the entertainment industry sector with a launch in 2025, presenting early-stage ecosystem development dynamics. Current price of $0.0014465 with conservative 2026 forecasts ranging $0.001086-$0.001508 and optimistic scenarios at $0.001508-$0.002216. Lower trading volume may present both higher volatility and potential growth opportunities.
-
SAND Characteristics: Established presence in the metaverse and virtual gaming sector since 2020, with current price at $0.09963. Conservative 2026 forecasts indicate $0.0756-$0.0995 range, with optimistic scenarios at $0.0995-$0.1304. Higher liquidity and market recognition may offer comparatively mature market dynamics.
✅ Investment Considerations:
-
Novice Investors: May benefit from starting with smaller allocations to understand market dynamics. Consider beginning with SAND's comparatively higher liquidity while researching GET's ecosystem development. Portfolio diversification across established cryptocurrencies and stablecoins remains advisable.
-
Experienced Investors: May evaluate GET for early-stage entertainment sector exposure while considering SAND for metaverse ecosystem participation. Active monitoring of project developments, trading volume trends, and ecosystem expansion can inform position adjustments. Risk management through position sizing and diversification strategies remains essential.
-
Institutional Investors: May conduct comprehensive due diligence on both projects' technical infrastructure, regulatory compliance frameworks, and long-term ecosystem viability. Allocation decisions should align with institutional risk parameters, liquidity requirements, and investment mandates.
⚠️ Risk Disclosure: Cryptocurrency markets exhibit high volatility. This analysis does not constitute investment advice. Investors should conduct independent research, assess personal risk tolerance, and consult financial advisors before making investment decisions. Past performance does not indicate future results.
VII. FAQ
Q1: What are the main differences between GET and SAND in terms of market positioning?
GET positions itself as a universal currency for the global entertainment industry (launched in 2025), while SAND operates as a virtual gaming world platform within the metaverse sector (launched in 2020). GET targets entertainment industry applications with a current price of $0.0014465 and lower trading volume ($12,681.82 in 24 hours), representing an early-stage ecosystem. SAND focuses on virtual gaming and metaverse experiences with a current price of $0.09963 and significantly higher liquidity ($1,562,196.45 in 24-hour trading volume), reflecting a more established market presence.
Q2: Which token shows better liquidity characteristics for trading purposes?
SAND demonstrates substantially better liquidity with 24-hour trading volume of $1,562,196.45 compared to GET's $12,681.82. This approximately 123x difference in trading volume indicates that SAND offers easier entry and exit opportunities, tighter bid-ask spreads, and reduced slippage risk for investors. GET's lower liquidity may present challenges for larger position sizes but could offer higher volatility opportunities for traders comfortable with less liquid markets.
Q3: How do the price forecasts compare between GET and SAND for 2026?
For 2026, GET shows conservative forecasts of $0.001086-$0.001508 and optimistic scenarios of $0.001508-$0.002216, representing potential upside from its current $0.0014465 price. SAND's conservative 2026 forecast ranges from $0.0756-$0.0995, with optimistic scenarios at $0.0995-$0.1304, compared to its current $0.09963 price. In percentage terms, GET shows higher potential volatility and growth range, while SAND presents more moderate projected movements consistent with its established market position.
Q4: What are the key risk factors investors should consider when comparing GET and SAND?
GET's primary risks include lower liquidity ($12,681.82 daily volume), early-stage ecosystem development, and extreme price volatility (from $0.0336 to $0.0005705 in 2025). SAND faces risks related to metaverse sector sentiment, competition from other virtual world platforms, and historical volatility (from $8.4 to $0.02897764). Both tokens are subject to current market conditions reflected in the Fear & Greed Index of 14 (Extreme Fear), regulatory uncertainty across jurisdictions, and technical infrastructure considerations that require ongoing due diligence.
Q5: What portfolio allocation strategy might be appropriate for different investor types?
Conservative investors might consider GET: 20-30% and SAND: 30-40%, with remaining allocation to established cryptocurrencies and stablecoins for volatility management. Aggressive investors with higher risk tolerance might allocate GET: 40-50% and SAND: 30-40%, acknowledging exposure to emerging sectors. Both strategies should incorporate risk management tools including stablecoin allocations (20-30%), diversification across different cryptocurrency sectors, and position sizing aligned with personal risk tolerance. Novice investors should start with smaller allocations to understand market dynamics before increasing exposure.
Q6: How have GET and SAND performed historically during different market cycles?
GET launched in 2025 and reached a high of $0.0336 on May 14, 2025, before declining to $0.0005705 by December 5, 2025, demonstrating significant volatility in its initial market phase. SAND experienced its peak during the 2021 NFT and metaverse boom, reaching $8.4 on November 25, 2021, before declining to a low of $0.02897764 on November 4, 2020. These historical patterns indicate that SAND has experienced a full market cycle including bull and bear phases, while GET's track record remains limited to its recent launch period, making long-term performance comparison challenging.
Q7: What factors should investors monitor when deciding between GET and SAND investments?
Key monitoring factors include trading volume trends (GET's $12,681.82 vs SAND's $1,562,196.45 daily volumes), ecosystem development progress in their respective sectors (entertainment industry for GET, metaverse/gaming for SAND), regulatory developments affecting both entertainment and gaming tokens, technical infrastructure upgrades and network stability, institutional adoption patterns, and broader cryptocurrency market sentiment (currently at Fear & Greed Index of 14). Additionally, investors should track project-specific announcements, partnership developments, and user adoption metrics within each platform's ecosystem to inform ongoing investment decisions.
Q8: What are the long-term growth projections for GET versus SAND through 2031?
By 2031, GET shows baseline projections of $0.001580-$0.003564 with optimistic scenarios reaching $0.002352-$0.004775, representing a potential 146% increase from 2026 levels. SAND's 2031 baseline projections range from $0.1518-$0.2075 with optimistic scenarios at $0.1598-$0.2656, indicating a potential 108% increase from 2026 levels. These forecasts suggest that GET may offer higher percentage growth potential due to its early-stage positioning, while SAND presents more moderate but potentially more predictable growth trajectories consistent with an established metaverse platform. However, investors should note that longer-term forecasts carry increased uncertainty and should not be the sole basis for investment decisions.
Share
Content
Introduction: Investment Comparison Between GET and SAND
I. Historical Price Comparison and Current Market Status
II. Core Factors Influencing GET vs SAND Investment Value
III. 2026-2031 Price Forecast: GET vs SAND
IV. Investment Strategy Comparison: GET vs SAND
V. Potential Risk Comparison
VI. Conclusion: Which Is the Better Buy?
VII. FAQ
How to Buy Cryptocurrency


Trending Cryptocurrencies


XRP Price Analysis 2025: Market Trends and Investment Outlook

Treasure NFT Marketplace: A 2025 Guide for Web3 Gamers and Investors

Mastering the Crypto Fear and Greed Index: 2025 Trading Strategies

What Is the Best Crypto ETF in 2025: Top Performers and Beginner's Guide

What is SwissCheese (SWCH) and How Does It Democratize Investment?

What Is the Best AI Crypto in 2025?

Best Crypto Trading Bots for Automated Trading

Top 5 Tokens Recommended for DeFi Investment
What is Crypto? How to Explain Cryptocurrency to a Child
What Is a Crypto Scam? Common Fraud Schemes and How to Protect Yourself

How do derivatives market signals like funding rates and open interest predict crypto price movements in 2026?