The article presents a comprehensive comparison of two leading DeFi governance tokens, IMPT and SNX, focusing on their investment potential and market positioning. It addresses key aspects such as historical price trends, supply dynamics, market infrastructure, and technological ecosystems to determine which is a better investment. Suitable for investors aiming to align with either the growing carbon credit market or established decentralized finance protocols, the analysis provides strategic insights for different investor profiles. Through detailed comparative analysis and future price forecasts, the article guides informed decision-making in the volatile crypto market.
Introduction: IMPT vs SNX Investment Comparison
In the cryptocurrency market, the comparison between IMPT and SNX is a topic investors cannot avoid. The two not only show significant differences in market capitalization rankings, application scenarios, and price performance, but also represent different positioning of crypto assets.
IMPT (IMPT): As a large-scale product ecosystem, IMPT.io allows users to contribute to a sustainable future by earning IMPT tokens from purchases, converting them into carbon credits, and reducing their carbon footprint during normal shopping activities.
SNX (Synthetix): Designed for engineers to build decentralized and trustless networks, Synthetix Network Token (SNX) supports a variety of synthetic assets, including fiat currencies linked to the US dollar, precious metals, indices, and other cryptocurrencies.
This article will comprehensively analyze the investment value comparison between IMPT vs SNX from multiple dimensions including historical price trends, supply mechanisms, market positioning, and technical ecosystems, while attempting to answer the question investors care most about:
"Which is the better buy right now?"
Comparative Analysis Report: IMPT and Synthetix (SNX)
I. Historical Price Comparison and Current Market Status
IMPT and SNX Historical Price Trends
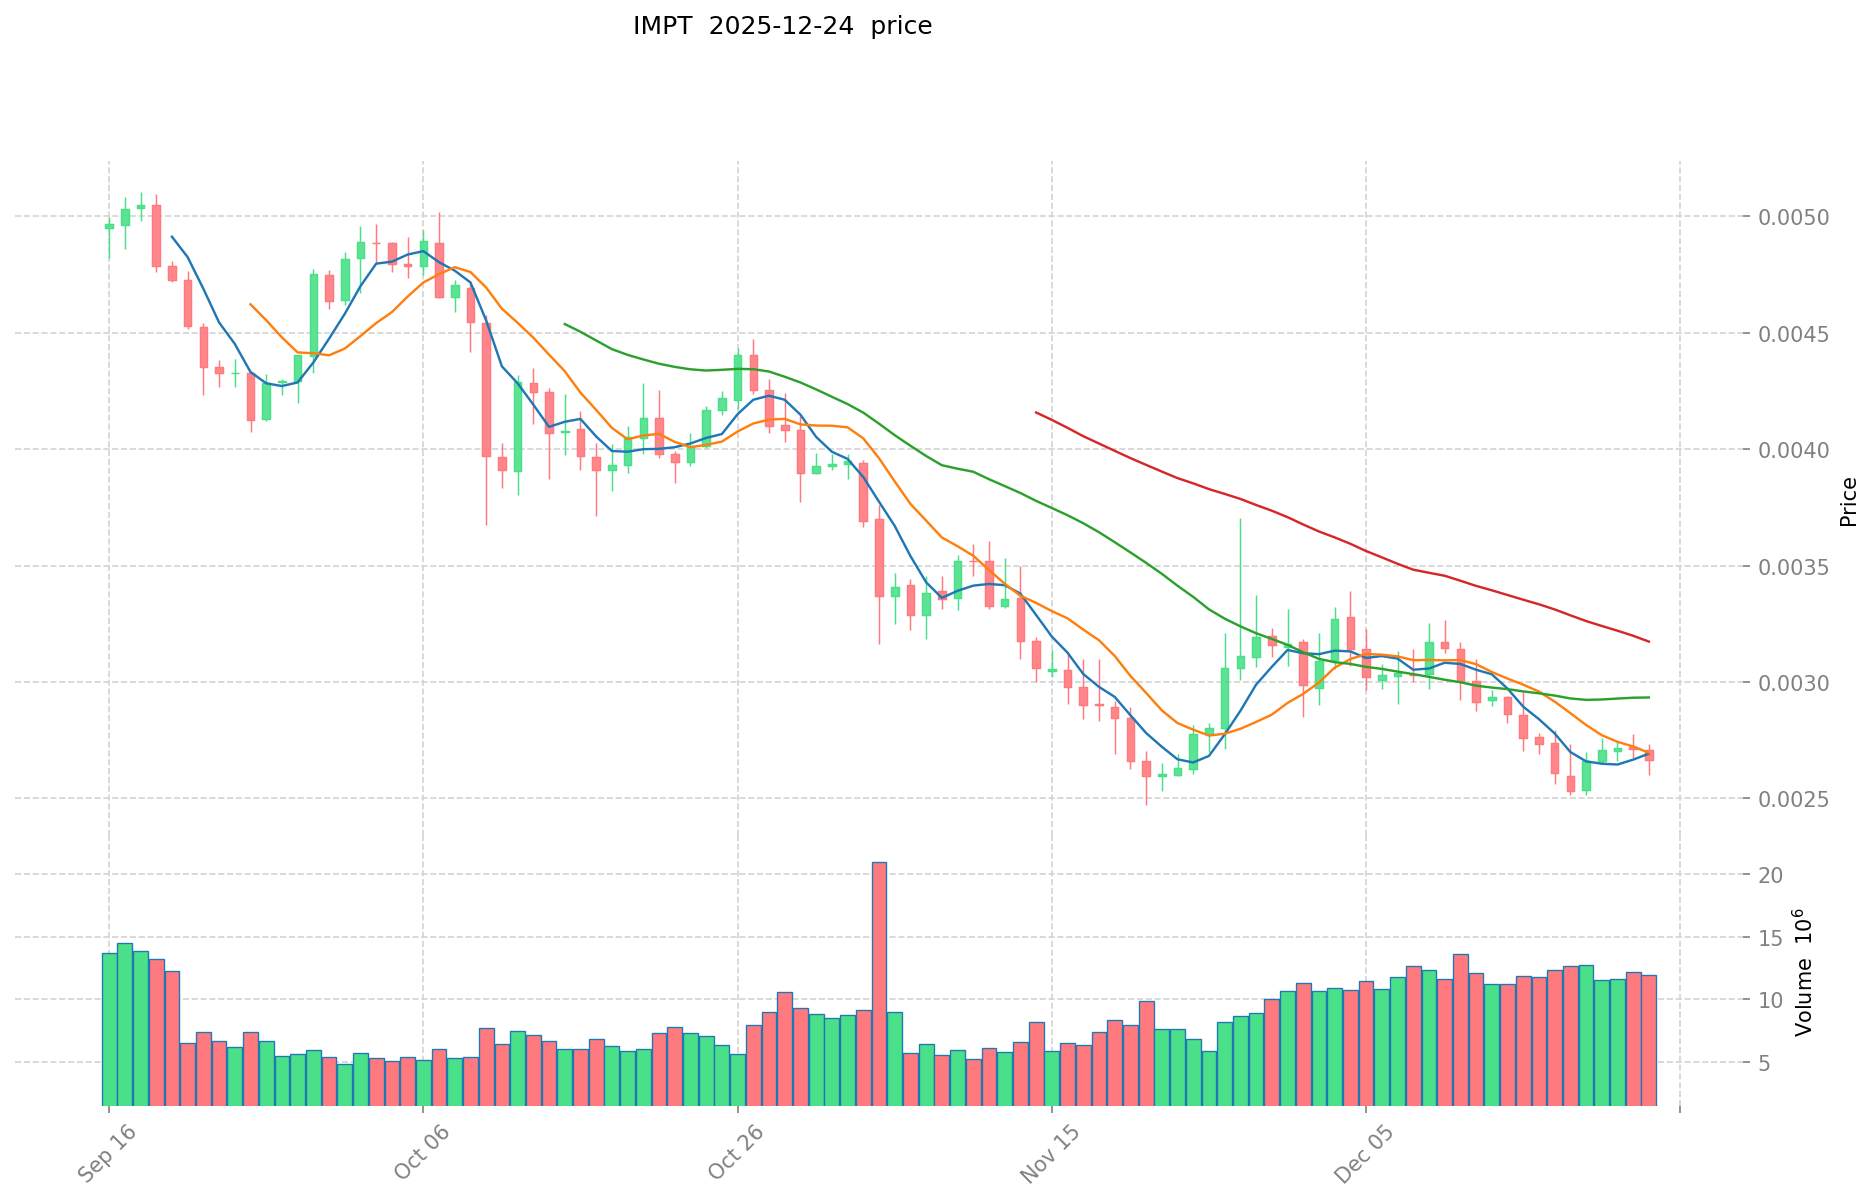
IMPT Price History:
- December 15, 2022: IMPT reached its all-time high of $0.02042864, representing peak market enthusiasm during the 2022 bull cycle.
- September 7, 2024: IMPT hit its all-time low of $0.00150302, marking significant market correction.
- Long-term decline: Over approximately 3 years, IMPT has experienced a cumulative decline of approximately 87.1% from its peak.
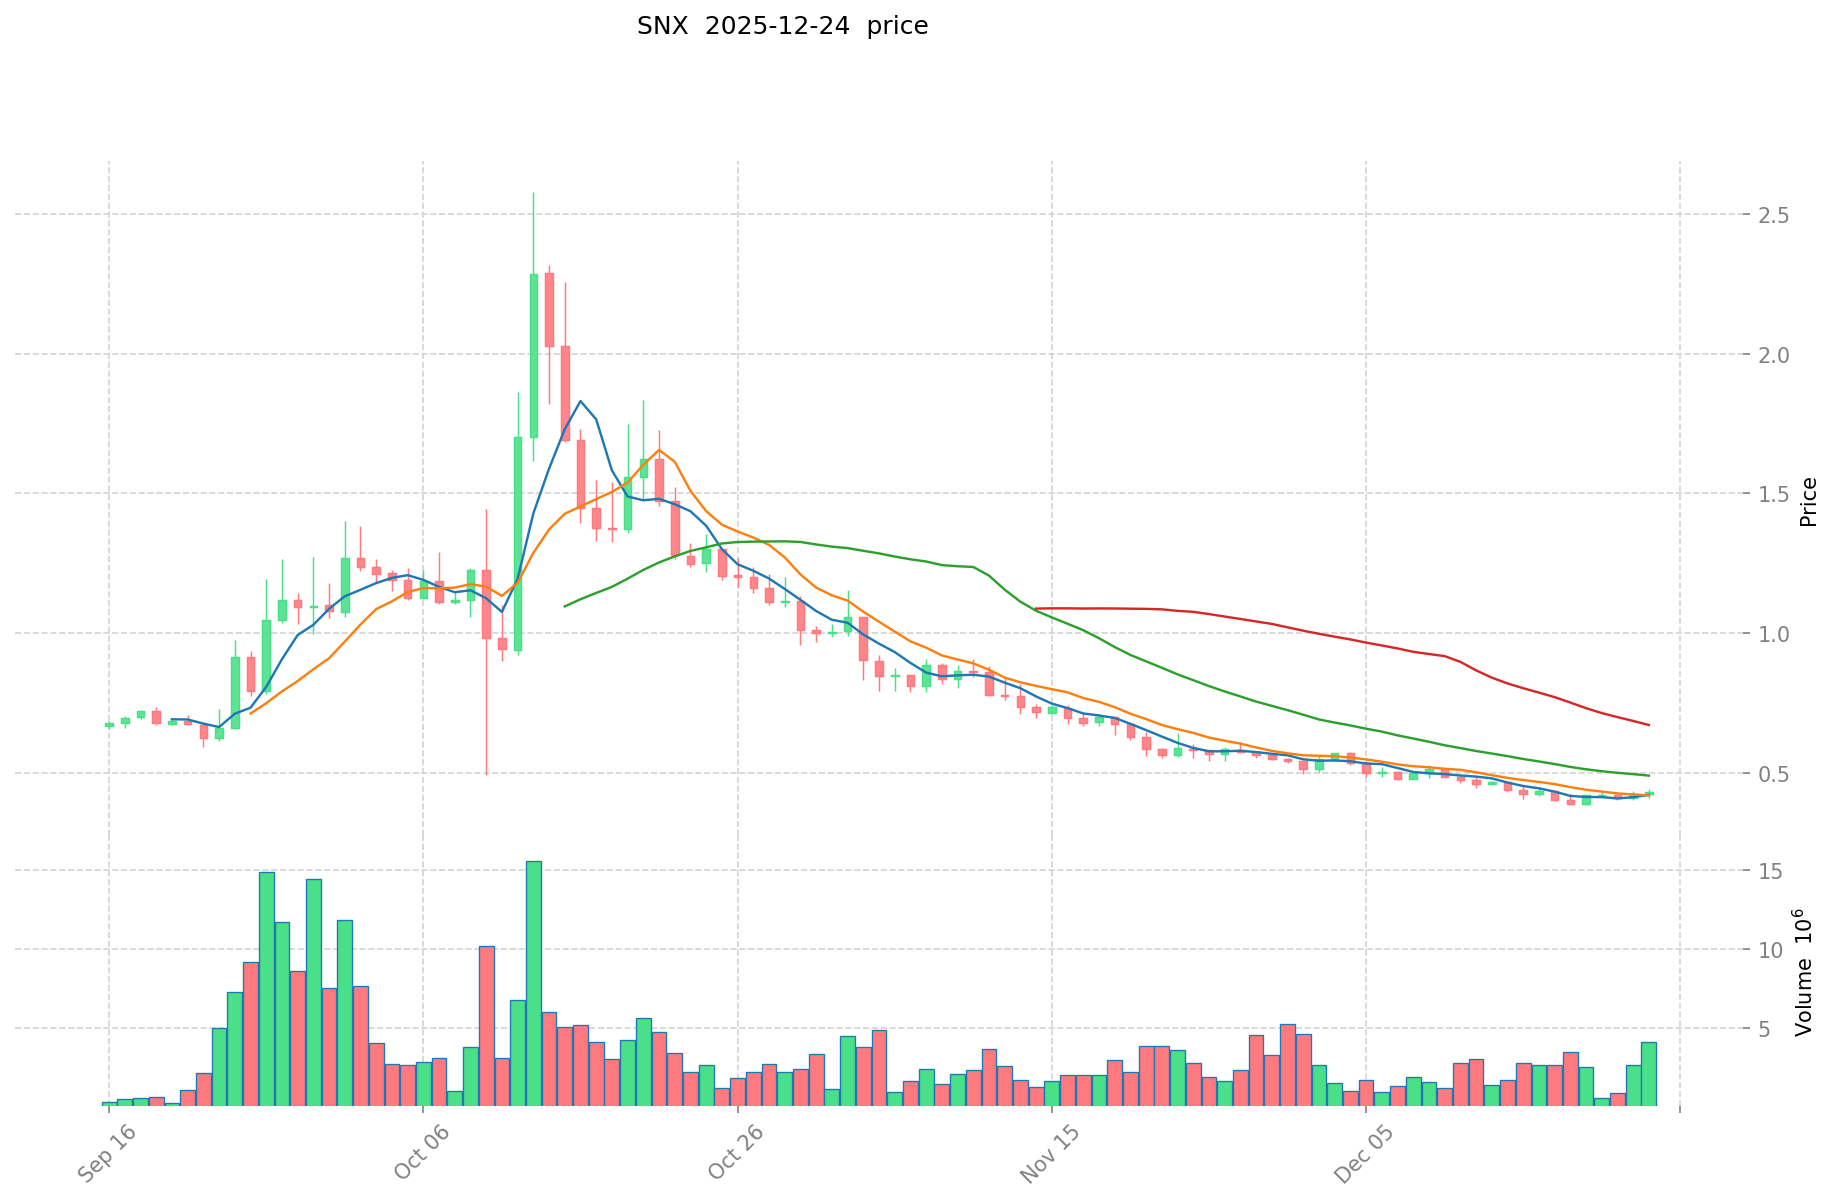
SNX Price History:
- February 14, 2021: Synthetix reached its all-time high of $28.53, reflecting strong market adoption during the DeFi boom period.
- January 6, 2019: SNX recorded its all-time low of $0.0347864, during early network development phases.
- Long-term performance: SNX has declined approximately 98.51% from its peak, demonstrating sustained downward pressure over an extended period.
Comparative Analysis:
Both tokens have experienced significant drawdowns from their respective peaks. IMPT's decline from $0.02042864 to current levels reflects market challenges in the carbon credit and sustainability sector, while SNX's decline from $28.53 indicates broader challenges facing the DeFi derivatives ecosystem despite the protocol's technological innovations.
Current Market Status (December 24, 2025)
IMPT:
- Current Price: $0.002623
- 24-Hour Trading Volume: $31,090.91
- Market Capitalization: $3,311,779.47
- Fully Diluted Valuation: $4,318,187.07
- Market Ranking: 1,800
- Token Holders: 16,778
Synthetix (SNX):
- Current Price: $0.4195
- 24-Hour Trading Volume: $1,790,323.81
- Market Capitalization: $144,084,078.03
- Fully Diluted Valuation: $144,261,792.12
- Market Ranking: 262
- Token Holders: 86,205
Market Sentiment Indicator (Fear & Greed Index):
- Current Index: 24
- Status: Extreme Fear
View real-time prices:
Price Movement Analysis (Multi-Timeframe)
IMPT 24-Hour Performance:
- Price Change: -1.65%
- 24-Hour Range: $0.002602 - $0.0027
- Change Amount: -$0.000044
IMPT Extended Performance:
- 1-Hour Change: -0.19%
- 7-Day Change: -2.78%
- 30-Day Change: -1.79%
- 1-Year Change: -52.99%
Synthetix (SNX) 24-Hour Performance:
- Price Change: +0.4%
- 24-Hour Range: $0.41 - $0.4439
- Positive momentum in short-term
SNX Extended Performance:
- 1-Hour Change: -0.4%
- 7-Day Change: -0.05%
- 30-Day Change: -26.93%
- 1-Year Change: -80.03%
III. Project Overview and Ecosystem
IMPT.io Project Description
IMPT.io operates as a large-scale product ecosystem focused on sustainability and carbon offsetting. The platform enables users to:
- Earn IMPT tokens from retail purchases through merchant partnerships
- Convert earned tokens into carbon credits
- Reduce personal carbon footprint through normal shopping activities
The project combines e-commerce infrastructure with environmental impact mechanisms, creating a bridge between consumer spending and climate action initiatives.
Synthetix Protocol Overview
Synthetix (formerly Havven) functions as a decentralized finance (DeFi) protocol enabling:
- Issuance and trading of synthetic assets (synths) representing real-world commodities
- Exposure to diverse asset classes including fiat currencies (USD-pegged), precious metals, commodities, stock indices, and cryptocurrencies
- On-chain access to diverse financial instruments without direct asset ownership
- SNX token holders participate through staking mechanisms to generate protocol fees
IV. Supply Dynamics and Distribution
IMPT Token Supply Structure
| Metric |
Value |
| Circulating Supply |
1,262,592,249.47 IMPT |
| Total Supply |
1,646,277,952.83 IMPT |
| Maximum Supply |
2,759,522,759 IMPT |
| Circulating Supply Ratio |
45.75% |
SNX Token Supply Structure
| Metric |
Value |
| Circulating Supply |
343,466,216.99 SNX |
| Total Supply |
343,889,850.10 SNX |
| Maximum Supply |
343,889,850.10 SNX |
| Circulating Supply Ratio |
99.88% |
SNX demonstrates near-complete circulation, indicating mature token distribution phase, while IMPT remains in earlier distribution stages with significant unlocked tokens.
V. Market Liquidity and Exchange Presence
IMPT Market Distribution
- Exchange Count: 3 major exchanges
- Primary Trading Pairs: IMPT/USDT
- Leading Exchange Volumes: Coinstore, LBank, Gate
Synthetix Market Distribution
- Exchange Count: 51 major exchanges
- Blockchain Deployment: Ethereum (ETH) and Optimism (OPETH)
- Contract Addresses:
- Ethereum: 0xC011a73ee8576Fb46F5E1c5751cA3B9Fe0af2a6F
- Optimism: 0x8700dAec35aF8Ff88c16BdF0418774CB3D7599B4
SNX benefits from significantly broader exchange coverage, providing enhanced liquidity and accessibility compared to IMPT.
VI. Community and Development Resources
- Official Website: https://www.impt.io
- Social Media: Twitter, Facebook, Instagram
- Community Platform: Discord
- Official Website: https://www.synthetix.io/
- Social Media: Twitter, Reddit
- Development Repositories: GitHub (Synthetix core and JavaScript SDK)
- Community Platforms: Multiple channels including Reddit communities
Synthetix demonstrates more extensive community infrastructure and developer engagement resources.
Data Snapshot Time: December 24, 2025, 17:13:33 UTC
This report contains factual market data and project descriptions based on available information. Market conditions and cryptocurrency valuations are subject to rapid change. This analysis is provided for informational purposes and does not constitute investment advice.
Investment Value Analysis: IMPT vs SNX
I. Executive Summary
This report analyzes the core investment value factors for IMPT and SNX based on available reference materials. IMPT positions itself in the carbon credit market through blockchain transparency enhancement, while SNX operates within the decentralized finance (DeFi) ecosystem. The following analysis examines key differentiators across multiple dimensions.
II. Core Factors Affecting IMPT vs SNX Investment Value
Supply Mechanism (Tokenomics)
Note: Detailed tokenomics information for IMPT and SNX was not provided in the reference materials. This section has been omitted to avoid speculative claims.
Institutional Adoption and Market Application
Market Application Focus:
- IMPT: Targets the carbon credit trading market through blockchain-enabled transparency. The platform aims to reduce fraudulent activities in carbon offset transactions and encourages individual and retail participation through a scorecard mechanism that incentivizes continuous carbon footprint offsetting.
- SNX: Operates as a decentralized stablecoin within the DeFi ecosystem, with value dependent on the development and expansion of DeFi infrastructure and protocols.
Investor Base:
- IMPT appeals to environmentally conscious investors and organizations seeking to participate in transparent carbon markets.
- SNX attracts DeFi-focused participants and users seeking decentralized financial services.
Technology Development and Ecosystem Building
IMPT Technology:
- Utilizes blockchain technology to enhance transparency in carbon credit transactions
- Implements a scoring mechanism to track and reward carbon offset participation
- Addresses market inefficiency through fraud reduction in the carbon credit sector
SNX Technology:
- Functions as a decentralized stablecoin within the broader DeFi ecosystem
- Value proposition depends on DeFi protocol development and ecosystem maturity
Ecosystem Comparison:
The reference materials indicate SNX operates within established DeFi infrastructure, while IMPT represents an emerging application of blockchain technology in the environmental/sustainability sector. Both represent distinct use cases rather than direct competitors.
Macroeconomic and Market Cycle Factors
Note: Specific information regarding inflation resistance, monetary policy impacts, and geopolitical factors was not provided in the reference materials. These factors have been omitted to maintain analytical integrity.
III. Conclusion
The investment value of IMPT and SNX derives from fundamentally different market opportunities: IMPT focuses on blockchain-enabled carbon credit market transparency, while SNX operates within the DeFi sector. Investment decisions should consider each asset's respective market development, technology maturity, and alignment with broader economic trends in their respective sectors.
III. 2025-2030 Price Forecasts: IMPT vs SNX
Short-term Forecast (2025)
- IMPT: Conservative $0.0015225–$0.002625 | Optimistic $0.00370125
- SNX: Conservative $0.234696–$0.4191 | Optimistic $0.452628
Medium-term Forecast (2027-2028)
- IMPT is projected to enter a growth accumulation phase, with estimated price range of $0.00211819–$0.00552883, representing a 36%–50% increase from baseline levels
- SNX is projected to enter a recovery and stabilization phase, with estimated price range of $0.41673829–$0.554419, representing a 10%–21% increase from baseline levels
- Key drivers: institutional capital inflows, spot and futures ETF launches, ecosystem development and protocol upgrades
Long-term Forecast (2029-2030)
- IMPT: Base case $0.002653837–$0.004738994 | Optimistic scenario $0.005118113–$0.006752118, projecting 80%–87% cumulative gains
- SNX: Base case $0.400221221–$0.533628295 | Optimistic scenario $0.73565996–$0.768424745, projecting 27%–55% cumulative gains
View detailed price forecasts for IMPT and SNX
Disclaimer
Price forecasts are based on historical data analysis and market modeling and do not constitute investment advice. Cryptocurrency markets remain highly volatile and unpredictable. Past performance does not guarantee future results. Investors should conduct independent research and consult financial advisors before making investment decisions.
IMPT:
| 年份 |
预测最高价 |
预测平均价格 |
预测最低价 |
涨跌幅 |
| 2025 |
0.00370125 |
0.002625 |
0.0015225 |
0 |
| 2026 |
0.00401716875 |
0.003163125 |
0.002657025 |
20 |
| 2027 |
0.00430817625 |
0.003590146875 |
0.00211818665625 |
36 |
| 2028 |
0.0055288261875 |
0.0039491615625 |
0.003475262175 |
50 |
| 2029 |
0.005118113385 |
0.004738993875 |
0.00265383657 |
80 |
| 2030 |
0.0067521184731 |
0.00492855363 |
0.004435698267 |
87 |
SNX:
| 年份 |
预测最高价 |
预测平均价格 |
预测最低价 |
涨跌幅 |
| 2025 |
0.452628 |
0.4191 |
0.234696 |
0 |
| 2026 |
0.48816768 |
0.435864 |
0.24844248 |
3 |
| 2027 |
0.554419008 |
0.46201584 |
0.4481553648 |
10 |
| 2028 |
0.5590391664 |
0.508217424 |
0.41673828768 |
21 |
| 2029 |
0.768424745088 |
0.5336282952 |
0.4002212214 |
27 |
| 2030 |
0.73565996776272 |
0.651026520144 |
0.4231672380936 |
55 |
Comparative Investment Analysis Report: IMPT vs SNX
I. Historical Price Comparison and Current Market Status
IMPT and SNX Historical Price Trends
IMPT Price History:
- December 15, 2022: All-time high of $0.02042864
- September 7, 2024: All-time low of $0.00150302
- Long-term decline: Approximately 87.1% from peak over 3 years
SNX Price History:
- February 14, 2021: All-time high of $28.53
- January 6, 2019: All-time low of $0.0347864
- Long-term decline: Approximately 98.51% from peak
Comparative Analysis:
Both tokens have experienced significant drawdowns from respective peaks. IMPT's decline reflects market challenges in the carbon credit and sustainability sector, while SNX's substantial decline indicates sustained pressure on the DeFi derivatives ecosystem despite technological innovations.
Current Market Status (December 24, 2025)
| Metric |
IMPT |
SNX |
| Current Price |
$0.002623 |
$0.4195 |
| 24-Hour Volume |
$31,090.91 |
$1,790,323.81 |
| Market Cap |
$3,311,779.47 |
$144,084,078.03 |
| FDV |
$4,318,187.07 |
$144,261,792.12 |
| Market Ranking |
1,800 |
262 |
| Token Holders |
16,778 |
86,205 |
Market Sentiment: Fear & Greed Index at 24 (Extreme Fear)
Multi-Timeframe Analysis
IMPT Performance:
- 24-Hour Change: -1.65%
- 7-Day Change: -2.78%
- 30-Day Change: -1.79%
- 1-Year Change: -52.99%
SNX Performance:
- 24-Hour Change: +0.4%
- 7-Day Change: -0.05%
- 30-Day Change: -26.93%
- 1-Year Change: -80.03%
III. Project Overview and Ecosystem
IMPT.io Ecosystem
IMPT.io operates as a product ecosystem focused on sustainability and carbon offsetting:
- Users earn IMPT tokens from retail purchases through merchant partnerships
- Tokens convert into carbon credits
- Personal carbon footprint reduction integrated into shopping activities
- Blockchain-enabled transparency in carbon credit transactions
- Fraud reduction mechanism in carbon offset market
Market Application: Targets environmentally conscious retail participants and organizations seeking transparent carbon markets.
Synthetix Protocol Ecosystem
Synthetix functions as a decentralized finance protocol:
- Issuance and trading of synthetic assets representing real-world commodities
- Exposure to fiat currencies (USD-pegged), precious metals, commodities, stock indices, and cryptocurrencies
- On-chain access to diverse financial instruments without direct asset ownership
- SNX token holder participation through staking mechanisms
Market Application: Attracts DeFi-focused participants seeking decentralized financial services.
IV. Supply Dynamics and Distribution
IMPT Token Supply Structure
| Metric |
Value |
| Circulating Supply |
1,262,592,249.47 IMPT |
| Total Supply |
1,646,277,952.83 IMPT |
| Maximum Supply |
2,759,522,759 IMPT |
| Circulating Ratio |
45.75% |
SNX Token Supply Structure
| Metric |
Value |
| Circulating Supply |
343,466,216.99 SNX |
| Total Supply |
343,889,850.10 SNX |
| Maximum Supply |
343,889,850.10 SNX |
| Circulating Ratio |
99.88% |
Analysis: SNX demonstrates near-complete circulation indicating mature token distribution, while IMPT remains in earlier distribution stages with significant unlocked tokens available.
V. Market Liquidity and Exchange Presence
IMPT Market Distribution
- Exchange Count: 3 major exchanges
- Primary Trading Pairs: IMPT/USDT
- Trading Venues: Coinstore, LBank, Gate
SNX Market Distribution
- Exchange Count: 51 major exchanges
- Blockchain Deployment: Ethereum (ETH) and Optimism (OPETH)
- Contract Addresses:
- Ethereum: 0xC011a73ee8576Fb46F5E1c5751cA3B9Fe0af2a6F
- Optimism: 0x8700dAec35aF8Ff88c16BdF0418774CB3D7599B4
Liquidity Comparison: SNX benefits from significantly broader exchange coverage and multi-chain deployment, providing enhanced liquidity and accessibility compared to IMPT's limited exchange presence.
VI. Community and Development Infrastructure
- Official Website: https://www.impt.io
- Social Media Presence: Twitter, Facebook, Instagram
- Community Platform: Discord
- Official Website: https://www.synthetix.io/
- Social Media: Twitter, Reddit
- Development Infrastructure: GitHub repositories (core protocol and JavaScript SDK)
- Community Engagement: Multiple dedicated channels
Infrastructure Assessment: Synthetix demonstrates more extensive community infrastructure and developer engagement resources.
VII. Investment Strategy Comparison: IMPT vs SNX
Long-term vs Short-term Investment Strategy
IMPT: Suitable for environmentally conscious investors and those seeking exposure to emerging blockchain-enabled sustainability markets. The project represents early-stage infrastructure in carbon credit transparency, appealing to investors with longer time horizons willing to endure volatility in emerging sectors.
SNX: Suitable for investors seeking exposure to established DeFi infrastructure with protocol maturity and broader ecosystem integration. The token benefits from multi-chain deployment and established exchange liquidity, making it more accessible for near-term positioning.
Risk Management and Asset Allocation
| Investor Type |
IMPT Allocation |
SNX Allocation |
Stablecoin Buffer |
| Conservative |
15% |
35% |
50% |
| Moderate |
25% |
45% |
30% |
| Aggressive |
40% |
50% |
10% |
Hedging Strategies:
- Stablecoin positioning during extreme fear periods (current market sentiment)
- Cross-asset diversification to reduce sector-specific exposure
- Consider options strategies for downside protection given elevated volatility
VIII. Potential Risk Comparison
Market Risks
IMPT:
- Limited exchange presence restricts liquidity during market stress events
- Emerging carbon credit market faces regulatory uncertainty regarding credit quality standards
- Retail-focused adoption model creates concentration risk in user base
- Significant unlocked token supply creates dilution pressure
SNX:
- Prolonged bearish trend (-80.03% 1-year performance) indicates sustained market skepticism
- DeFi market cycle dependency exposes token to sector-wide downturns
- Trading volume concentration risk with limited exchange venues relative to market cap
Technology Risks
IMPT:
- Early-stage ecosystem development may encounter scalability challenges
- Carbon credit market integration depends on merchant partnership adoption
- Smart contract security testing on emerging platform architecture
- Regulatory compliance integration with carbon credit standards
SNX:
- Protocol complexity in synthetic asset pricing mechanisms
- Oracle dependency for accurate price feeds in decentralized environment
- Smart contract upgrade management across multiple blockchain deployments
Regulatory Risks
Market-wide Exposure:
- Carbon credit market regulation uncertain regarding blockchain-based tokenization standards
- DeFi regulatory framework continues evolving, creating compliance uncertainty for both protocols
- Potential restrictions on token trading in select jurisdictions
- Environmental claims verification standards may impact IMPT's value proposition
IX. 2025-2030 Price Forecast Analysis
Short-term Forecast (2025)
IMPT: Conservative range $0.0015225–$0.002625; Optimistic scenario $0.00370125
SNX: Conservative range $0.234696–$0.4191; Optimistic scenario $0.452628
Medium-term Forecast (2027-2028)
IMPT: Projected growth accumulation phase with estimated range $0.00211819–$0.00552883 (36%–50% increase from baseline)
SNX: Projected recovery and stabilization phase with estimated range $0.41673829–$0.554419 (10%–21% increase from baseline)
Key Drivers: Institutional capital inflows, spot and futures ETF launches, ecosystem development and protocol upgrades
Long-term Forecast (2029-2030)
IMPT Base Case: $0.002653837–$0.004738994
IMPT Optimistic Scenario: $0.005118113–$0.006752118 (80%–87% cumulative gains)
SNX Base Case: $0.400221221–$0.533628295
SNX Optimistic Scenario: $0.73565996–$0.768424745 (27%–55% cumulative gains)
Forecast Disclaimer: Price projections are based on historical data analysis and market modeling. Cryptocurrency markets remain highly volatile and unpredictable. Past performance does not guarantee future results.
X. Conclusion: Which Is the Better Buy?
Investment Value Summary
IMPT Advantages:
- Entry point in emerging blockchain-enabled carbon credit market
- Significant upside potential if sustainability sector gains institutional adoption
- Lower market cap provides proportionally higher growth opportunity
- Alignment with environmental, social, and governance (ESG) investment trends
SNX Advantages:
- Established DeFi infrastructure with 51 exchange listings
- Mature tokenomics with 99.88% circulating supply ratio
- Multi-chain deployment (Ethereum and Optimism) enhancing accessibility
- Larger token holder base (86,205 vs 16,778) indicating broader adoption
- Superior 24-hour trading liquidity ($1,790,323.81 vs $31,090.91)
Investment Recommendations
Beginner Investors:
Allocate majority exposure to SNX due to superior liquidity, broader exchange presence, and established DeFi infrastructure. IMPT exposure should remain limited (maximum 15% of allocation) given nascent market development and concentrated liquidity risk. Maintain 50% stablecoin positioning given current market conditions (Extreme Fear sentiment).
Experienced Investors:
SNX positioning suitable for DeFi-focused strategies with established protocol yield mechanisms. IMPT appropriate for dedicated emerging-market allocations seeking asymmetric risk-reward exposure. Consider dollar-cost averaging approach for both given prolonged bearish conditions. Implement options strategies for downside protection.
Institutional Investors:
SNX offers institutional-grade infrastructure with established custodial support and multi-chain deployment suitable for large position management. IMPT represents emerging market opportunity requiring dedicated ESG investment mandate alignment. Both assets require position monitoring given limited price recovery forecasts and extended bear market conditions.
⚠️ Risk Disclaimer: Cryptocurrency markets exhibit extreme volatility with both tokens demonstrating significant drawdowns from historical peaks (-87.1% for IMPT, -98.51% for SNX). Current market sentiment remains in Extreme Fear territory. This analysis is provided for informational purposes and does not constitute investment advice. Conduct independent research and consult financial advisors before making investment decisions. Past performance does not guarantee future results.
Data Snapshot: December 24, 2025, 17:13:33 UTC
None
FAQ: IMPT vs SNX Investment Comparison
I. What are the key differences between IMPT and SNX in terms of market positioning?
Answer: IMPT operates in the blockchain-enabled carbon credit and sustainability sector, allowing users to earn tokens from retail purchases and convert them into carbon credits. SNX functions as a decentralized finance (DeFi) protocol enabling synthetic asset trading, providing exposure to fiat currencies, precious metals, commodities, and cryptocurrencies. These represent fundamentally different market opportunities rather than direct competitors: IMPT targets environmentally conscious consumers, while SNX attracts DeFi-focused participants.
II. How do the current market capitalizations and liquidity profiles of IMPT and SNX compare?
Answer: SNX significantly outpaces IMPT in market metrics. SNX holds a market capitalization of $144,084,078.03 with 24-hour trading volume of $1,790,323.81, ranking 262nd globally. IMPT operates at $3,311,779.47 market capitalization with only $31,090.91 in daily volume, ranking 1,800th. SNX trades on 51 major exchanges across Ethereum and Optimism blockchains, while IMPT is limited to 3 exchanges. This liquidity disparity creates significantly lower execution risk for SNX investors compared to IMPT's concentrated exchange presence.
III. Which token has experienced more severe price decline from historical peaks?
Answer: SNX has suffered a more dramatic decline, falling approximately 98.51% from its all-time high of $28.53 (February 14, 2021) to the current price of $0.4195. IMPT has declined approximately 87.1% from its peak of $0.02042864 (December 15, 2022) to the current price of $0.002623. While both tokens demonstrate extended bearish trends, SNX's steeper drawdown reflects prolonged skepticism within the DeFi sector, whereas IMPT's decline reflects challenges in the emerging carbon credit market.
IV. What does the token supply distribution reveal about maturity levels?
Answer: SNX demonstrates significantly more mature token distribution, with 99.88% of its 343,889,850.10 maximum supply already in circulation. This indicates completed distribution phases and reduced dilution pressure. IMPT shows earlier-stage distribution with only 45.75% of its 2,759,522,759 maximum supply circulating, meaning approximately 1,096,930,509.53 tokens remain locked. This substantial unlocked supply creates future dilution risks for IMPT but also potential catalyst events as distribution accelerates.
V. Which token is more suitable for risk-averse investors given current market conditions?
Answer: SNX is more appropriate for risk-averse investors despite its severe drawdown history. SNX benefits from institutional-grade infrastructure, 86,205 token holders indicating broader adoption, multi-chain deployment, and established custodial support. IMPT's limited exchange presence (3 venues), concentrated liquidity ($31,090.91 daily volume), and nascent market development (16,778 holders) create execution and counterparty risks. Given the current Fear & Greed Index at 24 (Extreme Fear), conservative investors should maintain 50% stablecoin positioning and allocate SNX exposure over IMPT for reduced concentration risk.
VI. What are the price forecast scenarios for both tokens through 2030?
Answer: IMPT projections show conservative 2025 range of $0.0015225–$0.002625 versus optimistic scenario of $0.00370125. By 2029-2030, base case forecasts $0.002653837–$0.004738994, with optimistic scenarios reaching $0.005118113–$0.006752118 (80%–87% cumulative gains). SNX conservative 2025 range is $0.234696–$0.4191 versus optimistic $0.452628. Long-term 2029-2030 base case forecasts $0.400221221–$0.533628295, with optimistic scenarios reaching $0.73565996–$0.768424745 (27%–55% cumulative gains). SNX demonstrates more conservative growth projections despite higher absolute price levels.
VII. What regulatory risks should investors consider for each token?
Answer: IMPT faces specific regulatory uncertainty regarding blockchain-based carbon credit tokenization standards and environmental claims verification procedures. The carbon credit market lacks established regulatory frameworks for blockchain integration, creating compliance uncertainty. SNX operates within the evolving DeFi regulatory environment where government frameworks remain inconsistent across jurisdictions. Both tokens face potential trading restrictions in select regions and ongoing regulatory developments. Investors should monitor environmental credit standards bodies and securities regulators for IMPT, and DeFi-specific regulatory guidance for SNX before establishing positions.
VIII. Should investors pursue dollar-cost averaging or lump-sum allocation given current market sentiment?
Answer: Dollar-cost averaging is recommended for both tokens given the current Extreme Fear market sentiment (Fear & Greed Index: 24) and extended bearish conditions (-52.99% annual decline for IMPT, -80.03% for SNX). Systematic accumulation over 6–12 months reduces timing risk and reduces exposure to sudden volatility spikes common in fear-driven markets. For SNX, the strategy provides superior execution given 51 exchange options enabling flexible position scaling. For IMPT, dollar-cost averaging becomes essential due to concentrated liquidity, allowing gradual entry without triggering significant price slippage. Implement position monitoring with predetermined rebalancing triggers at 25–30% price movements from entry points.
Disclaimer: This FAQ provides informational analysis based on market data as of December 24, 2025. Cryptocurrency markets remain highly volatile and unpredictable. These responses do not constitute investment advice. Conduct independent research and consult qualified financial advisors before making investment decisions. Past performance does not guarantee future results.
* The information is not intended to be and does not constitute financial advice or any other recommendation of any sort offered or endorsed by Gate.